

Nikkei 225 Futures Simple Trade September 16, 2026 (Wednesday) Recap (Chart Commentary)
Good morning!
Let's go over the results of yesterday's trades.
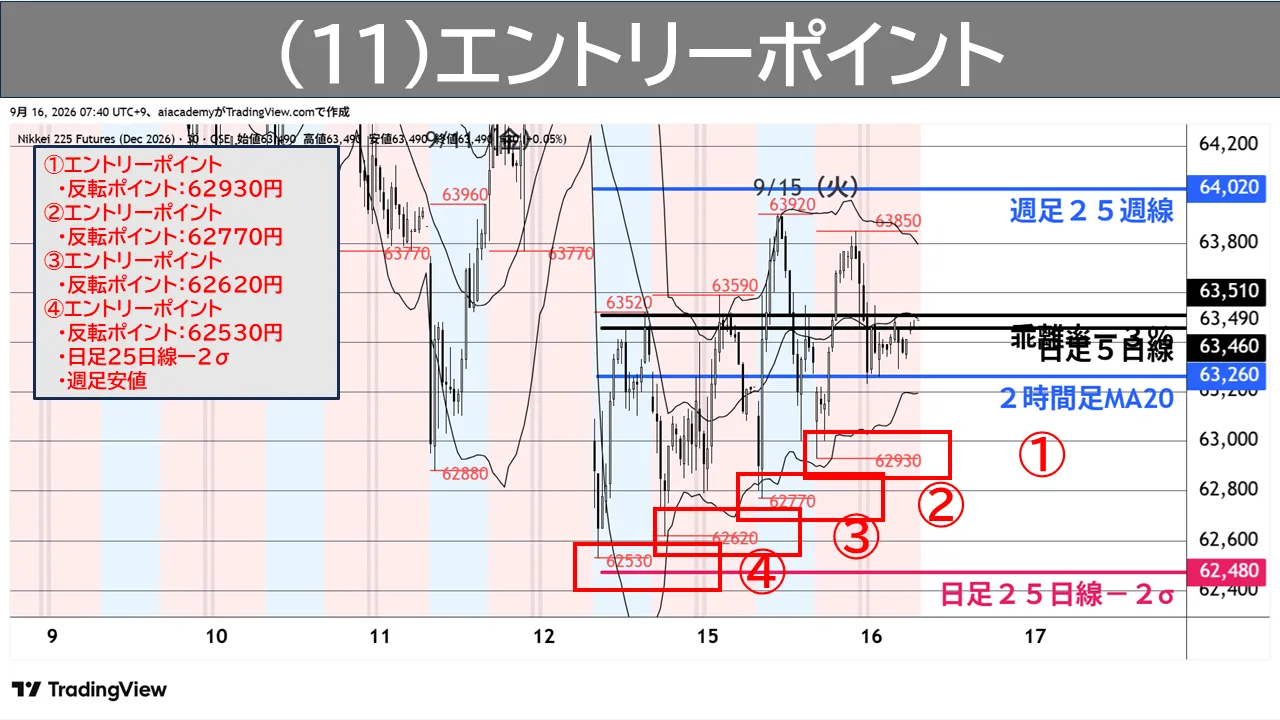
The chart below shows the entry point that was published on the morning of September 16.
On this day, the key points for interpreting the market were as follows. The same as the previous day.
① A downward deviation of -3%, the 25-week moving average on the weekly chart, and the 25-day moving average on the daily chart at -2σ.
② If it reverses upward, pay attention to the 20-period moving average on the 2-hour chart or the 5-day moving average on the daily chart above.
The entry was considered by combining these reversal points, along with a candlestick setup judgment.
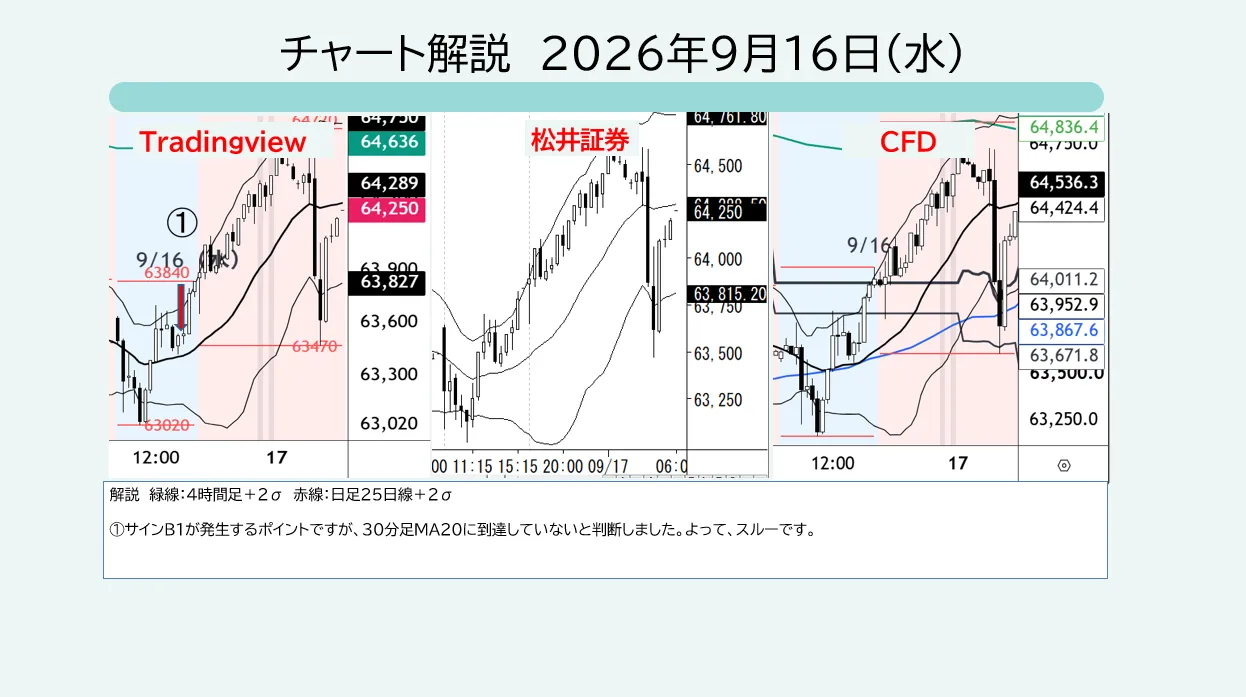
In the lower chart, we will review in detail how each price action moved and how the actual price moved step by step.
This day, it started with a decline.
However, it was a shallow pullback. Signal A1 did not occur.
I feel a tendency for an upside breakout.
After this, it rose and we waited for Signal B1.
Signal B1 is waiting for a reversal on the 30-minute MA20, but unfortunately, it did not drop to the 30-minute MA20.
A pattern that suggests an upside breakout.
These signals alone cannot justify trading, and we do not recommend jumping in.
Therefore, no trade.
There are days like this too.
Thank you for your support today as well.