
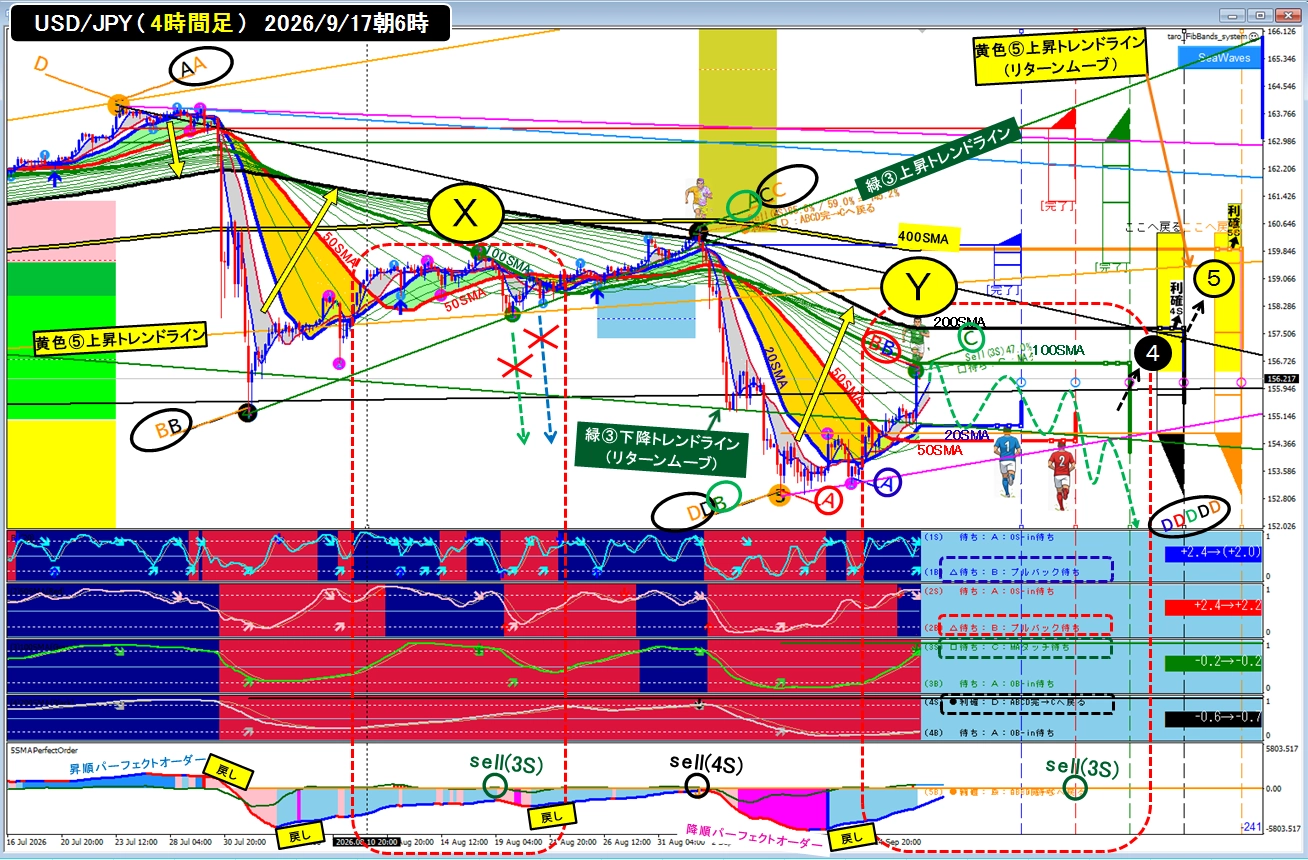
9/17(Thu) 6:00 AM USD/JPY (ABCD Analysis) FOMC policy rate announcement & press conference → rises to near the 4-hour 100-SMA (≈ daily 20-SMA)
In this article,9/12 Weekend USD/JPY ABCD Analysisand its subsequent situation(as of 6:00 AM on 9/17)will be explained.
Article as of the 9/12 weekend
Article as of 9/15 (Tue) 6:00 AM
Article as of 9/16 (Wed) 6:00 AM
<Main Points>
●FOMC policy rate announcement & press conference causes a decline to around the 4-hour 13SMA (roughly the 1-hour 50SMA), then a rise toward just before the 4-hour 100SMA (roughly the daily 20SMA)
●There will be a Bank of Japan policy rate announcement and press conference on Friday, and by the weekend expect waves around the 4-hour blue ① 20SMA and red ② 50SMA, with the green ③ high forming below the 100SMA after which a decline may occur.
<USD/JPY (4-hour) ABCD analysis of SMA lines 20/50/100/200/400>
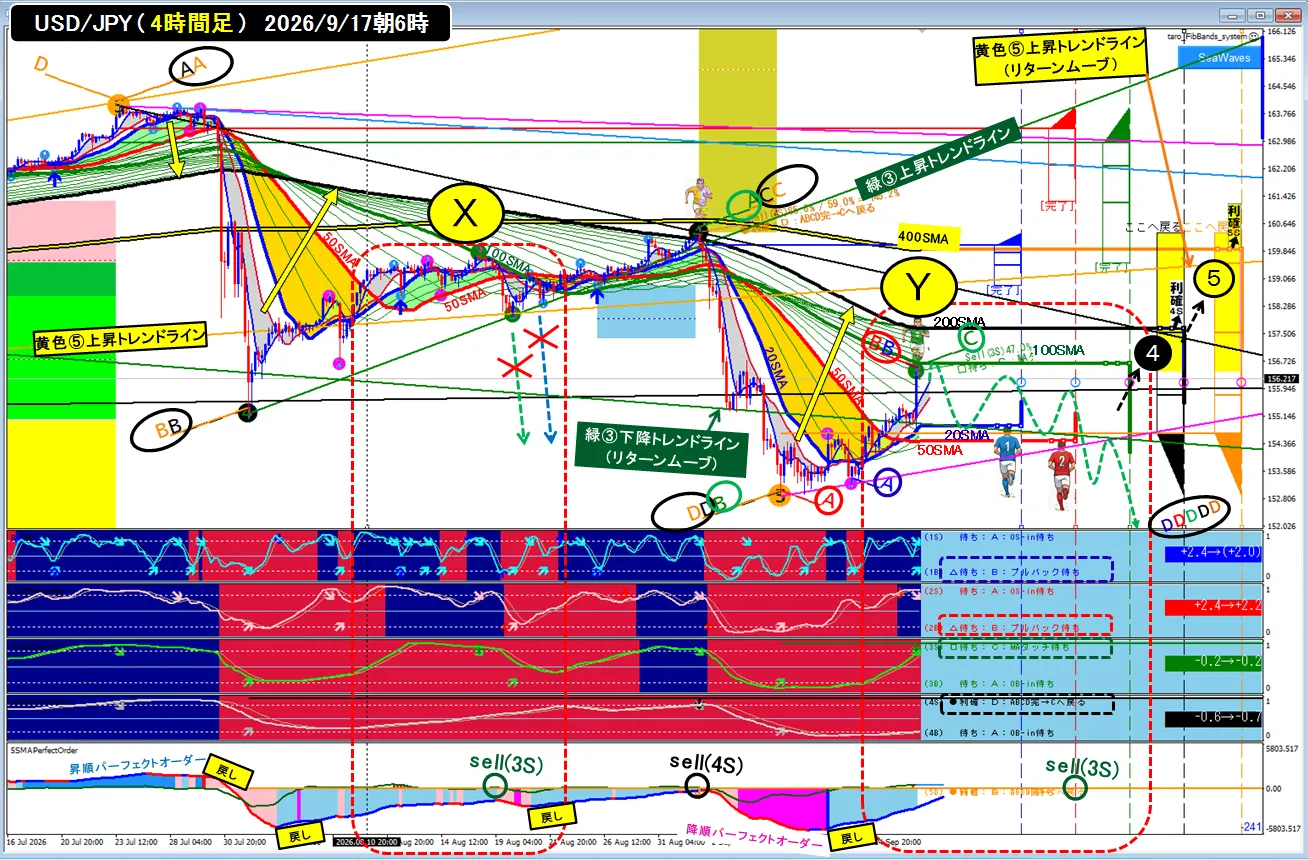
●The above chart is as of 6:00 AM on 9/16 for USD/JPY (4-hour) ABCD alignment of SMA 20/50/100/200/400.
●(In the area surrounded by the red dashed line for points (X) and (Y)), the movement during the retracement toward the 200SMA direction after briefly breaking above the red ② 50SMA is described, but the movements around the FOMC policy rate announcement & press conference are not in the same way as at point (Y); in this case it is insteadsupported by the 13SMA (roughly the 1-hour 50SMA, roughly the 15-minute 200SMA) around which the candlestick bodies are holding and pushing to new highs, continuing toward the 100SMA (roughly the daily 20SMA) just before touch (not yet touched).
●With this rise, point B at red ② is formed, so there is a high possibility of a movement that temporarily returns to blue ① 20SMA or red ② 50SMA and then attempts another high (whether this can actually happen is another matter).
●9/18(Fri) BOJ policy rate announcement & press conference will occur, therefore, with a weekly candle bullish, expect time to adjust as the blue ① 20SMA and red ② 50SMA move in waves below the green ③ 100SMA until Friday, and then rise above. After that, this weekend or next week, expect the green ③ decline ABCD to form and break below the yellow ⑤ low, resulting in a decline.
● Each ABCD situation suggests a green dashed-line wave may form, but this is only a reference, and it is better to judge by which side the candlestick body (close) exits the zone between the green 100SMA (upper) and the red 50SMA (lower).
●If it breaks below, the expected development will occur.
●If it breaks above, then it would form a pattern where the black ④ high is re-lowered under the black 200SMA, with black ④ rising then falling trend turning downward, resulting in a decline. (If it does not create a downward trend below the yellow ⑤ downtrend, then the upward-to-downward transition is not completed, which is not bad, but)
I would prefer a significant dip first before forming it, so I am worried this may cause an upward breakout.
●If the yellow ⑤ breaks above the 400SMA, it will likely fall as a result of turning support/resistance at the green ③ rising trendline (return move) or the upper parts of the blue, red, and green rising trends at the 23.6% retracement of CD, forming a lower high, but this would be difficult, so if possible I would prefer to keep below the green ③ 100SMA and see a new low.
<Finally>
●On 9/18 (Fri) a BOJ policy rate announcement & press conference will occur, time adjustment will be made, and the main focus will be whether the 4-hour blue ① 20SMA and red ② 50SMA wave keeps the green ③ high under the green 100SMA and then declines, and whether from there it falls to complete the green ③ bearish ABCD and make a new low. The plan is to watch whether it breaks upward and stalls at the black 200SMA and yellow 400SMA.