
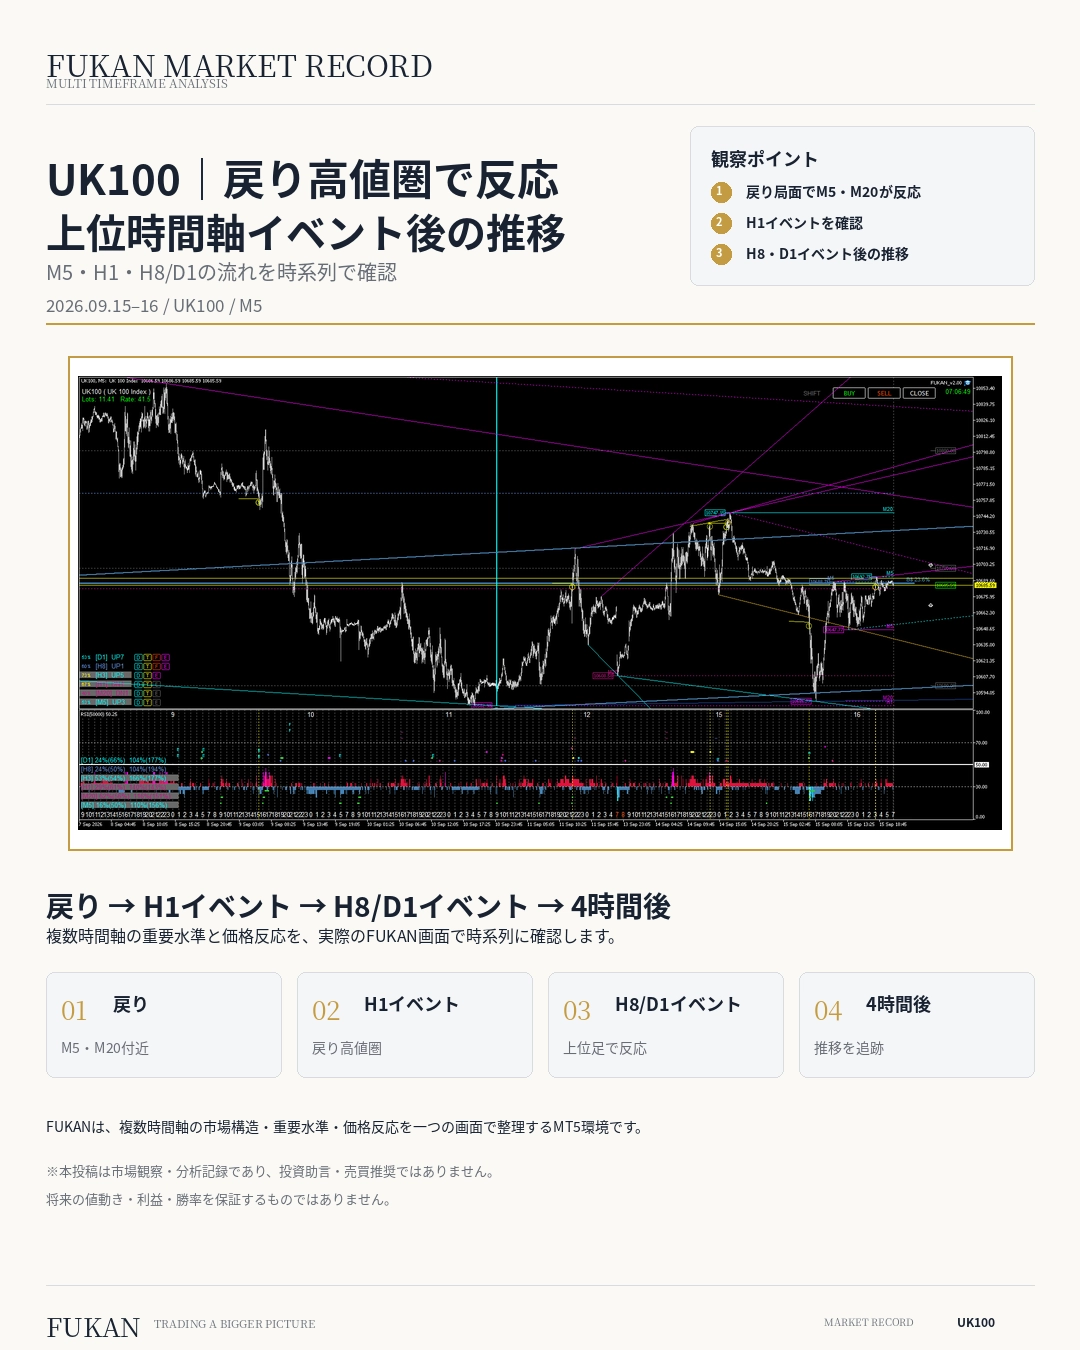
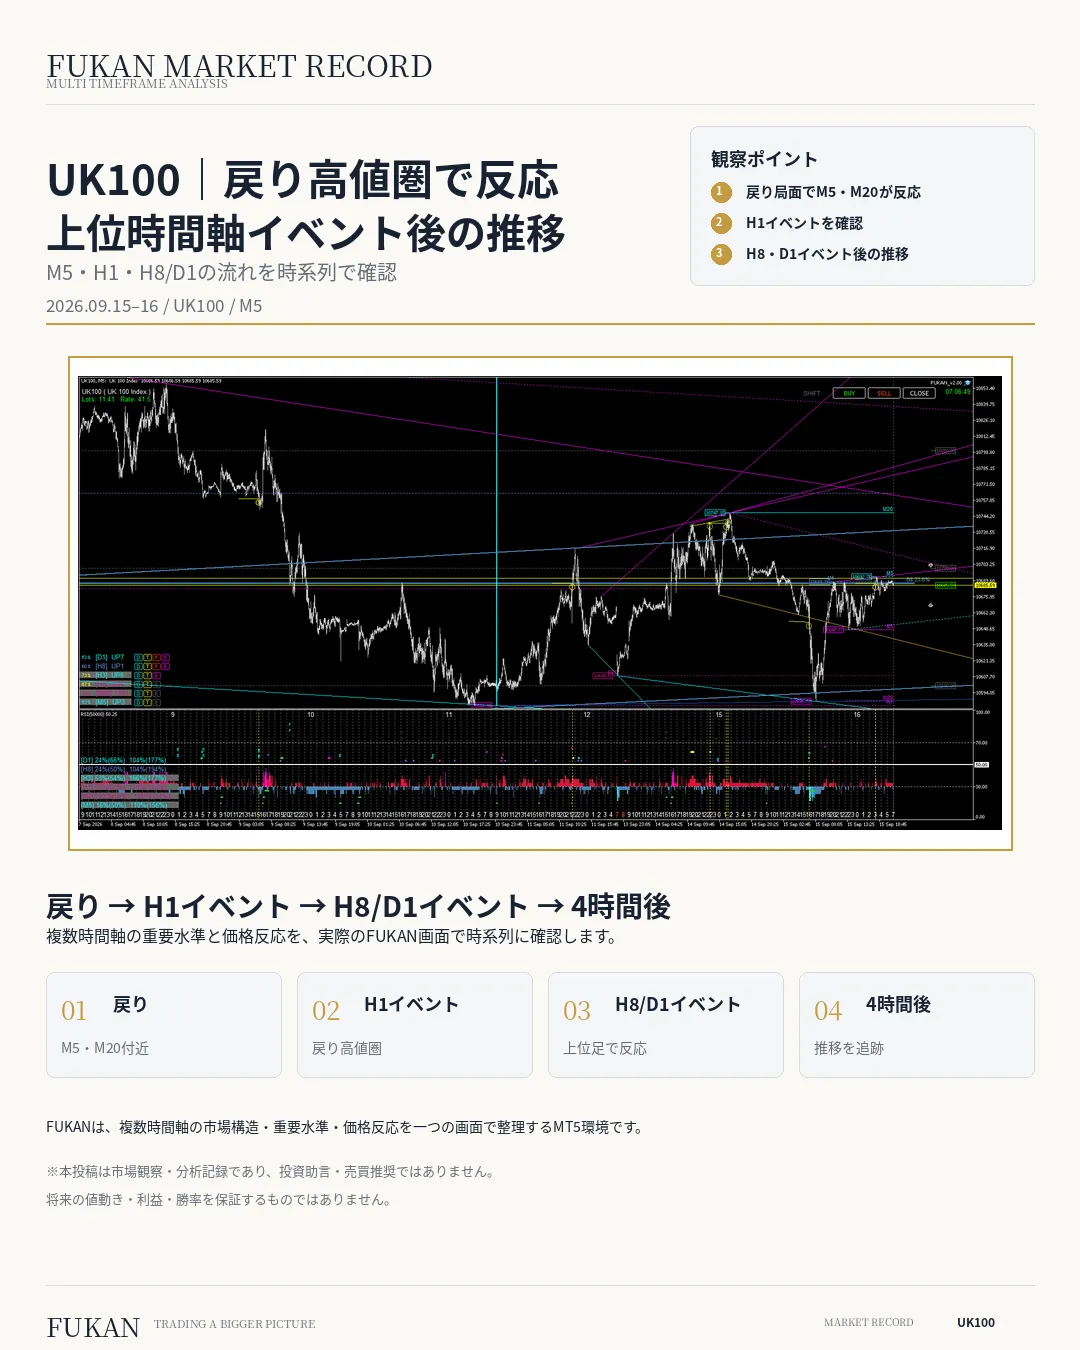
FUKAN Real Market Records|Rebound in the UK100 at the return-to-high-price zone, follow-up movements after higher-timeframe events
FUKAN MARKET RECORD / UK100 / M5
We record in real-time the actual market from September 15, 2026 to September 16, 2026 using the actual FUKAN / MT5 screens, in chronological order.
This time, we trace the flow confirmed in UK100: Pullback → H1 event → H8/D1 event → four hours later.
What FUKAN emphasizes is not predicting the future from a single event. It is to organize where the current price sits within market structure, how overlapping important levels across multiple timeframes relate to the current price, and how the price moved afterward.
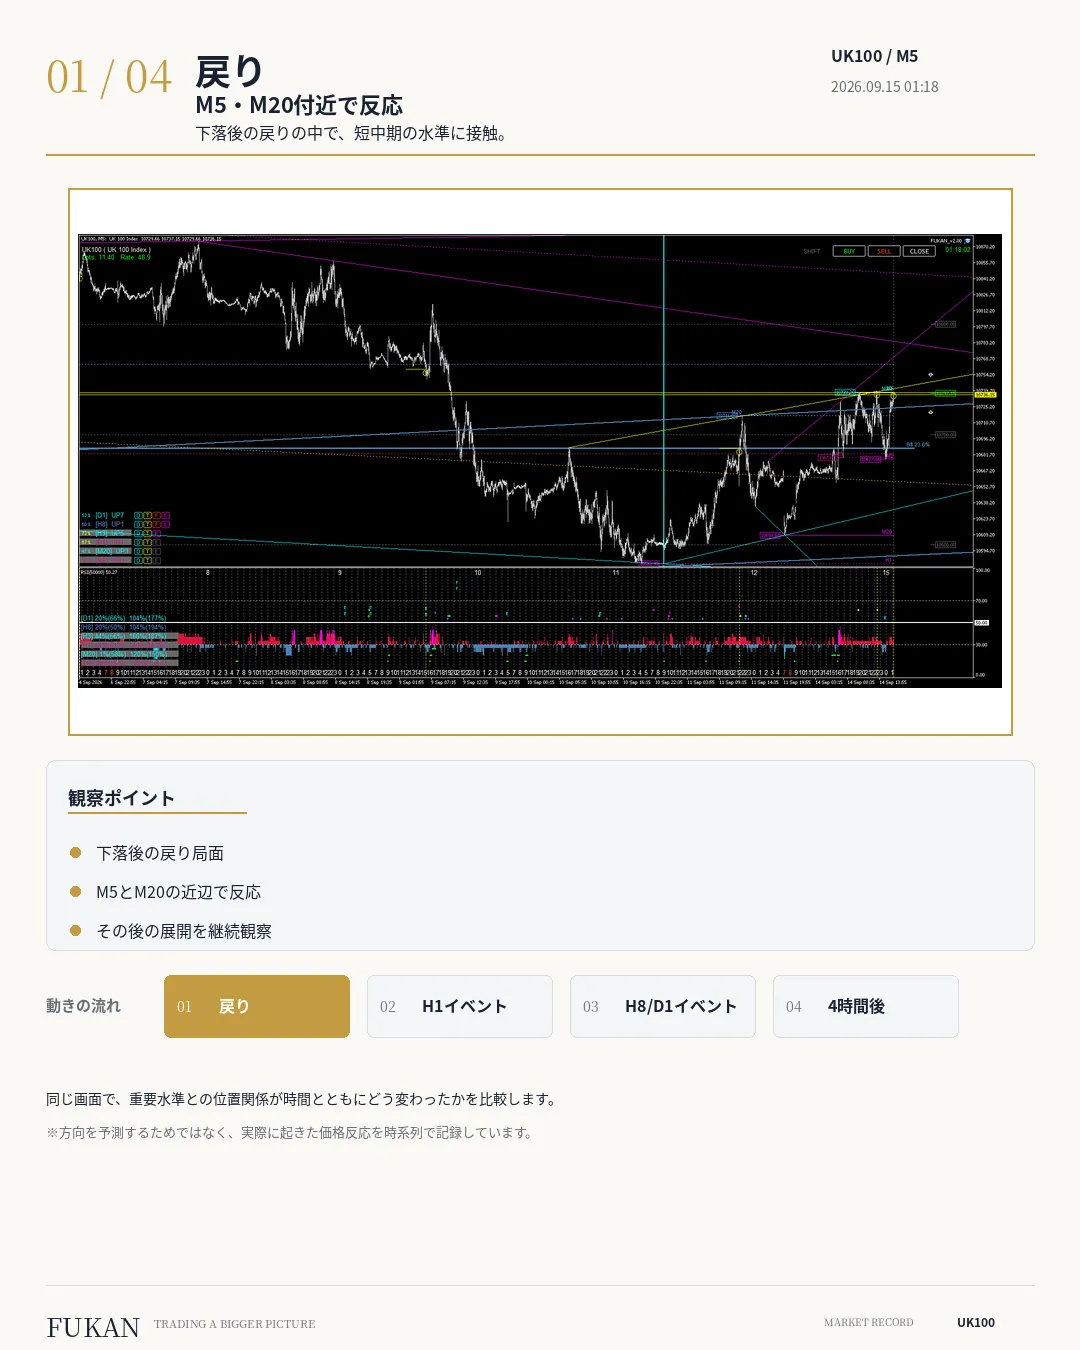
1. Pullback - Reaction near M5 and M20
In the early hours of September 15, UK100 was in a pullback phase after a decline, and the price approached levels near M5 and M20.
What matters here is not deciding with certainty that “this level will always react,” but recording how the price behaves after approaching short-term and mid-term levels.
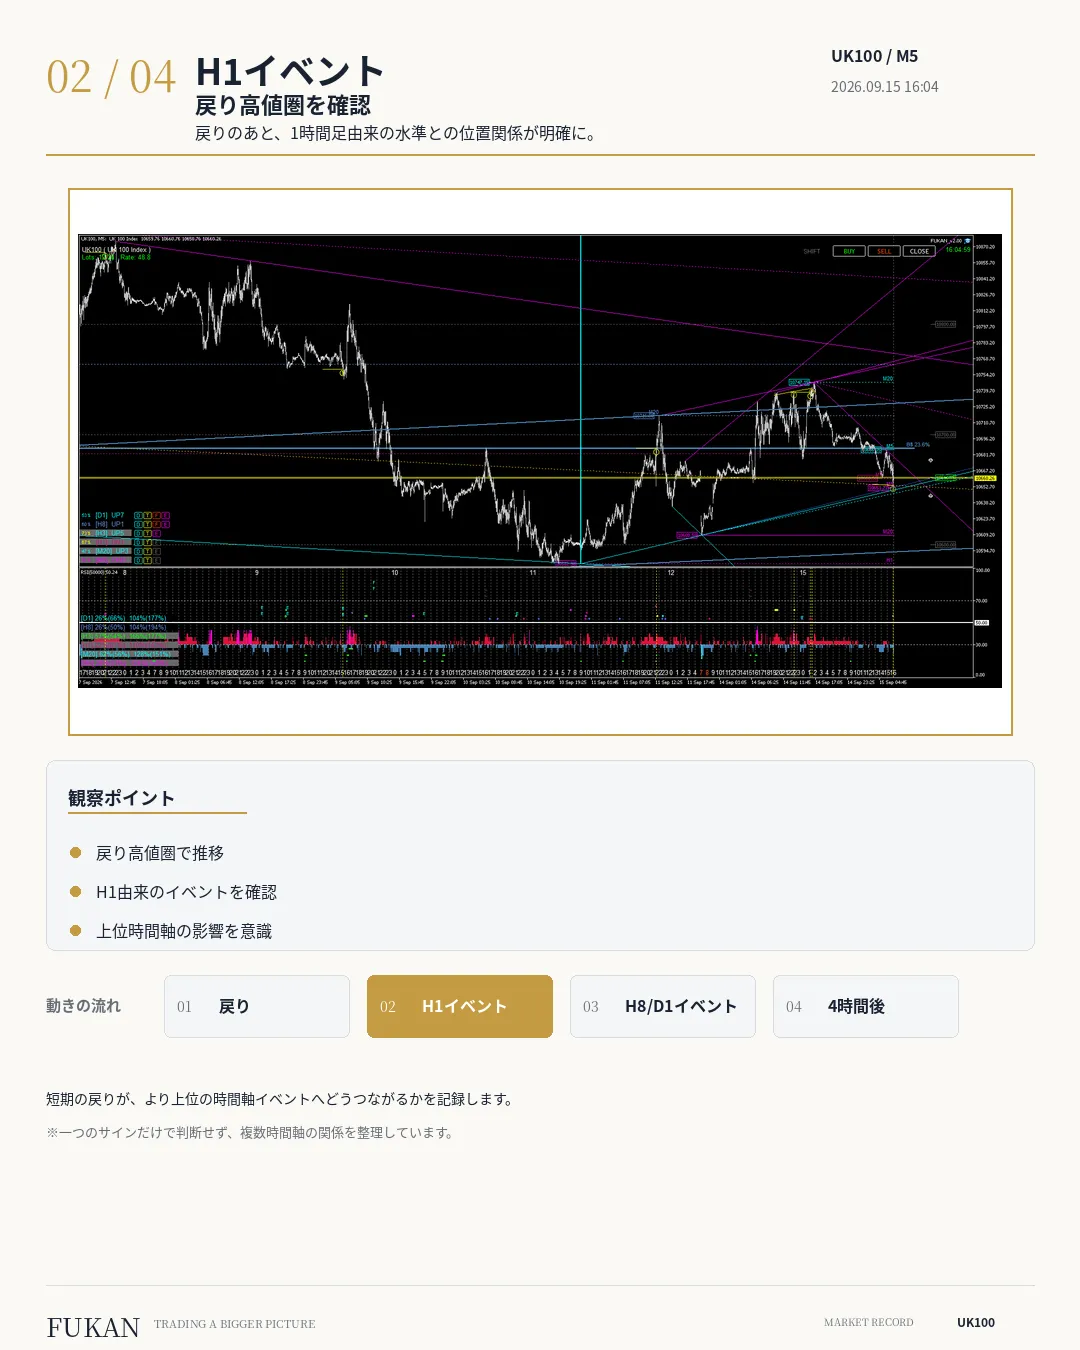
2. H1 event - Confirming the pullback high region
Around 16:00 on the same day, after the pullback, the price moved into a high price region, and an H1-derived event was recorded.
We don’t just look at the short-term pullback; we check how the position of the current price relates to higher-timeframe-derived levels and how they connect.
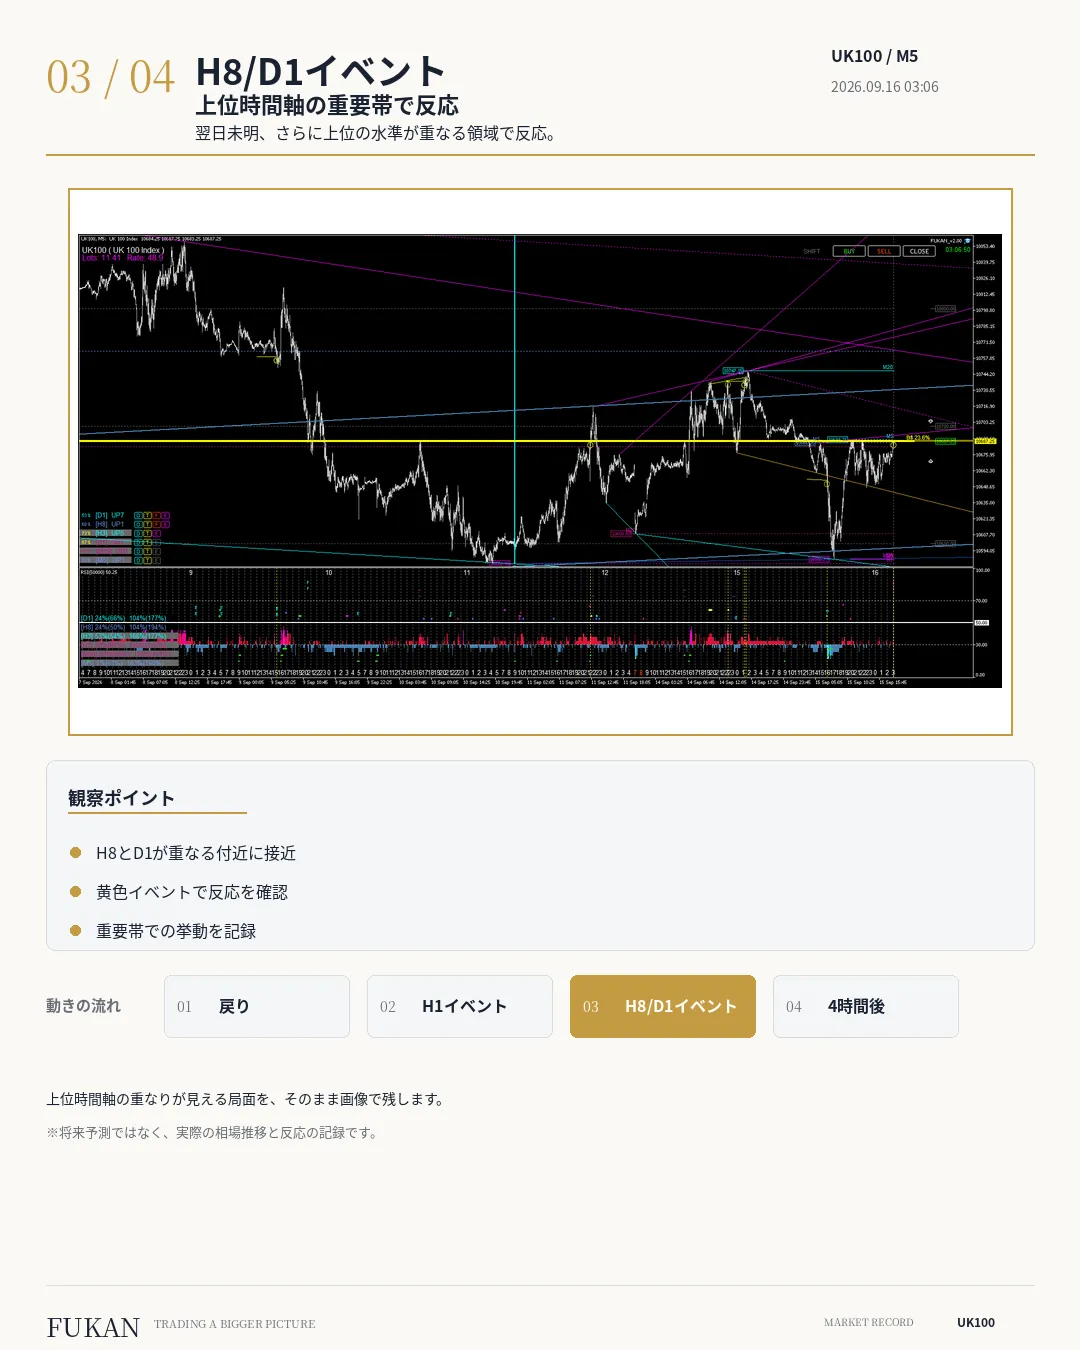
3. H8/D1 event - Reaction at higher timeframe important band
In the early hours of the next day, the price approached near where H8 and D1 overlapped, and a yellow event was recorded.
As the timeframe increases, it becomes harder to judge from a single price movement. Therefore, we record what happened in areas where multiple timeframe levels are in proximity, as a snapshot of the screen at that moment.
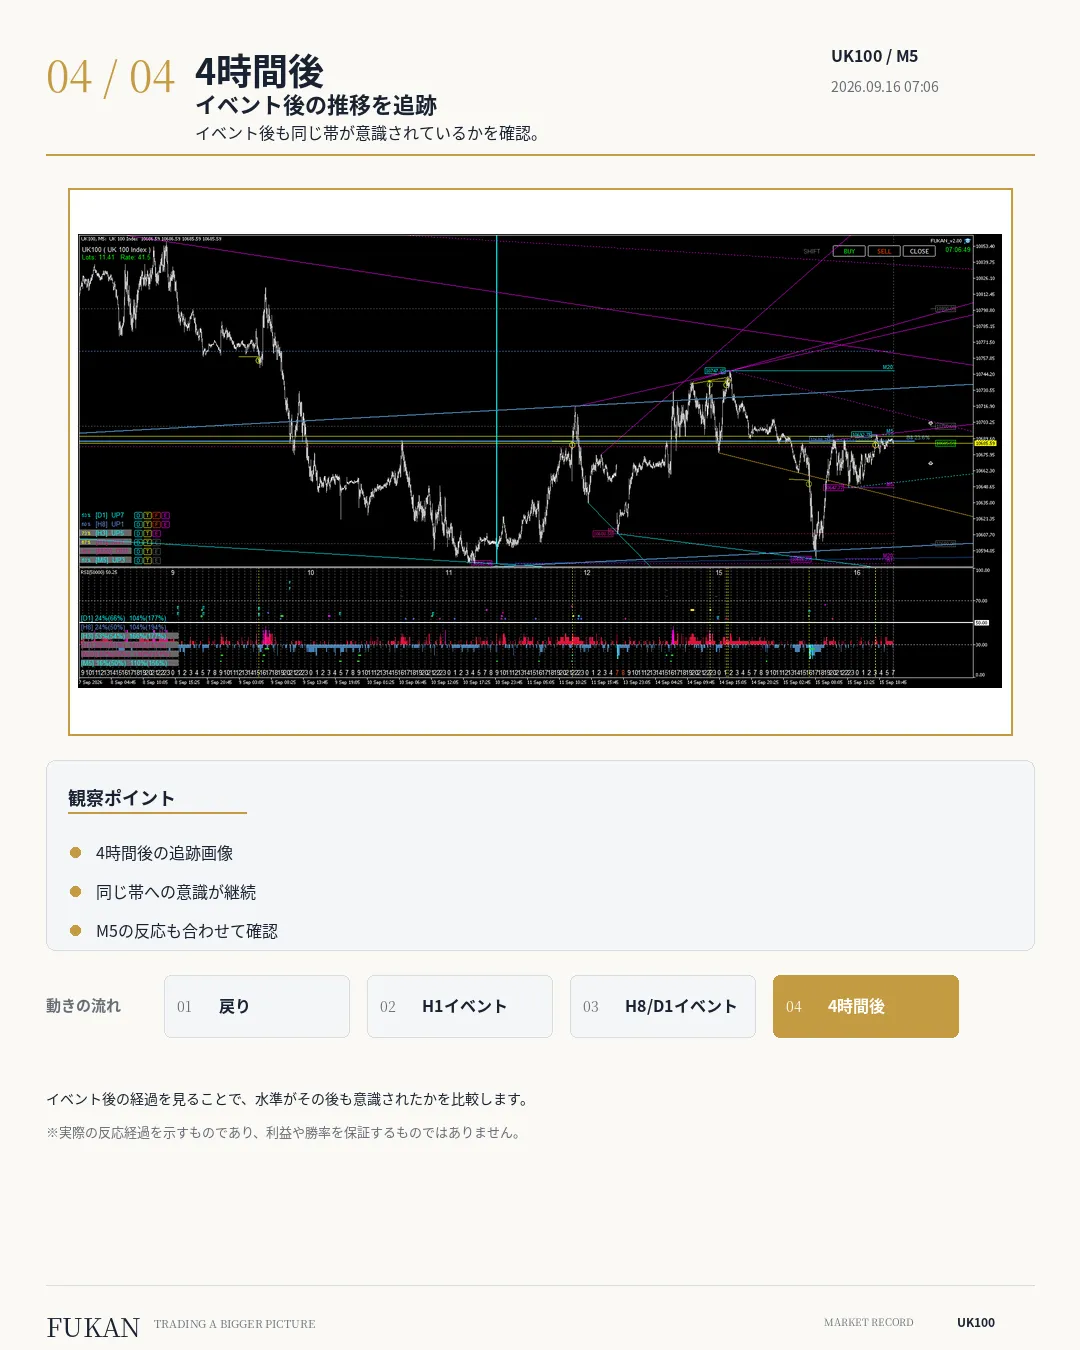
4. Four hours later - Tracking the movement after the event
We not only capture the moment of the event but also the screen four hours later.
We compare whether the same band remains influential and how the short-term relationships, including M5, have changed. By including the post-event progression, it becomes a record that does not just capture a single outcome.
Check the chronology in the video
This flow is summarized so that you can confirm it in the FUKAN Market Record video in the same order. You can view the pullback phase, H1, H8/D1, and up to four hours later in one continuous sequence.
What FUKAN is looking at
FUKAN is not a screen that guarantees the future.
It is an MT5 environment to observe and organize, on a single screen, the market structure across multiple timeframes, important levels, price reactions, and how they have changed over time.
- How far the pullback after a decline progressed
- What happened at short-term and mid-term levels
- How the relationships changed when timeframes increased to H1, H8, and D1
- How the same band was treated after the event
By tracing these relationships before and after, you can understand market flows that are hard to grasp from a single chart image alone.
Summary
In this UK100 case, the focus shifted from the pullback after a decline to the H1 event, and then to the upper timeframe band where H8/D1 overlapped.
By confirming the relationship to the same band four hours later, you can record not only the moment the event occurred but also the subsequent price movement in one continuous record.
Going forward, FUKAN will continue to record actual market activity as it is, including cases where levels were broken and cases where reactions did not occur, rather than selecting only the reacting examples.
It does not guarantee future price movements, profits, or win rates.