
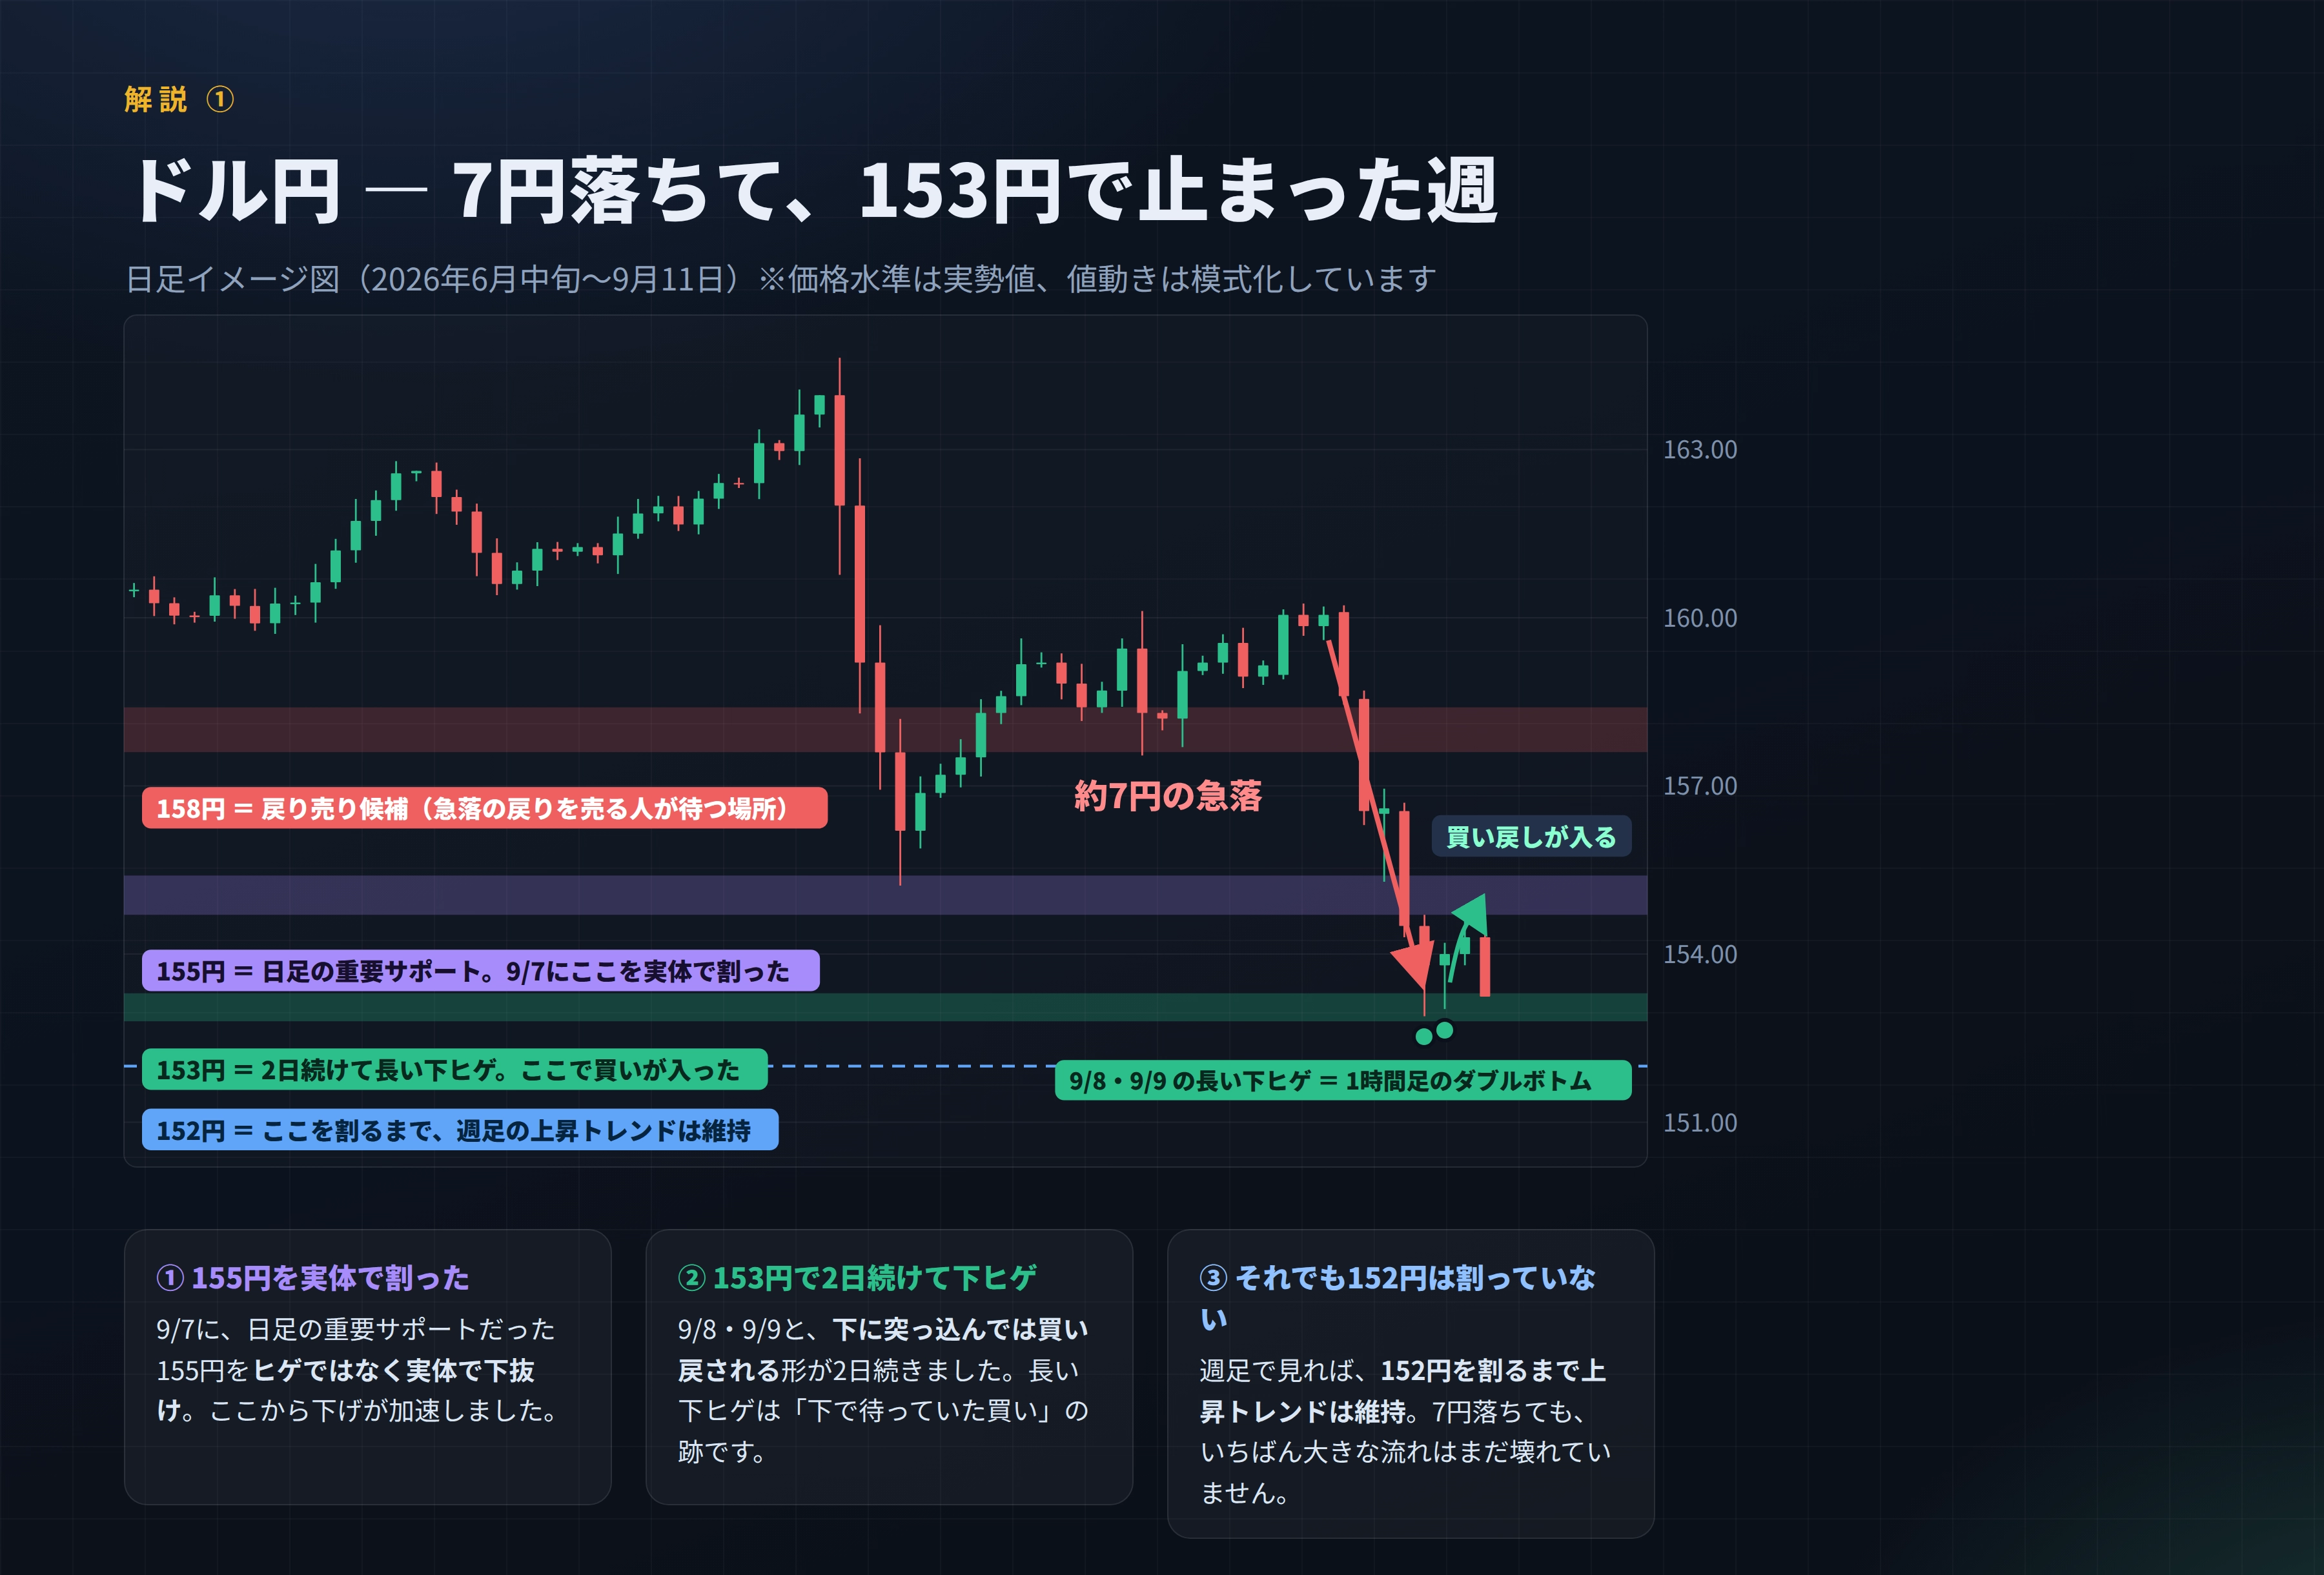
From 160 yen to 153 yen, a drop of about 7 yen. But I could buy at 153 yen. Why?
From 160 yen to 153 yen, about a 7 yen plunge.
But at 153 yen you could buy. Why?
The answer is the "weight of the fundamentals."
"The higher time frame is absolute."
What happened this week
────────────────────────────────
▼ Daily flow
────────────────────────────────
9/7 (Mon) broke below 155 yen with the body (open to close)
→ from here the decline accelerated
9/8 (Tue) test of 153 yen, breaking the lower limit of the daily uptrend channel
→ Long lower wick ①
9/9 (Wed) tested 153 yen again, but could not make a new low
→ Long lower wick ② (higher low)
9/10 (Thu) 1-hour chart forms a double bottom, buying back advances
9/11 (Fri) after US CPI release, price falls again but does not reach 153 yen
→ finishes at 153.24 yen
160 yen → 152.89 yen (weekly low) = about a 7 yen drop
What it means to “break with the body”
Candlesticks have a “body (the thick part)” and “wicks (the thin lines).”
There is
│ ← upper wick
┏━┓
┃ ┃ ← body (between open and close)
┗━┛
│ ← lower wick
・Only the wick crossed the line … temporarily; weak
・The body is beyond the line … closed beyond. Strong
On 9/7, 155 yen was broken “by the body.” Therefore a true break was considered, accelerating the decline.
A long lower wick is a sign of buying after
A long lower wick means
it first dropped sharply
↓
but when it closed, it had bounced back
In other words, it was pushed back by buy orders waiting below
.
★ That happened for two days in a row = many buyers at the bottom
This is the “base building” (bottom formation).
The idea of “weight of fundamentals”
Common misconceptions
When studying FX, you’re usually taught this.
・“The higher time frame (daily, etc.) takes precedence”
・“Moving averages act as a wall”
So many remember “you shouldn’t buy below the 4-hour SMA21”
and keep it in mind.
This time, too, the 4-hour SMA21 was still above.
According to the textbook, it was a scene where you shouldn’t buy.
But in reality
Moving averages act as walls sometimes, and sometimes they don’t.
★ What matters is not the line itself, but the weight of the reason supporting that line
In other words, instead of mechanically deciding by time frame hierarchy,
judge by how many reasons line up at that place.
Think of it as a balance (scale)
Which side is heavier
【Sell side】 【Buy side】
One wall Four reasons
4-hour SMA21 153 yen bottom
 ̄ ̄\____________/ ̄ ̄
▲
(fulcrum)
Even if there is one wall, if the other side has four reasons, it tips that way.
The four supporting reasons on the buy side this time
① It had fallen by 7 yen and was “sold off”
② Two long lower wicks at 153 yen for two days (bottoming)
③ A double bottom formed on the 1-hour chart
④ A breakout above the triangle in the 15-minute chart
★ Wall 1 vs. 4 supporting reasons
→ The price moves toward the heavier side
Sometimes a small-timeframe wave breaks through the higher timeframe wall
as well.
Glossary
【Double Bottom】
Two roughly equal lows are made, and the highs between them
are broken to the upside. It looks like a “W.”
Often used as a sign that the bottom is in.
【Triangular consolidation】
Highs move lower, lows move higher, and the range narrows
to form a triangle. After the narrowing, a big move in one direction follows.
【Bottoming (base-building)】
A price range where the price repeatedly stops falling, and the lows become firm.
This expresses the intention to buy and not let prices go lower from here.