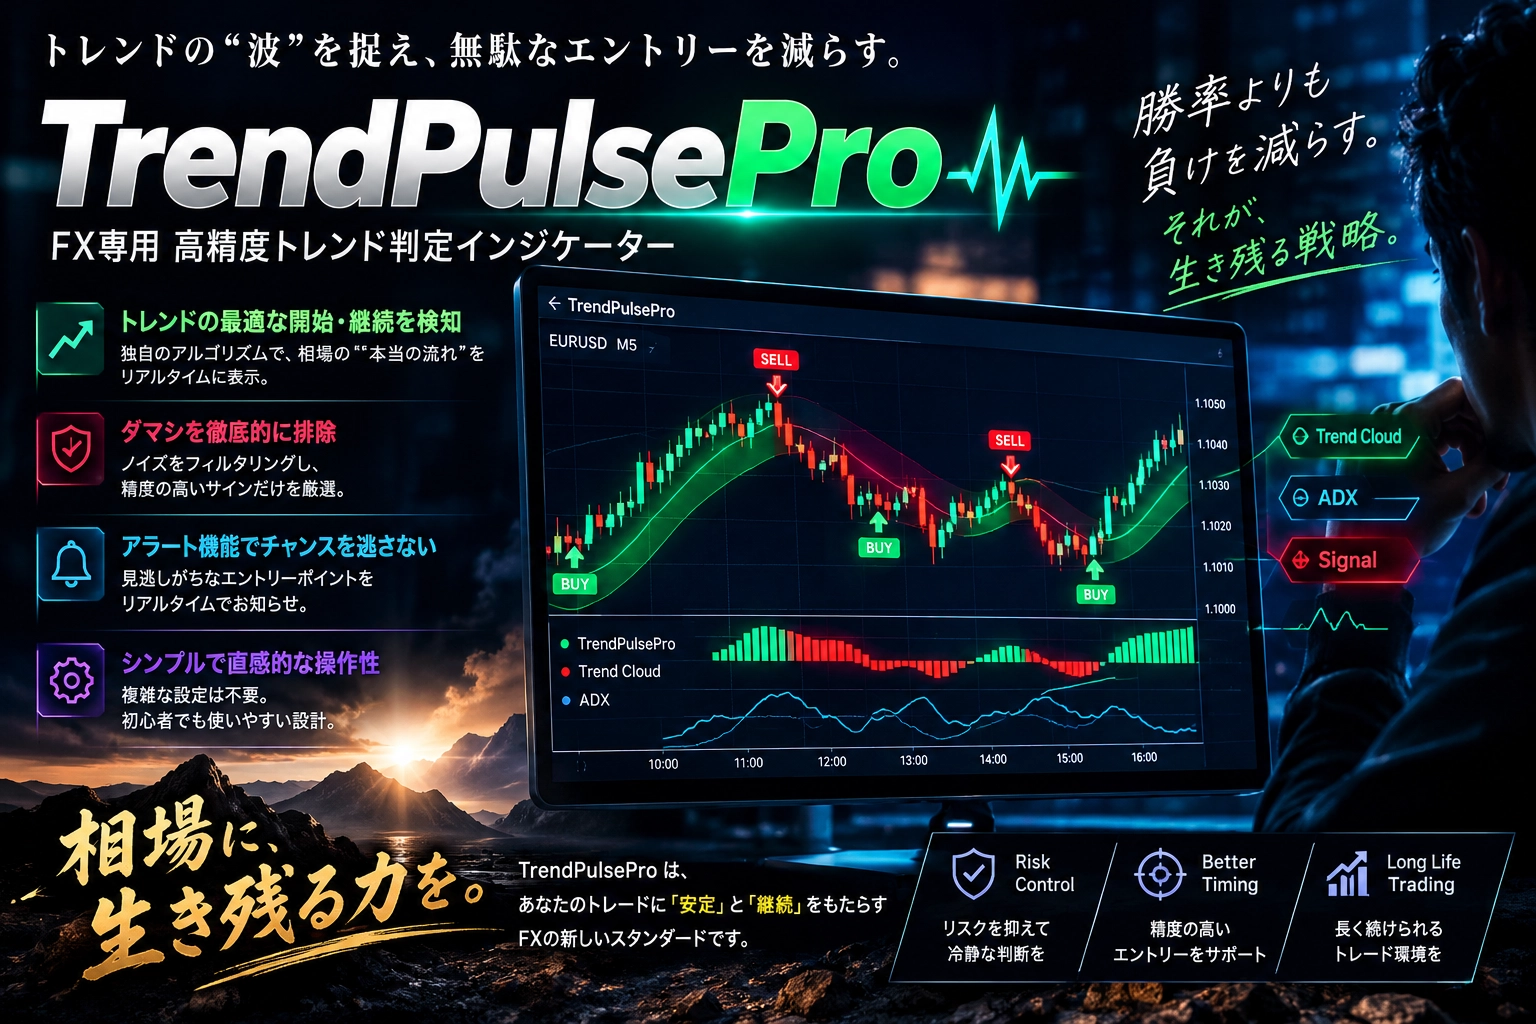
[Practical Manual] Operational procedures and risk management to fully automate trend from early movement to settlement with TrendPulse Pro
Thank you for always visiting us.
In this article,
long-term environmental recognition, momentum judgment, anti-false signal filter, and automatic TP/SL calculation
are integrated into the professional TrendFollowing system “TrendPulse Pro.” We will provide practical operation procedures and the internal design’spros and conswithout hiding them.
1. Basic system structure and how to read the screens
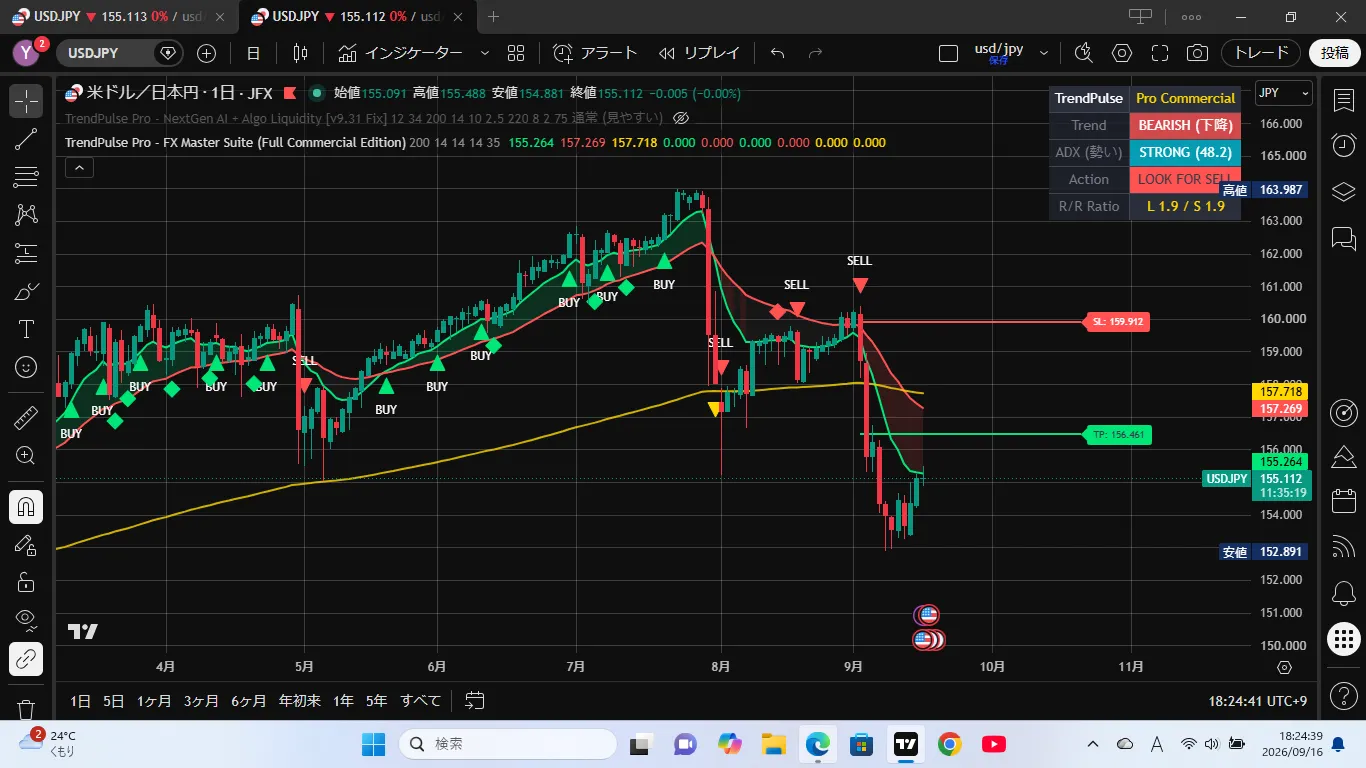
TrendPulse Pro is designed so that the drawing elements on the chart and the real-time dashboard at the top right are fully synchronized.
Market environment recognition 200 EMA (yellow line)
Judges the higher-level trend perspective. If the price goes up, signals are narrowed to buy only; if down, signals are narrowed to sell only.
Trend Cloud (band)
Visualizes the space between the short-term EMA (12) and the long-term EMA (34).Green indicates an uptrend,red indicates a downtrend,gray indicates a range (wait-and-see)。
Initial diamond (◆)
A signal that lights up early at trend reversals or momentum surges.Forewarning signal.
Core trading signals (▲/▼)
After clearing EMA, ADX, RSI, and recent highs/lows breakout conditions,high-accuracy entry signals.
Dynamic TP/SL lines
When the signal lights up, based on ATR,horizontally drawn lines (green: TP, red: SL)are automatically drawn.
2. Three-step practical entry & exit
【Step 1: Check the environment on the dashboard】
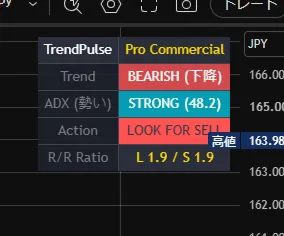
Check the panel at the top right of the screen.
Trend is BULLISH (up)orBEARISH (down)
ADX is STRONG (18+ / strong momentum)
Action is LOOK FOR BUY / SELL
Make sure this is the case.
【Step 2: Enter when the signal lights up】
Initial diamond (◆) lights up, observe the chart,core signal (BUY/SELL arrow) is confirmed, or the panel switches toBUY NOW / SELL NOW, at which point you execute the entry.
※If the dashboard environment is fully aligned, you can also enter on a diamond signal, but in that case we recommend shallower profit-taking and tighter stop-loss.
【Step 3: Place an OCO order】
Simultaneously with the signal lighting, on the chartgreen (take profit target) andred (stop loss line)horizontals are drawn. Enter the displayed price into your brokerage’s“OCO order (simultaneous take profit and stop loss)”and let the decision be made without emotion.
(Note: TP targets may not always be reached; please judge final exit based on candle momentum and your discretion.)
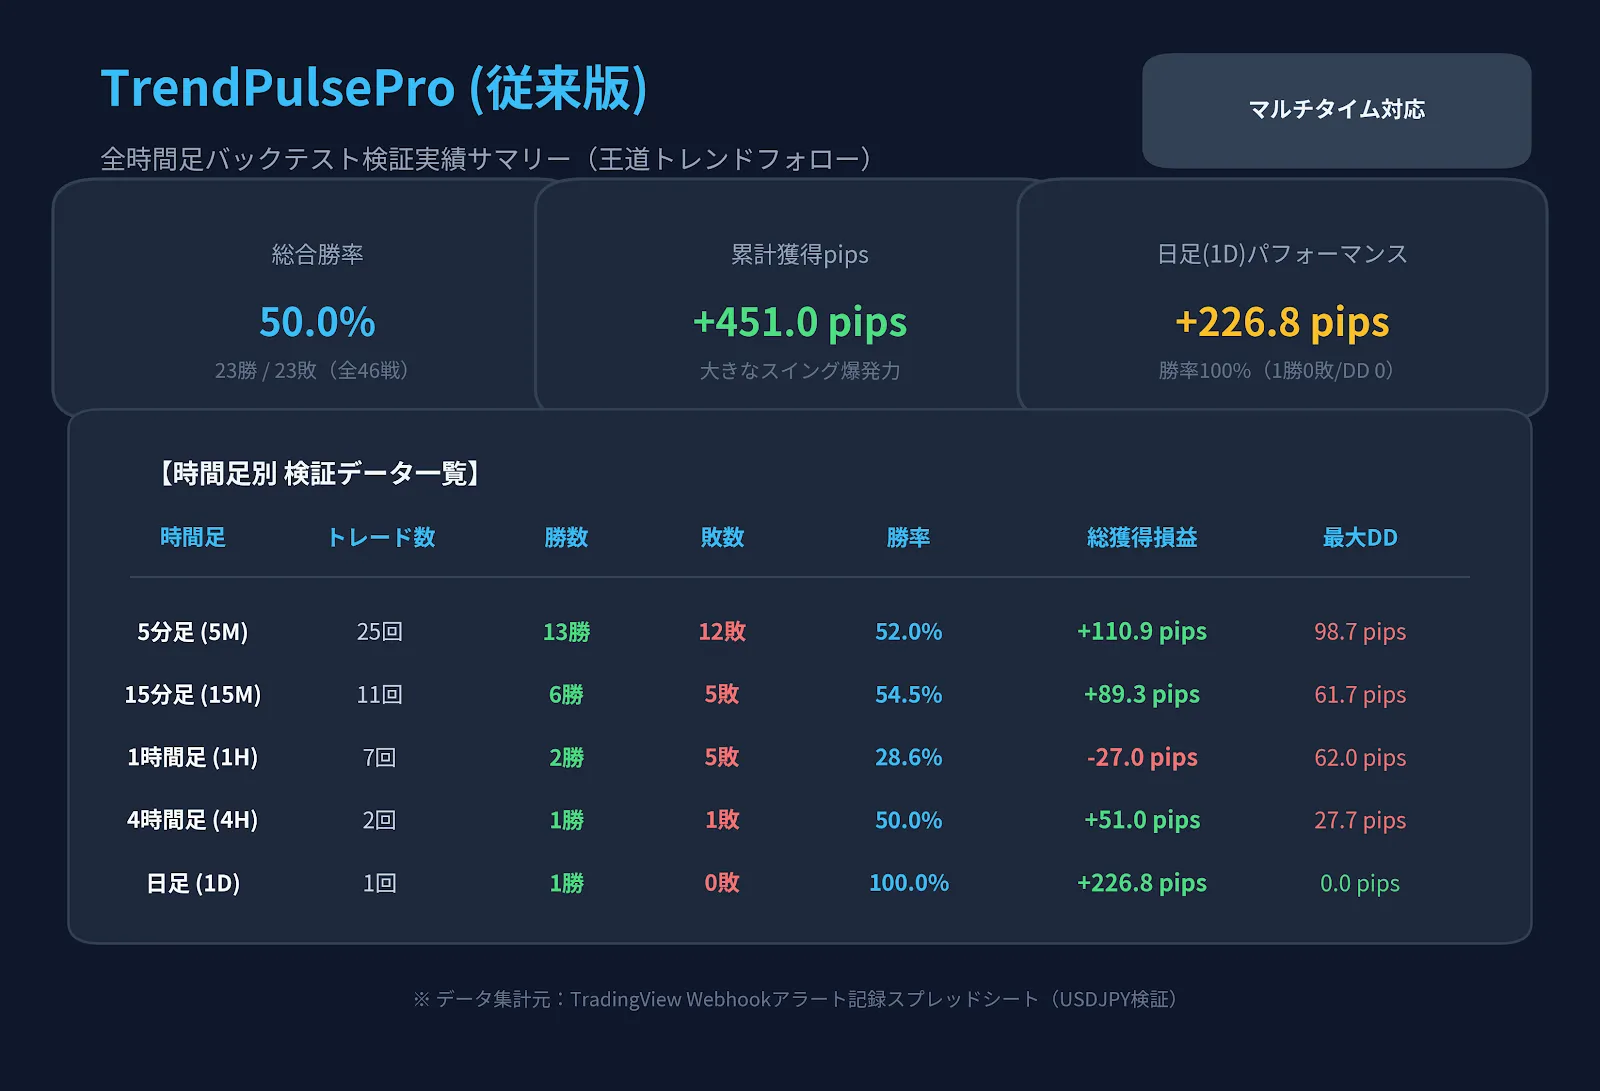
3. Strengths (Strong Points) of this tool
Dynamic optimization by timeframe
From 5-minute to daily and higher, internal parameters (EMA period, TP/SL multiplier, ADX/RSI thresholds) automatically adjust to each timeframe.
No need to change settings from scalping to swing trading.
High-precision double filter
Volatility judgment by ADX and RSI overbought/oversold filter strongly suppress false signals in ranging markets with small moves.
Immediate notification alerts
Alerts from this indicator do not wait for bar closure; they trigger immediately on the moment criteria are met for each bar, enabling prompt response to rapid moves.
4. Structural weaknesses and avoidance tips
During sudden volatility spikes such as major indicator releases, wicks (noise) may touch SL and then move in the intended direction.
In the dashboard Trend section, if you see “DANGER (sudden change)” or “warn of top/bottom,” or just before/after economic indicators, refrain from entering and stay flat.
Alert repainting risk (signal disappearance before bar closes)
Because we use immediate reporting, signals that light up mid-bar may disappear just before bar close due to a sudden reversal.
If you prefer more conservative trading,confirm that the candlestick body has closed with the signal still presentbefore entering.