

The scenario we expect in the future is
https://www.gogojungle.co.jp/tools/indicators/86097
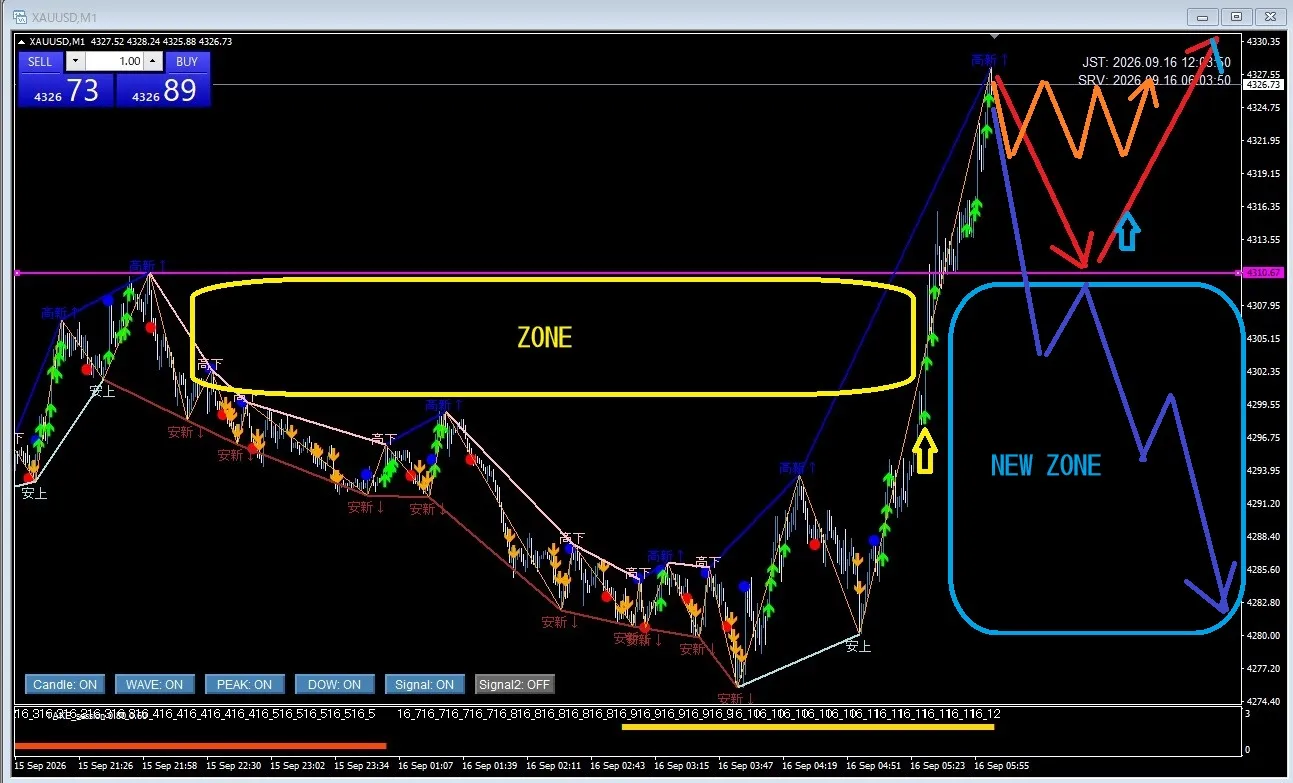
In the previous article, the point I went long on was the yellow arrow.
I took profit at the pink horizontal line, which was the target for the five-minute high.
If you view this on a one-minute chart, it fills the zone described manually, but afterward it continued to rise without dropping.
For the scenario I’m looking forward to toward the London open, I would like a pullback during a brief correction to form a basing point.
This is the area drawn with the red line.
Then I want to catch a re-acceleration signal (around the blue arrow).
Alternatively, if it breaks the pink horizontal line again, a new zone will be found (blue frame).
There’s even a possibility of a full retracement during Tokyo time.
But I’m not sure how it will actually go.
Around noon, I think it might stay in range for a while (orange wavy line).
If that happens, there’s no need to force trades, right?
For the time being, it’s best not to touch it for a while, going forward.