
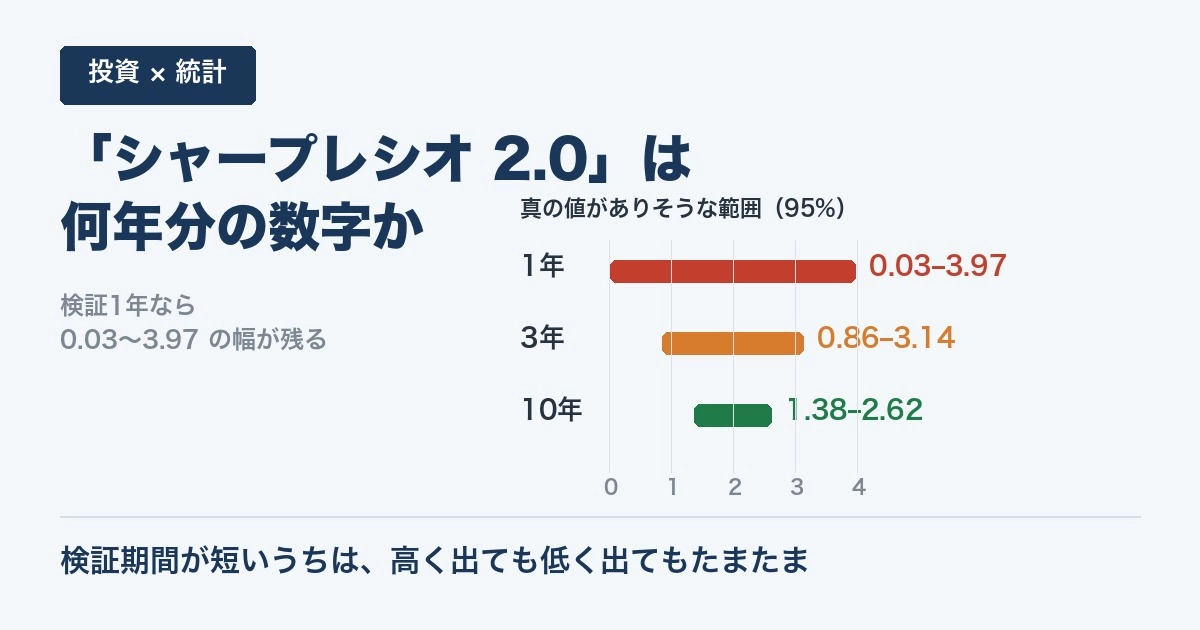
The 1-year validation of "Sharpe Ratio 2.0" has no meaning other than 0.03 to 3.97
Assume the backtest results state "Sharpe Ratio 2.0." In general, 2.0 is considered an excellent level.
However, that numberdepends on how many years of data were used to calculate it, and the way it is read changes completely.
Even with the same 2.0, the reliability differs by validation period
The Sharpe ratio is the return divided by its volatility (standard deviation). What is easy to overlook here is thatthe denominator volatility is itself an estimate, so both the numerator and the denominator are estimates, and the error can be larger than you expect.
When the observed Sharpe ratio is 2.0, calculating, for each validation period, the range in which the true value is likely to fall (daily data, 95% confidence interval) yields the following.
| Validation period | Number of data points | Range in which the true value is likely to lie | Width |
|---|---|---|---|
| 1 year | 252 | 0.03 ~ 3.97 | 3.94 |
| 2 years | 504 | 0.61 ~ 3.39 | 2.78 |
| 3 years | 756 | 0.86 ~ 3.14 | 2.27 |
| 5 years | 1,260 | 1.12 ~ 2.88 | 1.76 |
| 10 years | 2,520 | 1.38 ~ 2.62 | 1.24 |
With 1 year of data, a 2.0 result means“it could be almost zero or near 4.0”. The number is shown, but it hardly provides any basis for judgment.
The lower bound only reaches 0.86 after 3 years, and 1.12 after 5 years.The Sharpe ratio tends to be unstable when the validation period is short; it does not simply vary within a small range.
If it says “annualized,” check the original frequency
One more reason the number appears large: it is annualized.
When converting the Sharpe ratio to an annual rate, multiply the per-period value by the square root of the number of periods. The same “0.1 per period” yields different results depending on the original frequency.
| Original frequency | Conversion | Annualized Sharpe Ratio |
|---|---|---|
| Daily | 0.1 × √252 | 1.59 |
| Weekly | 0.1 × √52 | 0.72 |
| Monthly | 0.1 × √12 | 0.35 |
The exact same “0.1 per period” becomes 1.59 if daily, or 0.35 if monthly.The shorter the horizon, the larger the annualized Sharpe ratio tends to appear.
This is not a statement that the calculation is wrong. It is a conventional conversion. However, when you compare annualized figures against other products, the shorter horizon can make the performance seem stronger than it actually is.
Which of the many trials produced the 2.0
Furthermore, if you try many different parameter sets and adopt the best performing one, that best value has been uplifted by optimization.
In a real example where 89 variations of moving-average crossover were tested and the best performing setting during the learning period was applied to the validation period, the Sharpe ratio dropped from 1.295 to 0.242. The market did not suddenly change, nor did the logic change.
The method to adjust Sharpe ratio for the number of trials is called the Deflated Sharpe Ratio, and it is statistically formalized.Only after knowing the number of trials can you separate whether 2.0 is skill or luck.
Four points to verify on sales materials
- Validation period and number of data points— If 1–2 years, read assuming a wide estimation range
- Daily vs. monthly frequency— If only the annualized figure is stated, the meaning changes with the original frequency
- How many parameter sets were tested— Selecting the best artificially boosts the numbers
- Is the same level maintained forward?— The most direct check is whether it holds outside the validation period
This is not about avoiding high-Sharpe products.Even with the same 2.0, 1 year and 10 years yield different numbers— It is simply a matter of reading with awareness of the range. This reduces the probability of misjudgment.
About the author
We have released a free PDF at GogoJungle that compiles the confirmation steps above into a fillable checklist and a 6-question template for asking vendors.
- EA sales page 5-minute checklist [Free](Free, A5, 8 pages)
The derivation of estimation errors (including corrections for autocorrelation) and the statistical correction for the number of trials using the Deflated Sharpe Ratio are covered in detail in the paid version.
Both are PDF materials created by the author. They do not indicate whether a specific EA or product should be purchased, and the numerical examples in the text are fictitious for explanation. Please make your final investment decisions at your own risk.