

Nikkei 225 Futures Simple Trade September 15, 2026 (Tuesday) Review (Chart Commentary)
Good morning!
Let's review the answers to yesterday's trades.
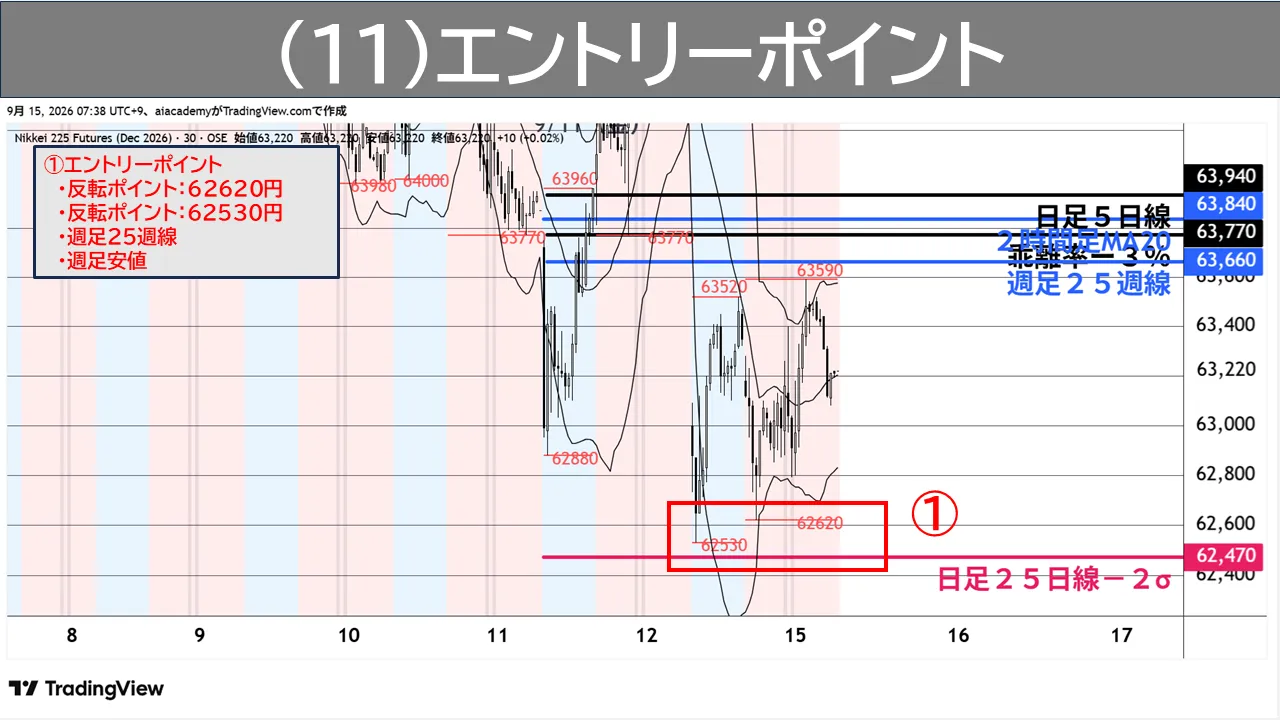
The chart below shows the entry point that I distributed on the morning of September 15.
For those who viewed the distribution, what points were you conscious of when watching the market?
On this day, the notable points for interpreting the market were as follows. The same as the previous day.
① There is a downward deviation of -3%, the weekly 25-week moving average, and the daily 25-day moving average at -2σ.
② If it reverses upward, pay attention to the MA20 on the 2-hour chart or the 5-day moving average on the daily chart above.
The entry was determined by considering the combination of this reversal point and the candlestick setup.
In the chart below, we will carefully review step by step how each price action and actual movement unfolded.
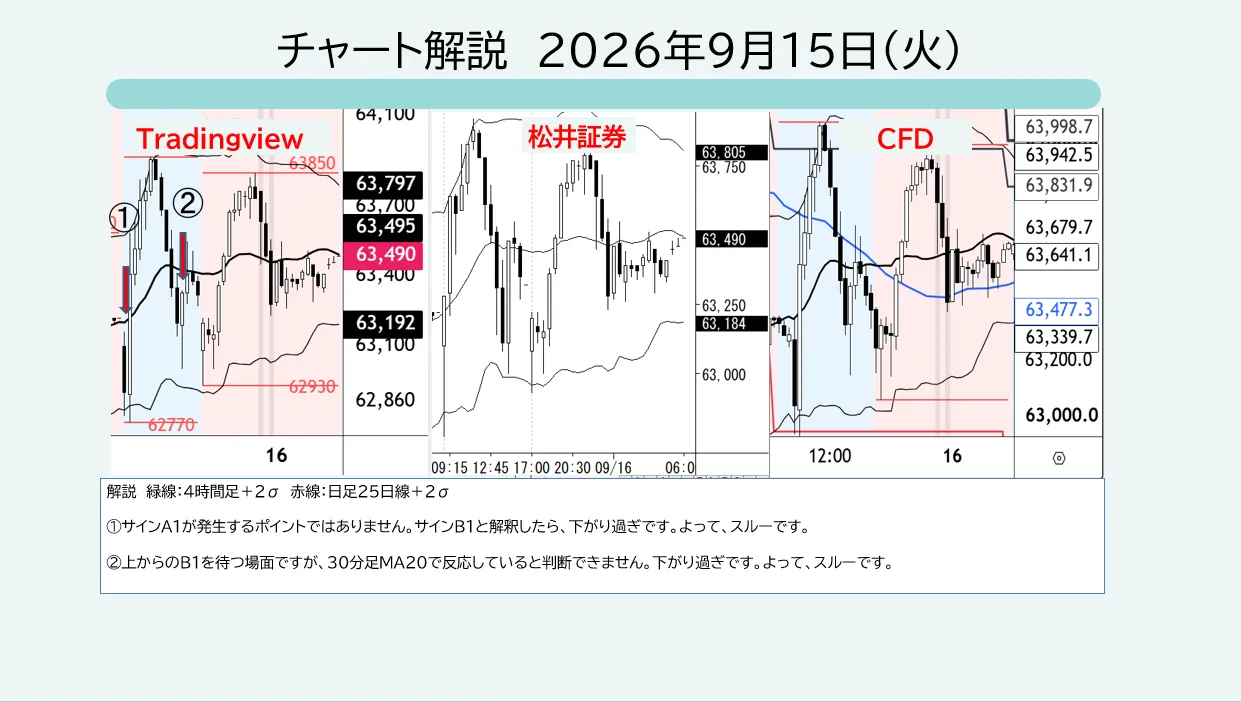
It started with a decline again today as well.
Chart explanation ①: This is not the point where Signal A1 occurs.
If interpreted as Signal B1, it does not seem to respond on the 30-minute MA20, so we skip it.
Chart explanation ②: This is a moment waiting for a reversal from above with B1.
It reverses here, but it does not appear to be reversed on the 30-minute MA20.
It has fallen too far. Therefore, we skip it.
The reason is not clear, but FOMC or the Bank of Japan policy meeting is approaching.
Movement remains in a weak wave, making judgments difficult in the market.
Thank you for your continued support today as well.