
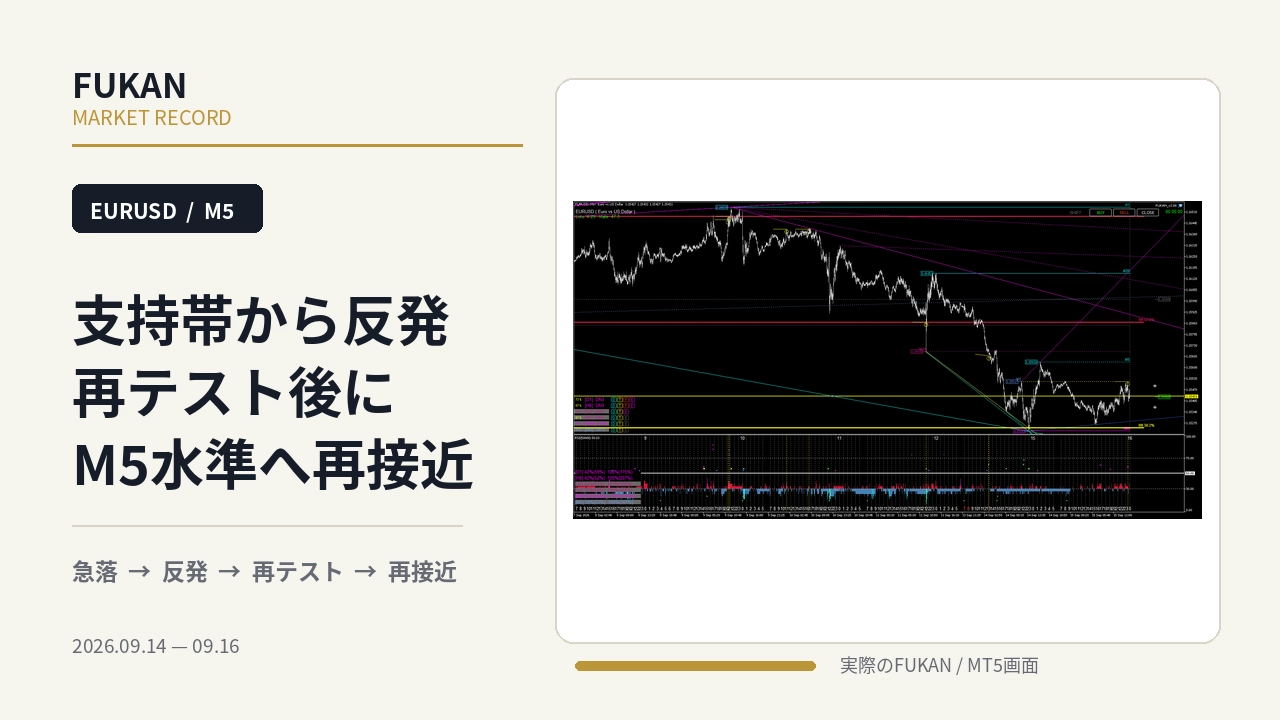
FUKAN real market records | EURUSD rebounds from support area, re-test, and approaches M5 level again
FUKAN MARKET RECORD / EURUSD / M5
We record the real-time market activity from September 14 to September 16, 2026 on the actual FUKAN / MT5 screen in chronological order.
This time, we follow the flow confirmed in EURUSD: Sharp decline → reaction at the support zone → rebound → retest → approaching the M5 level again.
What FUKAN emphasizes is not predicting the future from a single signal. It is about organizing where the current price is in market structure and how price reacts to key levels, in conjunction with information from multiple timeframes.
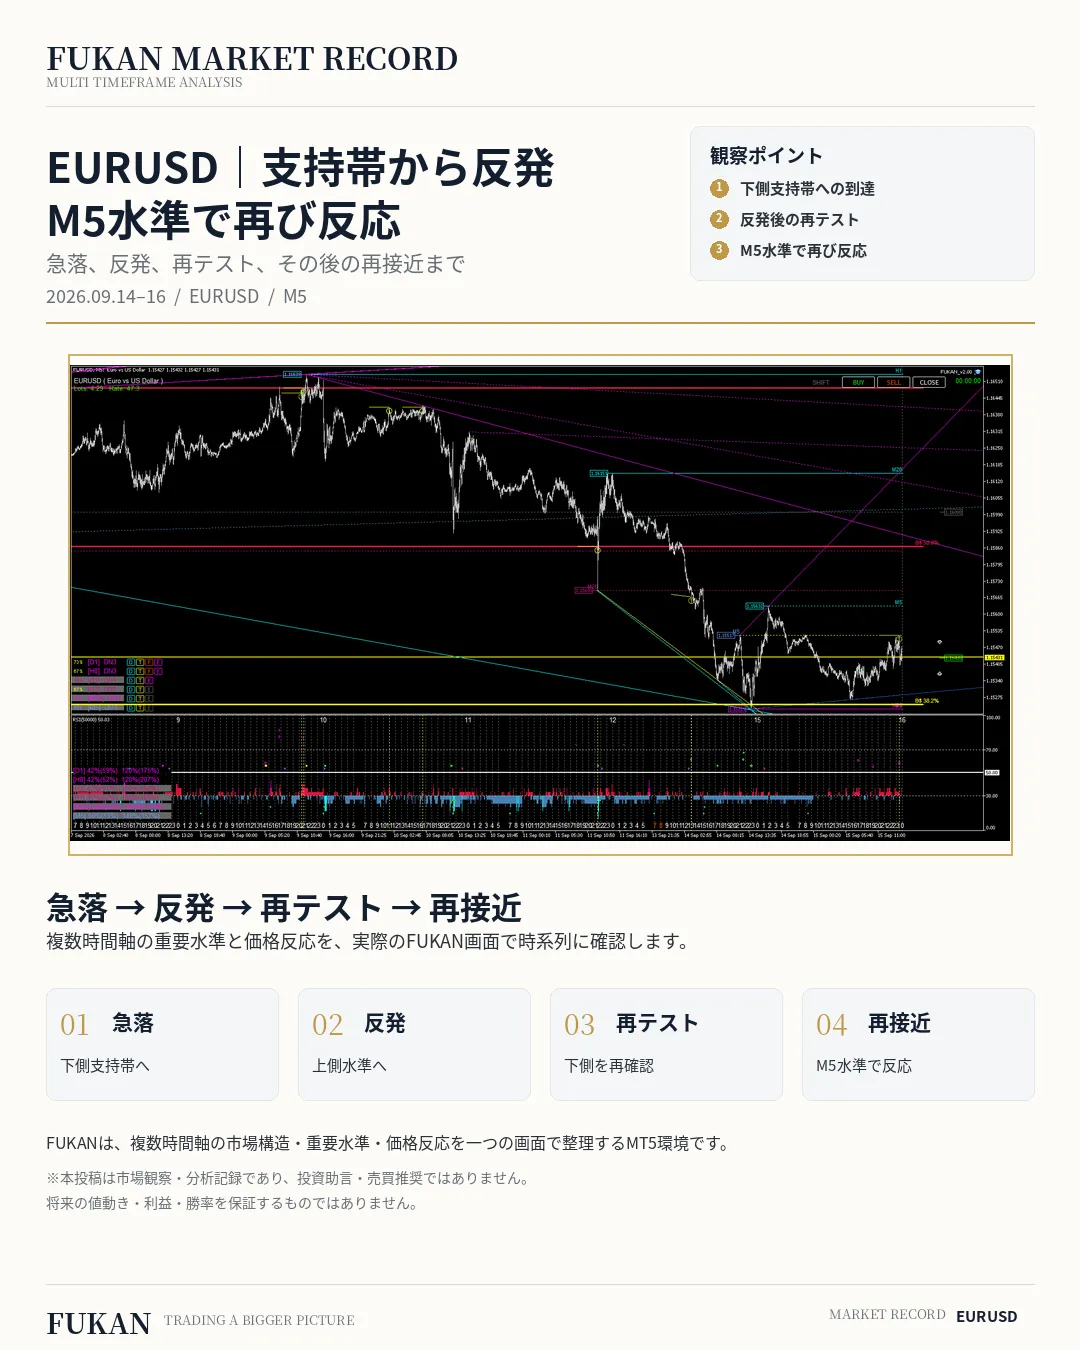
1. Sharp decline - reaching the lower confluence support zone
On September 14, EURUSD accelerated downward, and price reached a critical lower region.
In this scene, multiple timeframe lines were in proximity. The key is not to assume “it will surely rebound here,” but to observe how price actually reacts after reaching this region.
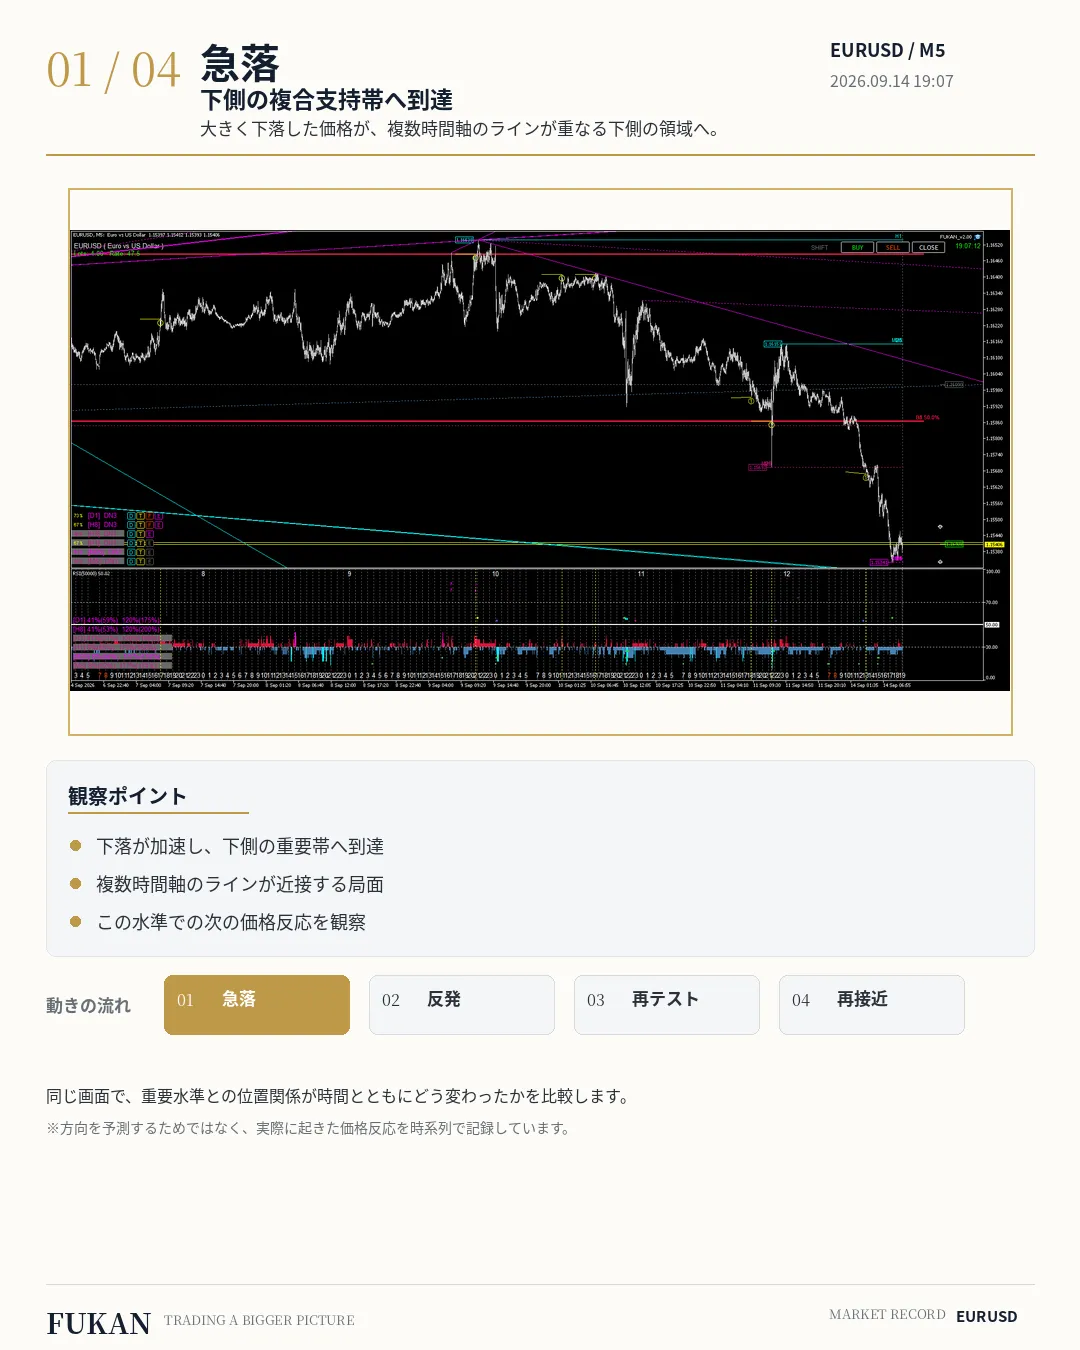
2. Rebound - from the lower support zone to the upper M5 level
Subsequently, price reaction at the lower support zone was confirmed, and the price moved back upward from the low area.
After the rebound, the relationship to the M5 level shown above becomes the next observation target. Rather than simply noting that it rose, we track how far price returns to what level and what happens at that level.
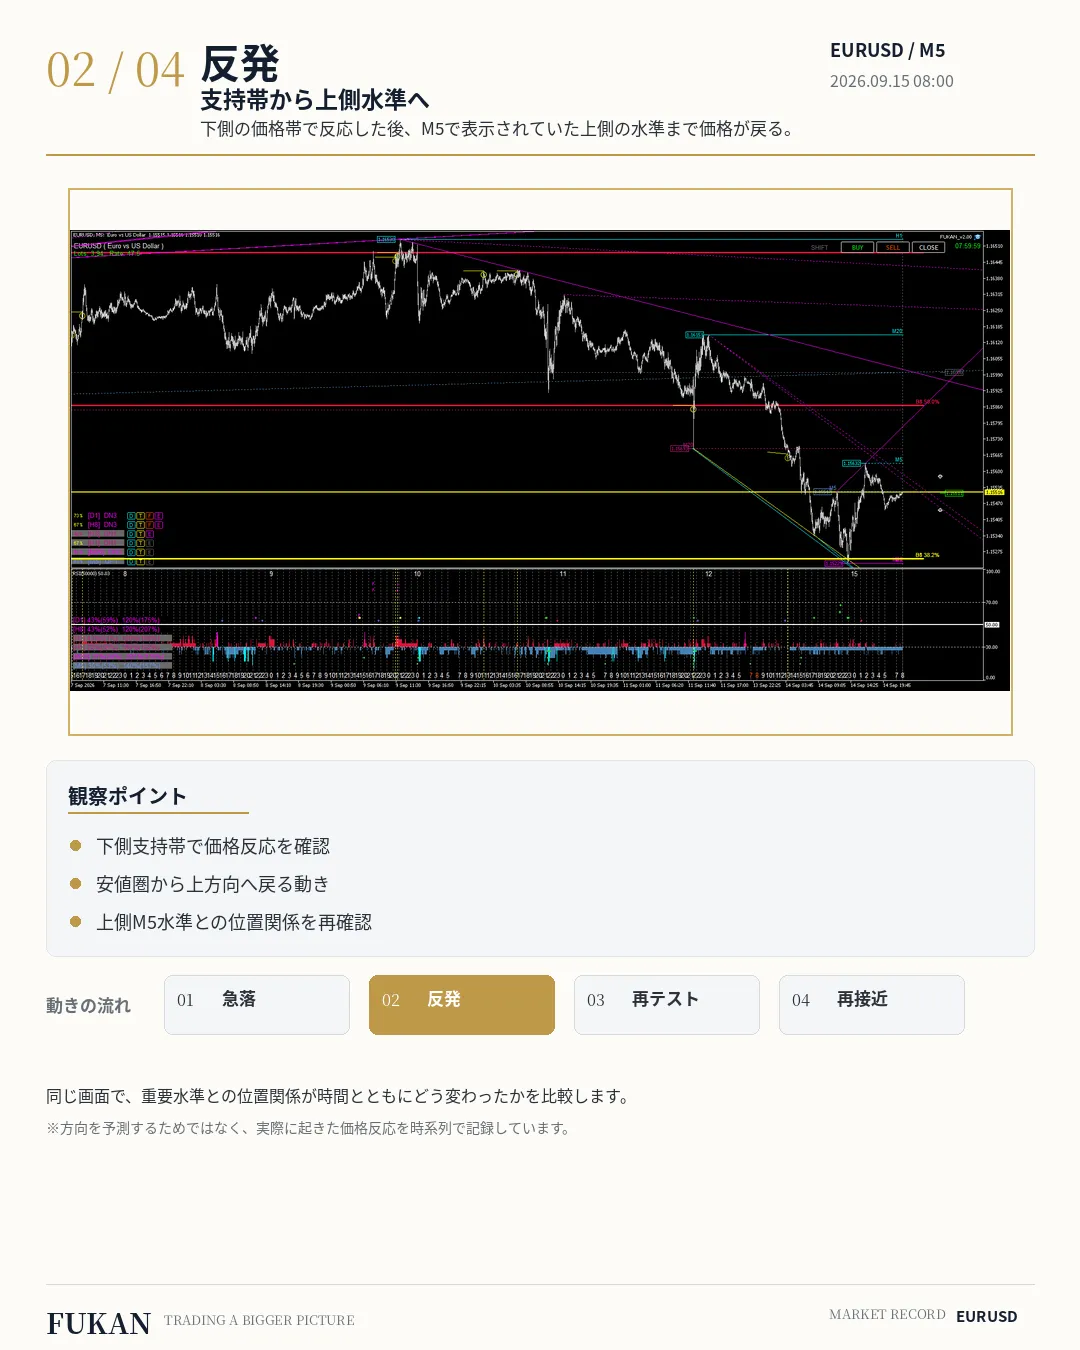
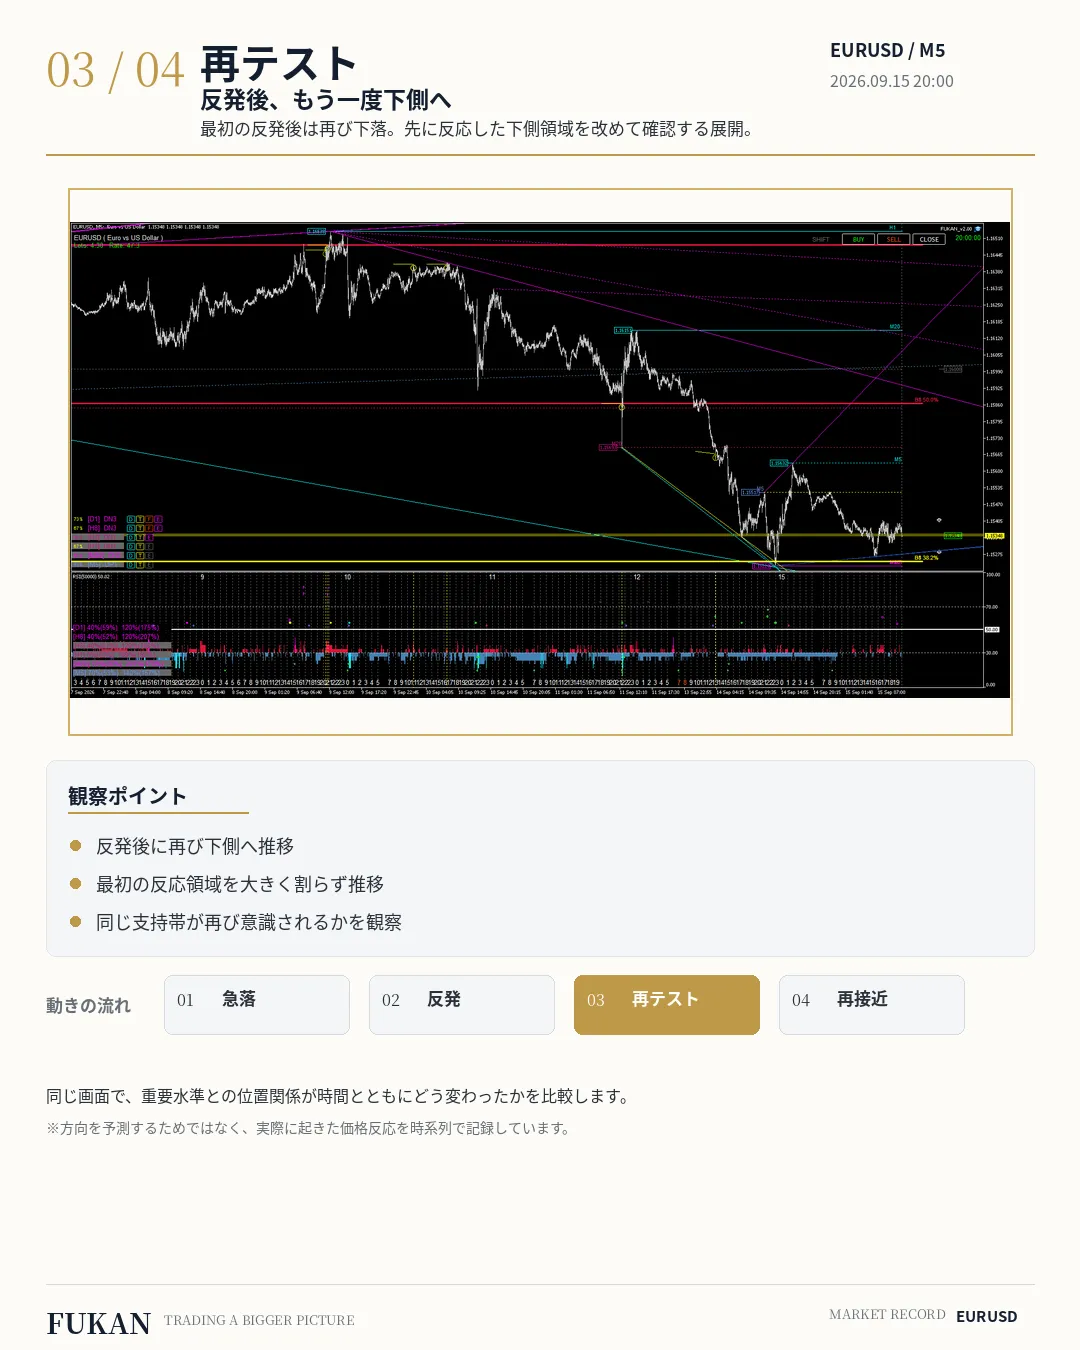
3. Retest - after rebound, moves downward again
However, the rise did not continue unchanged.
After the rebound, price moved downward again. It moves in a way that tests the same support zone again without breaking the initially reacted region dramatically.
Judging only by the initial reaction is not enough; observing how the same region is treated afterward is also important in FUKAN observation.
4. Re-approach - price reacts again at the previous M5 level
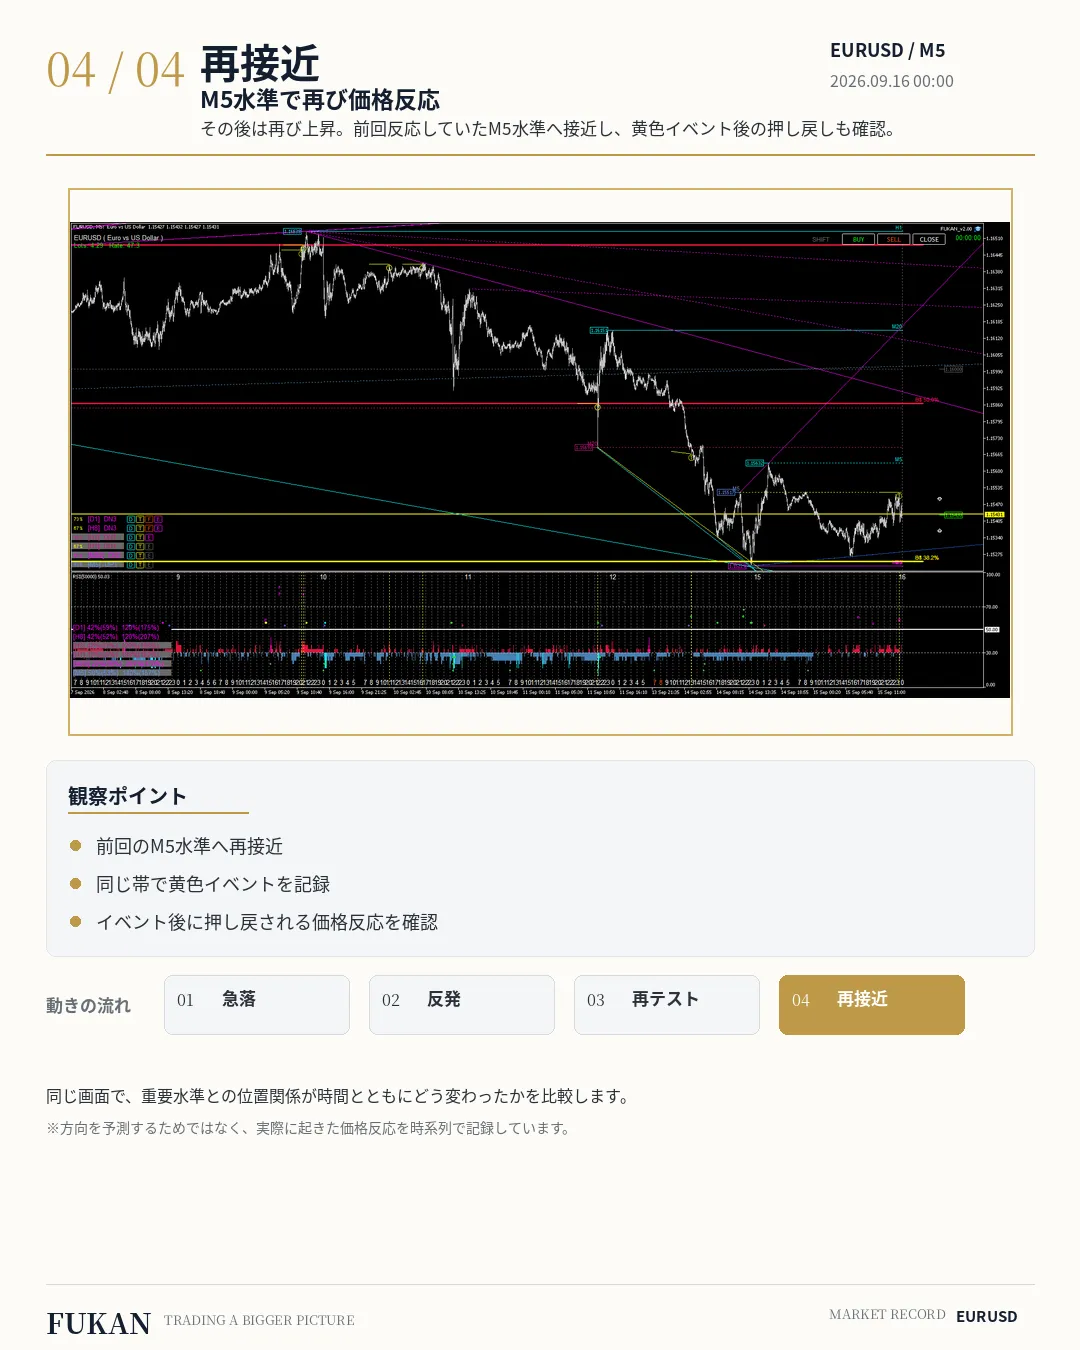
Recently, price rose once more and approached the previously reacted M5 level again.
In the same zone, a yellow event was recorded, and a price reaction pushing back can also be observed afterward.
What we want to see here is not a simplistic interpretation like “sell because a yellow event occurred.” We verify the relationship to important levels, the price flow to reach them, and the actual reaction after the event together.
Check the chronology in the video
This flow is summarized in about a 3-minute video on YouTube’s FUKAN Market Record. You can verify the sequence from the sharp decline to reaching the support zone, rebound, retest, and approaching the M5 level again in the same order.
What FUKAN looks at
FUKAN is not a screen to definitively predict the future.
It is a MT5 environment to organize and observe market structure across multiple timeframes, key levels, and price reactions, and how these change over time, all on one screen.
- Where the sharp decline reached
- How much it retraced from there
- Whether it again confirmed the lower side
- What happened when it returned to the previous M5 level
By tracing these causal relationships, you can understand market flow that is hard to grasp from a single chart image.
Summary
In this EURUSD, after reaching the lower support zone and rebound was confirmed, a subsequent retest led to the price approaching the previous M5 level again.
Even the same level can have different implications during the initial approach, after the rebound, and after the retest.
In the future as well, FUKAN will record actual market activity as is, including both cases where the level was breached and where it did not react, rather than only focusing on reactive examples.
It does not guarantee future price movements, profits, or win rates.