

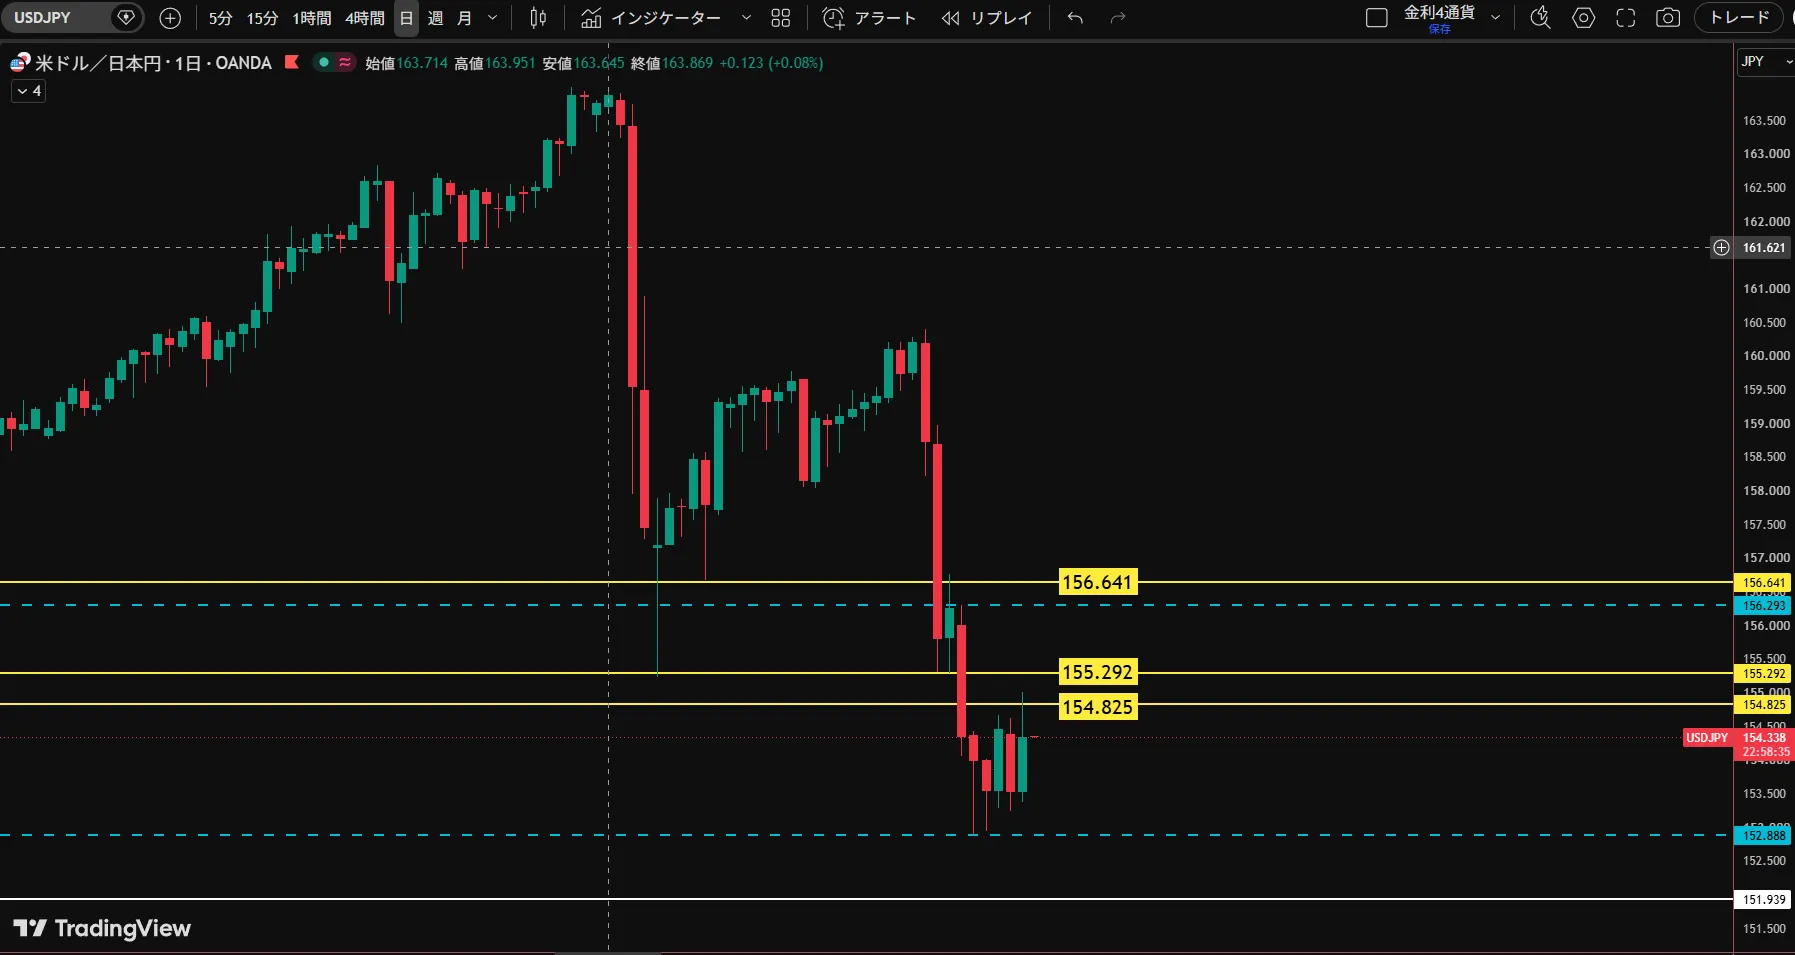
9/15 From the dollar-yen retracement level ①, it is in a decline.
I also posted in the Investment Navigator on 9/13, but the USD/JPY has moved down from around 155.00 with a long upper wick, starting from the line drawn at 154.825.
The manner of the decline shows a long bearish candle, and it seems many who were looking to sell at this point did so.
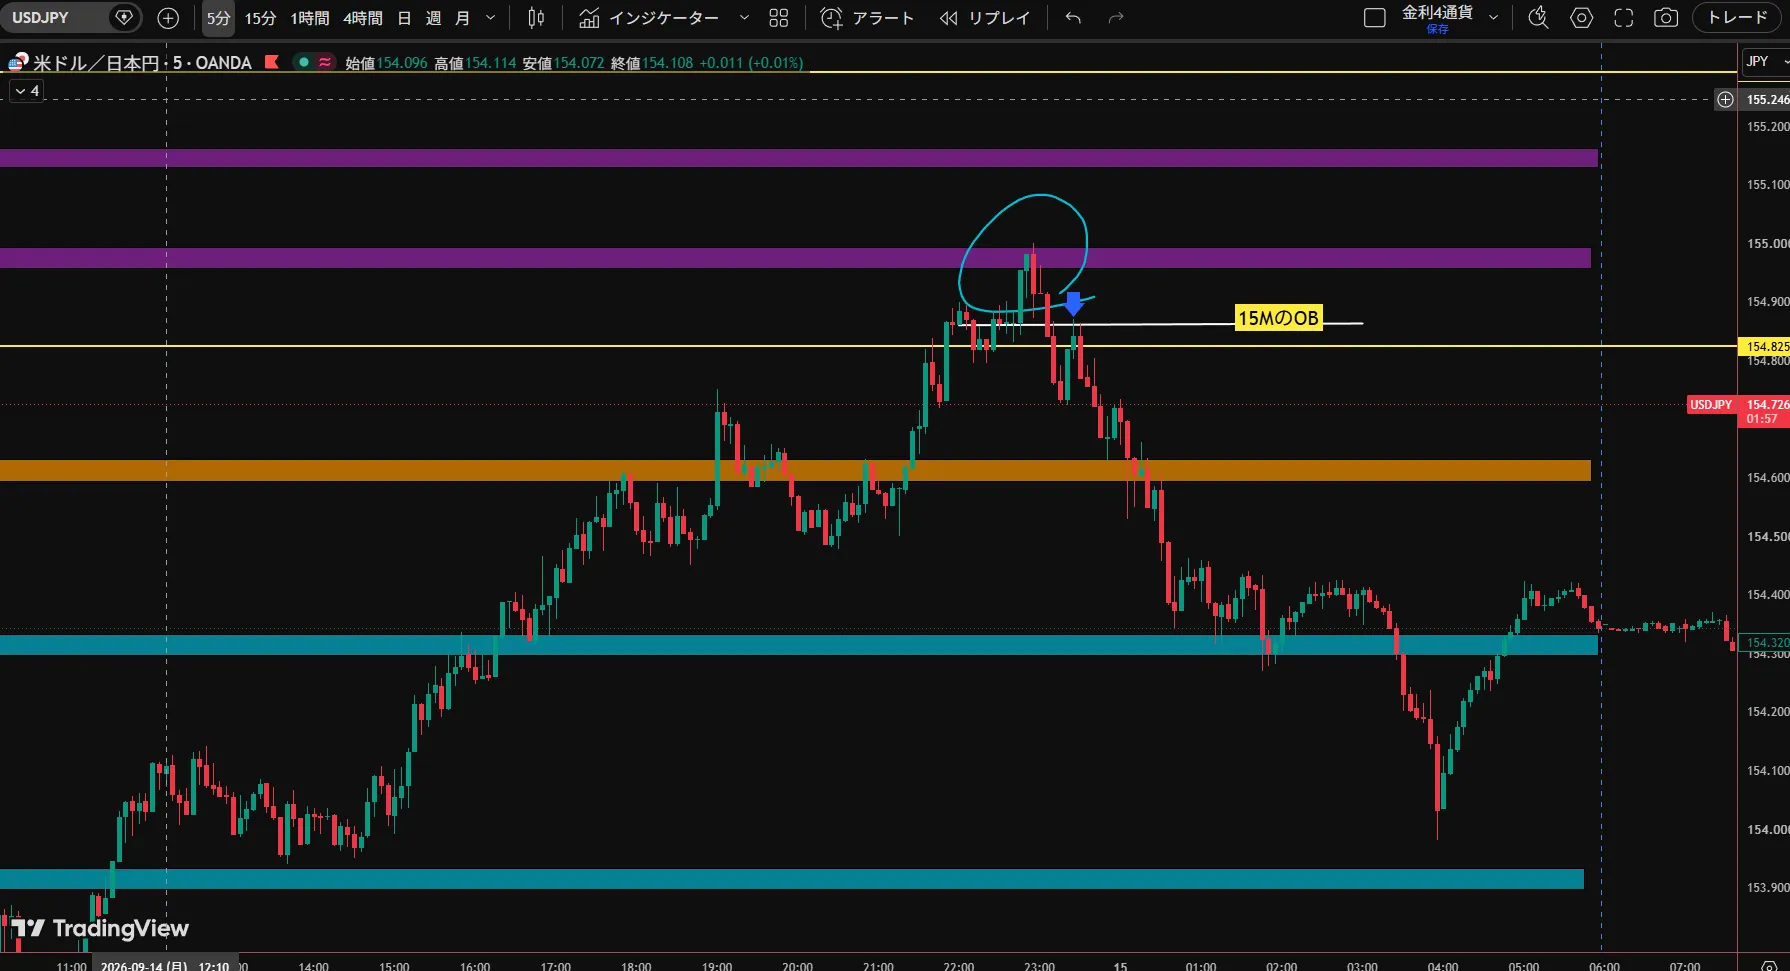
The actual entry will be confirmed at the point where the 15M situation and the 5-minute chart zone align.
It stops perfectly in the zone, then takes a downward move after forming a pattern like an H&S.
At that moment, the OB on the 15M appears, and I enter short on the retracement of the 5M.
After this, it falls by about 100 pips.
In this way, from long-term chart analysis to lower-timeframe entry logic, you learn through a continuous flow.
After this, will it rise again and then fall, or will it continue to decline as it is,
since the Bank of Japan's policy rate announcement is on Friday, it may remain difficult to buy until then.
---------------------------------------------------------------------
https://www.gogojungle.co.jp/info/23491?via=notification
---------------------------------------------------------------------
https://www.gogojungle.co.jp/tools/rooms/76300
【Koyaji-style Zone Trade Method × SMC Practice Course Video Explanations Only (No Mentoring)】
https://www.gogojungle.co.jp/tools/ebooks/76574
【Professional Trader Training 100-Training Series 3-Month Mentoring Course】
https://www.gogojungle.co.jp/tools/rooms/74700
-----------------------------------------------------------------