

Nikkei 225 Futures Simple Trade September 14, 2026 (Monday) Review (Chart Commentary)
Good morning!
Let's go over the results of yesterday's trade.
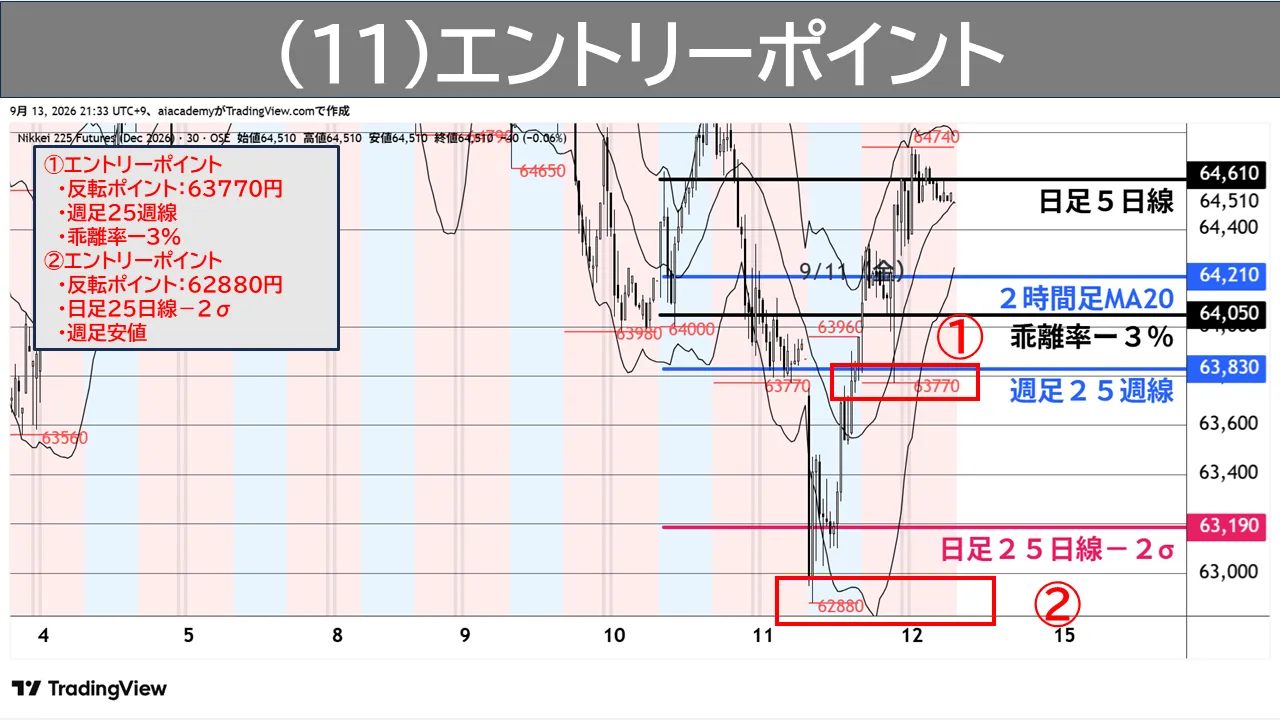
The chart below shows the entry point that was distributed on the morning of September 14.
For those who viewed the distribution, what points did you focus on when watching the market?
On this day, the key points for interpreting the market were as follows. The same as the previous day.
① There is a deviation rate of -3% below, the weekly 25-week line, and the daily 25-day line at -2σ.
② If a reversal to the upside occurs, pay attention to the MA20 on the 2-hour chart or the 5-day line on the daily chart above.
Entry was considered by combining this reversal point, and by judging the candlestick setup.
In the chart below, we will step by step review how each price action and actual movement unfolded.
This day started with a large decline.
If you are a member, you probably know ...
Chart analysis item ① occurred.
Here, the candlestick setup also lined up nicely, so it was fairly straightforward.
As for chart analysis item ②, I will explain it with another chart.
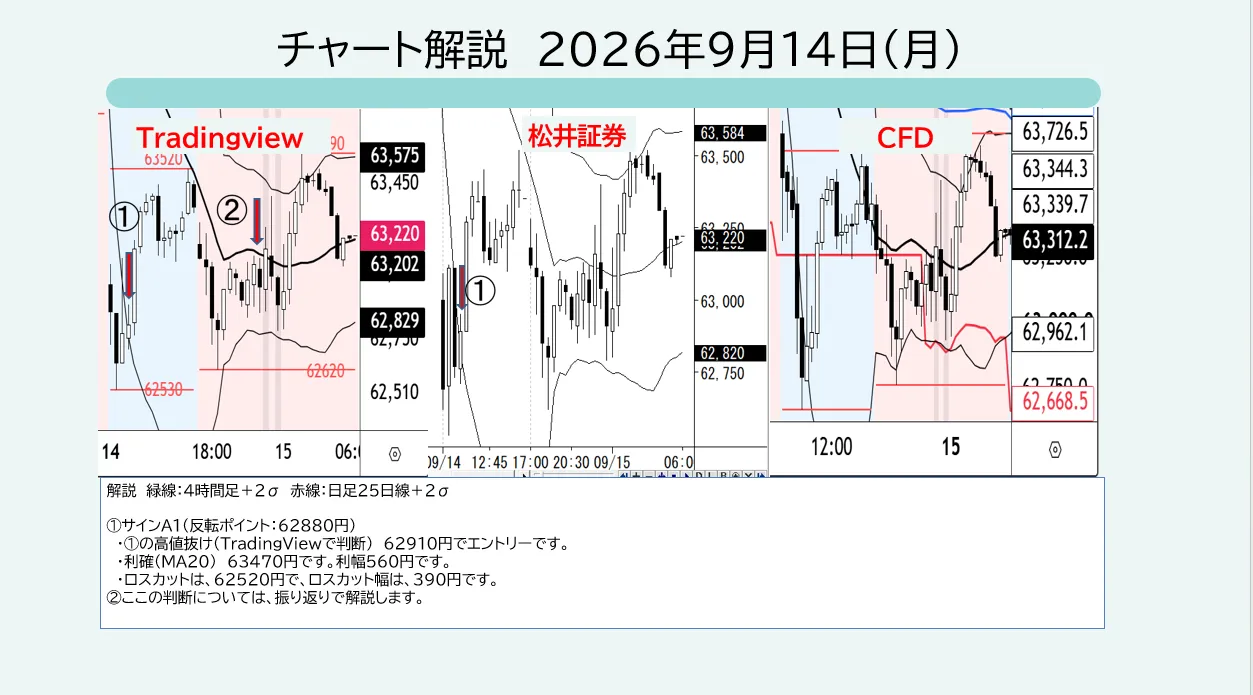
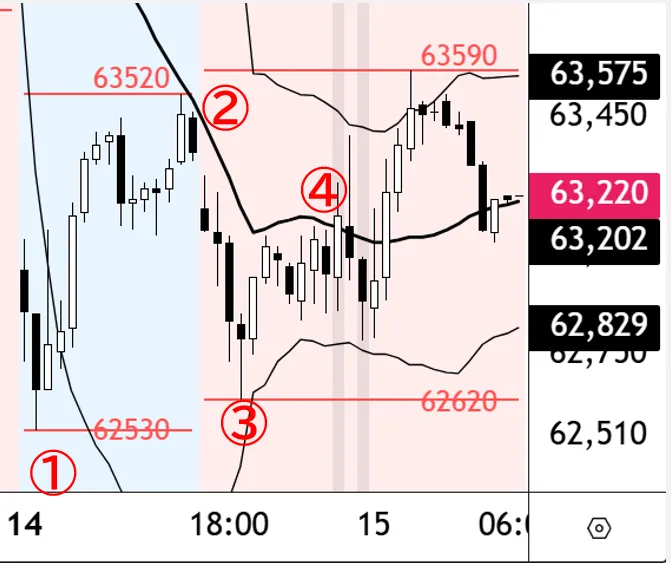
In chart ① above, signal A1 occurred.
Next, near item ②, we wait for a signal B1 from below, but the 30-minute MA20 slope is steep, so signal B1 did not illuminate.
Therefore, the next development is to wait near item ③ for the occurrence of signal A1. However, in reality there was no deep pullback at ③, and signal A1 did not occur.
In this situation, since the B1 from below remains active, the entry is set near the high around ② (63,520 yen).
Looking at the price movement around item ④ afterward, since it did not break above 63,520 yen, the entry was postponed (skipped).
This time, the trading rules did not align neatly, but such patterns occasionally occur in the market.
Please continue to take care of me today as well.