
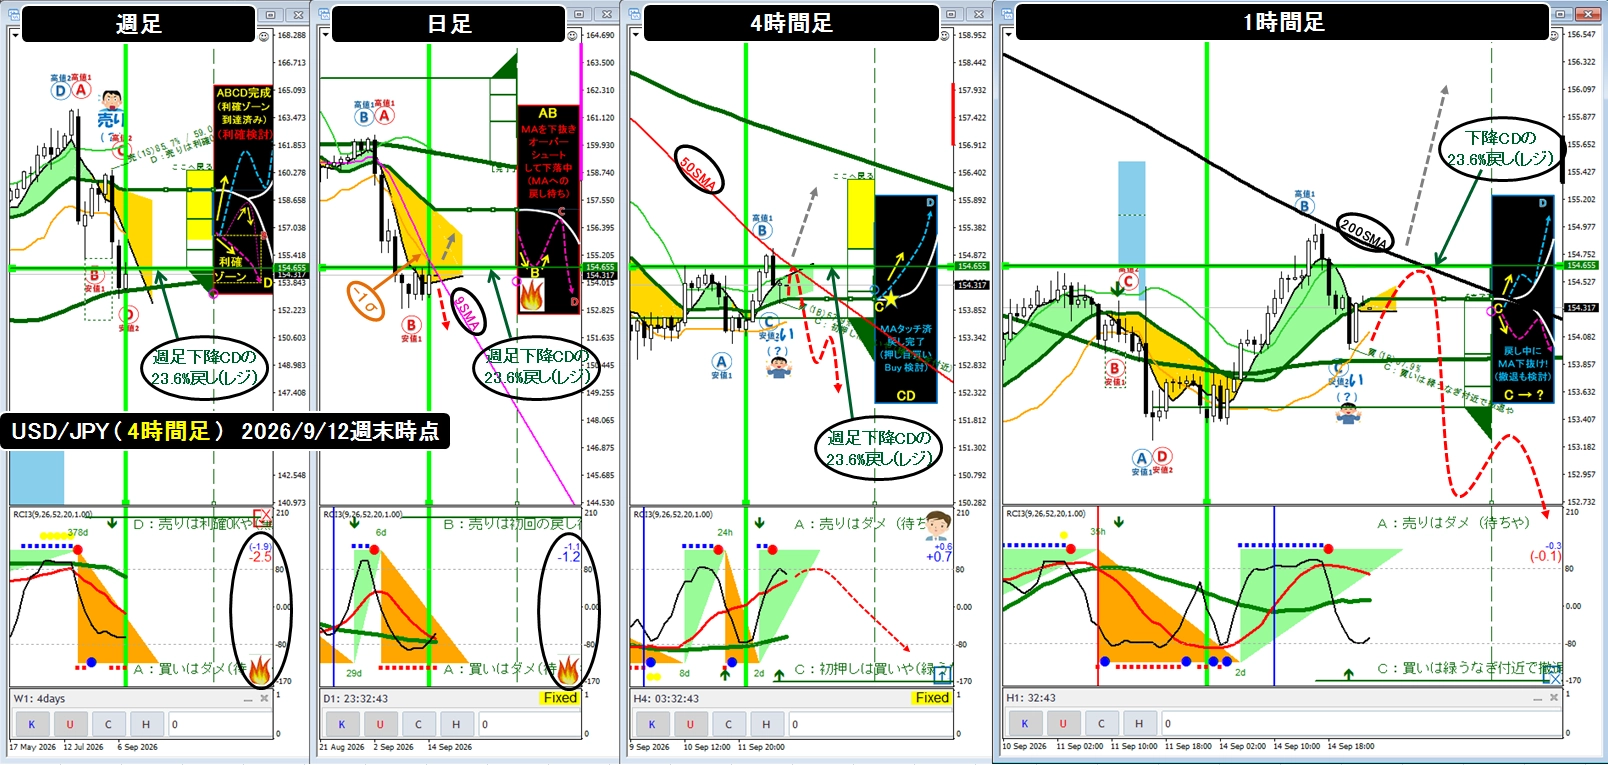
9/15 (Tue) 6:00 AM USD/JPY (ABCD analysis) Today focusing on the daily downband walk (-1σ → -2σ)
In this article,9/12 Weekend USDJPY ABCD Analysisexplains the subsequent situation as of 9/15 6:00 AM.
Major Points
●4-hour chart has shown a return flow that cleared the yesterday's 5SMA, 13SMA, and 20SMA in one step.
●This morning (9/15 6:00 AM), daily -1σ (~ -1.2σ) and weekly decline CD 23.6% retracement resistance overlapping line confirmed by the daily candlestick bullish close from below, so for one day up to tomorrow morning (9/16 6:00 AM), watch for a daily downside band walk (falling from a bullish shadow to -1σ → -2σ) direction. On the 4-hour chart it corresponds to a reverse V-shaped reversal around 50SMA, and on the 1-hour chart around 200SMA.
●If it breaks higher, expect a pullback toward daily 20SMA ≈ 4-hour 100SMA (upward), aiming to form a weekly bullish candle by the weekend.
< USDJPY (Weekly/Daily/4-hour/1-hour) 20SMA ABCD Analysis>
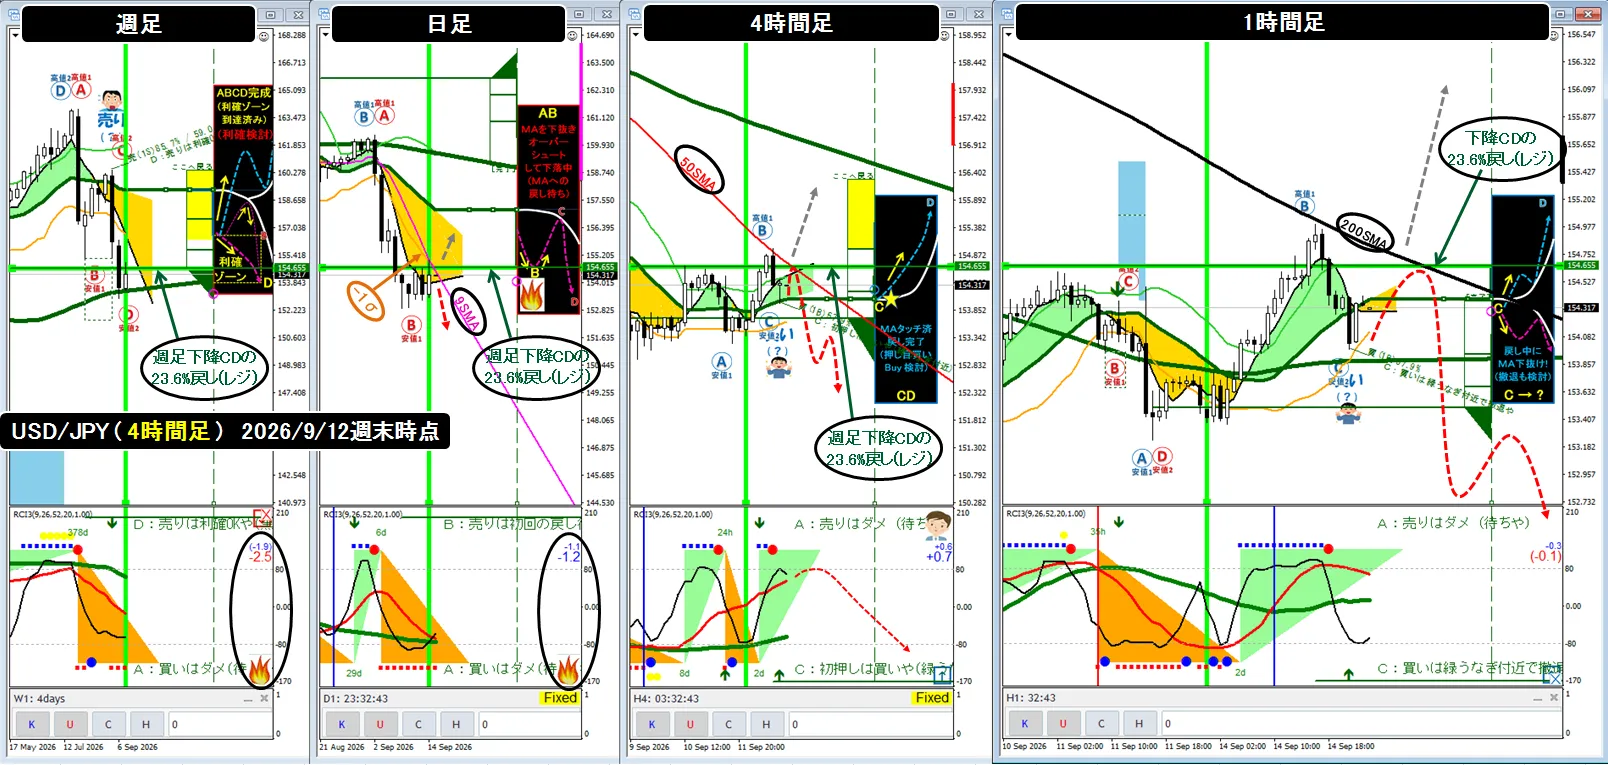
● The chart above is the ABCD analysis focusing on 20SMA at 9/15 6:00 AM across weekly, daily, 4-hour, and 1-hour charts.
This morning, the daily candlestick touched the -1σ (~ -1.2σ) on the upper shadow and closed bullish from below. It is also a bullish candle toward the 23.6% retracement of the weekly CD (154.655). Furthermore, if possible, this weekly candle would like to stay below this 23.6% retracement level at the weekly close to feel secure as price faces resistance.
by tomorrow morning (9/16 6:00 AM), a daily downside band walk (-1σ → -2σ) may form a lower shadow bearish candle and push to new lows.
In the 4-hour chart, around 50SMA is relevant; in the 1-hour chart, around 200SMA is relevant.
Looking at the 4-hour RSI, a black RSI9 forms an N-wave, creating a red RSI26 wave, and again when the red wave rises, it may push the price down after topping out and dropping below the 20SMA vicinity, forming a downtrend. This could lead to a daily bullish shadow turning into a lower low, prompting further downside.
If it breaks higher expect a pullback toward the daily 20SMA ≈ 4-hour 100SMA direction, aligning with the formation of a weekly bullish candle by the weekend..
< USDJPY (4-hour) 20/50/100/200/400SMA ABCD Interconnection Analysis>
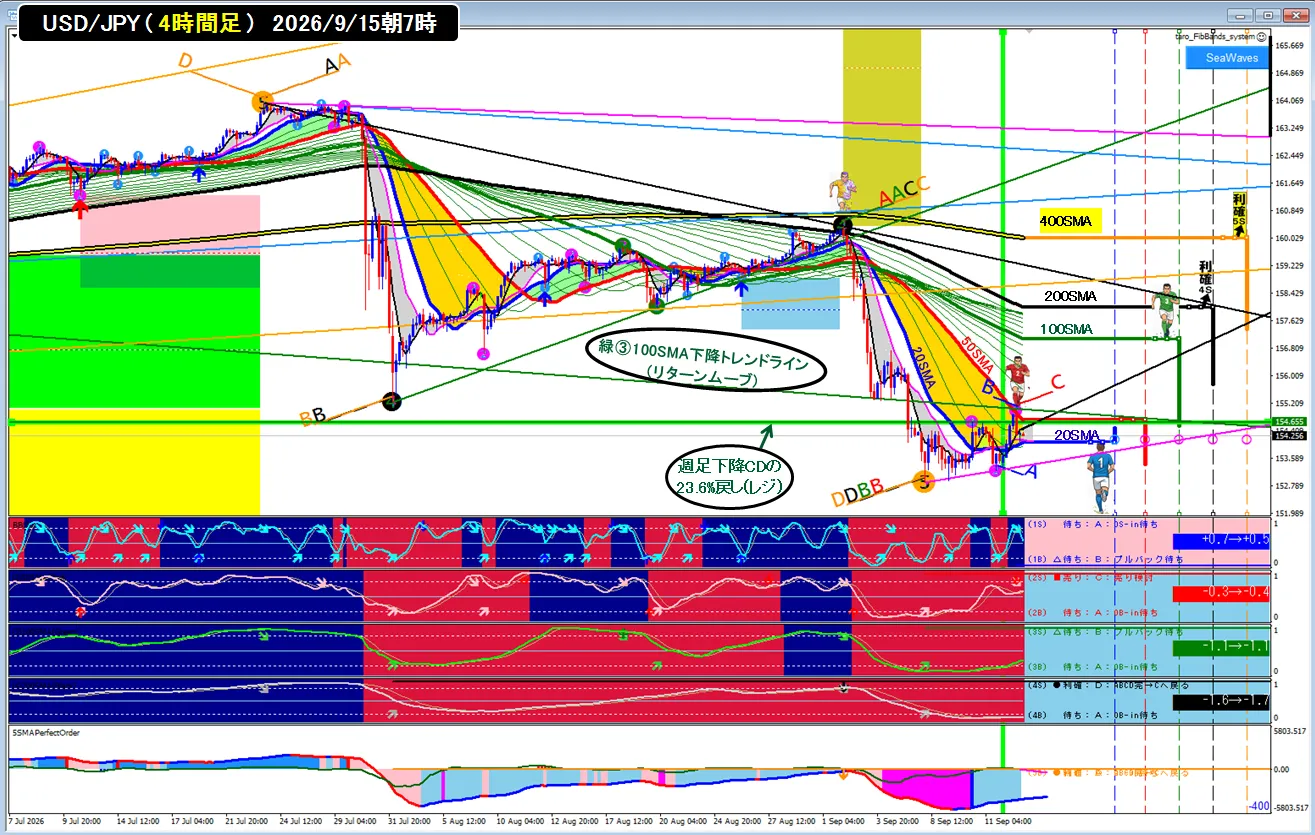
● levels..
●The green vertical line marks the start of the week, and the shape rose toward near the red 50SMA with the red wave labeled as② N-wave, but it can also be read as forming the red wave② by the light blue wave①.
●What happens next is unclear, a rise via blue wave① again could lead to a high near the red 50SMA and weekly CD 23.6% retracement resistance, and then a break below the nearest lows of 5/13/20 by forming a downward trend, risking a move toward lower lows.
●If it breaks higher a pullback toward green 100SMA is expected.
● What is concerning the possibility that after breaking the long-guarded green ③ 100SMA downtrend line (return move), a support-turned-resistance scenario may occur. It is a distant line, so take with caution...
● At present, not too important, but considering the yellow ⑤ rising → falling trend reversal, it would be necessary to form a yellow ⑤ downward trend under the rising trendline; however, if forming the upward move of yellow ⑤ now risks breaking higher, so I would first like to see a break below with red ② or green ③ waves, then proceed. I would first like to see a break below with red ② or green ③ waves, then proceed.
Final
Today only (until 9/16 6:00 AM) Also watch for a reverse V-shape bounce around 4-hour 50SMA or 1-hour 200SMA.
● There will be a FOMC rate announcement and press conference at 27:00 tonight, so until then, will it adjust time (daily and sub-minute bars added)? Or will it break higher?