
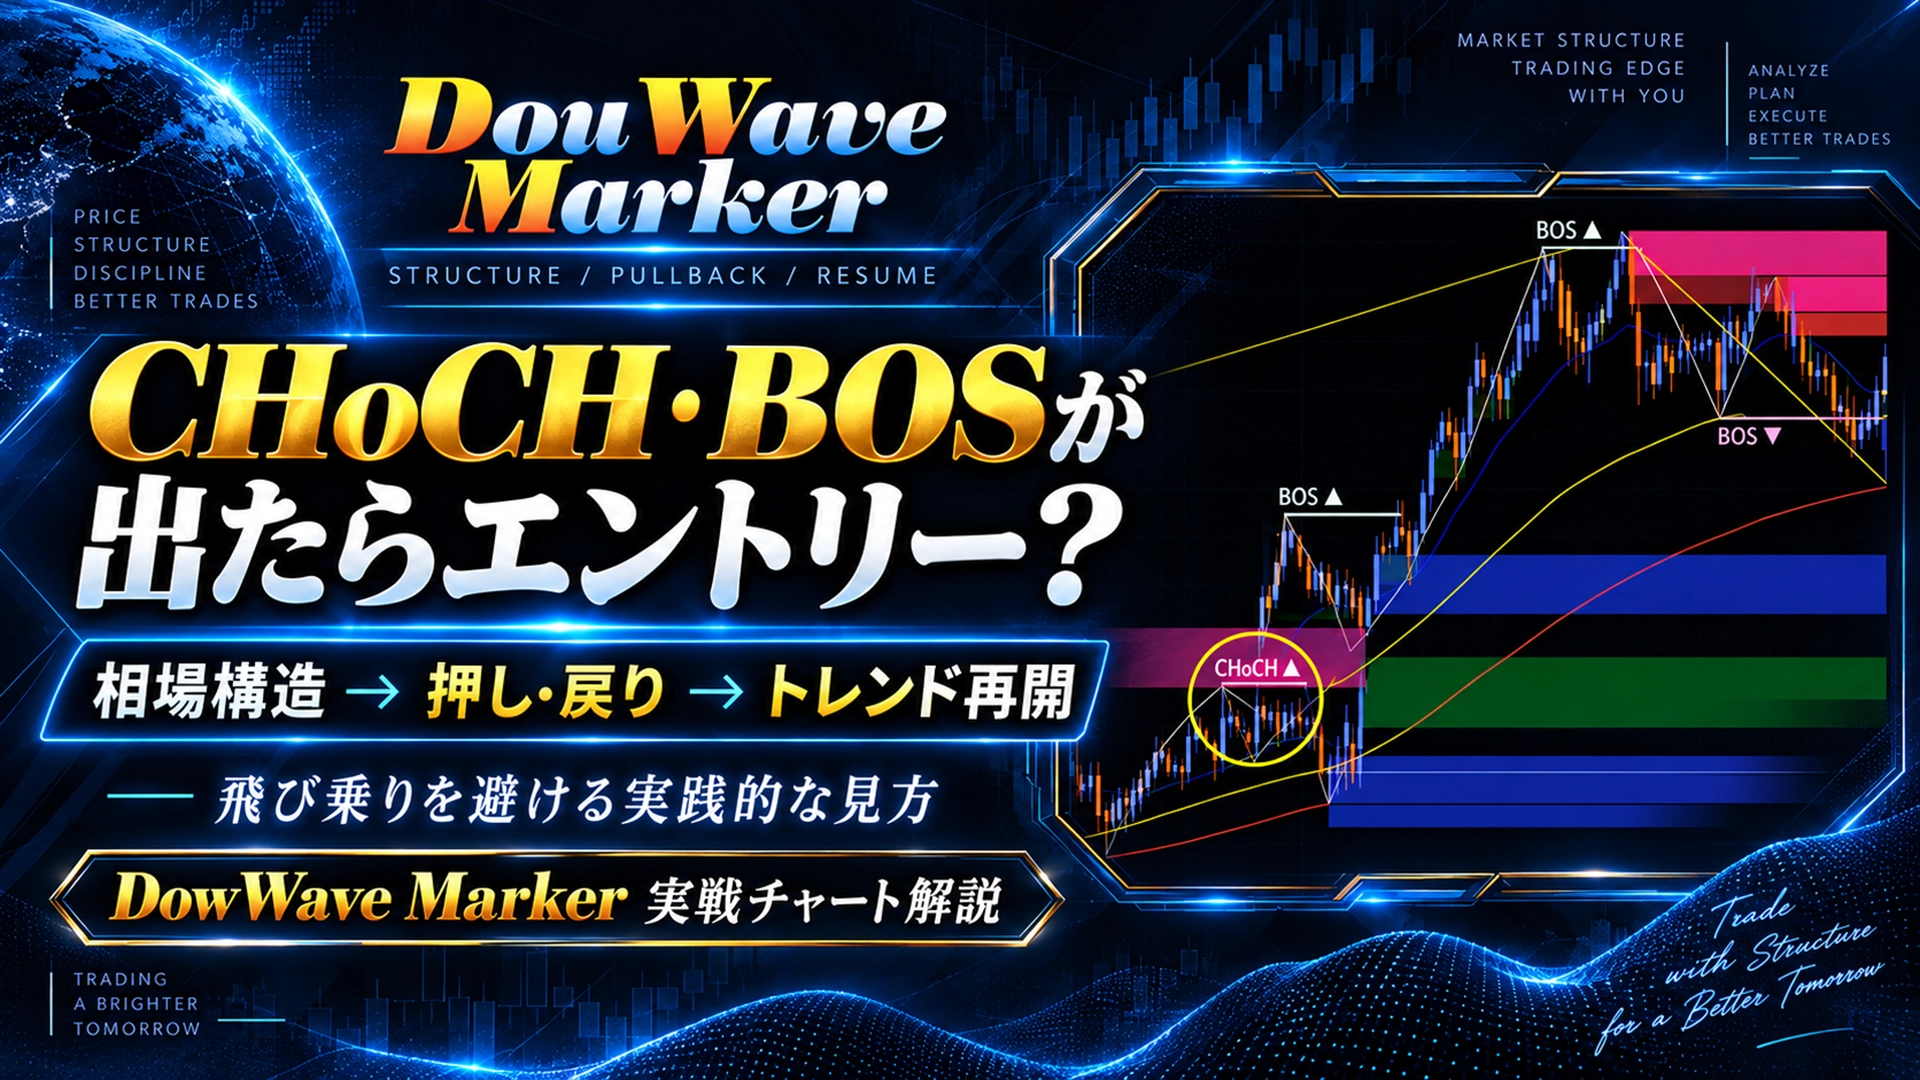
【DWM Real-World Chart】Reasons not to jump on even if CHoCH and BOS appear — continue to push and return to resume

When CHoCH or BOS appears on the chart,“The trend has changed” “It may continue to move higher”you may immediately want to enter in that direction.
However, from my experience viewing charts,CHoCHandBOSare often followed by a temporary price pullback right after confirmation.
What I pay particular attention to is
◯ the price zone where CHoCH/BOS appeared
◯ the Order Block beyond that
◯ the support/resistance on higher timeframes
◯ the relationship with long- and medium-term moving averages
.
This time,DowWave Marker(DWM)we will look at actual charts.
■ Even if CHoCH▲ appears, do not buy immediately
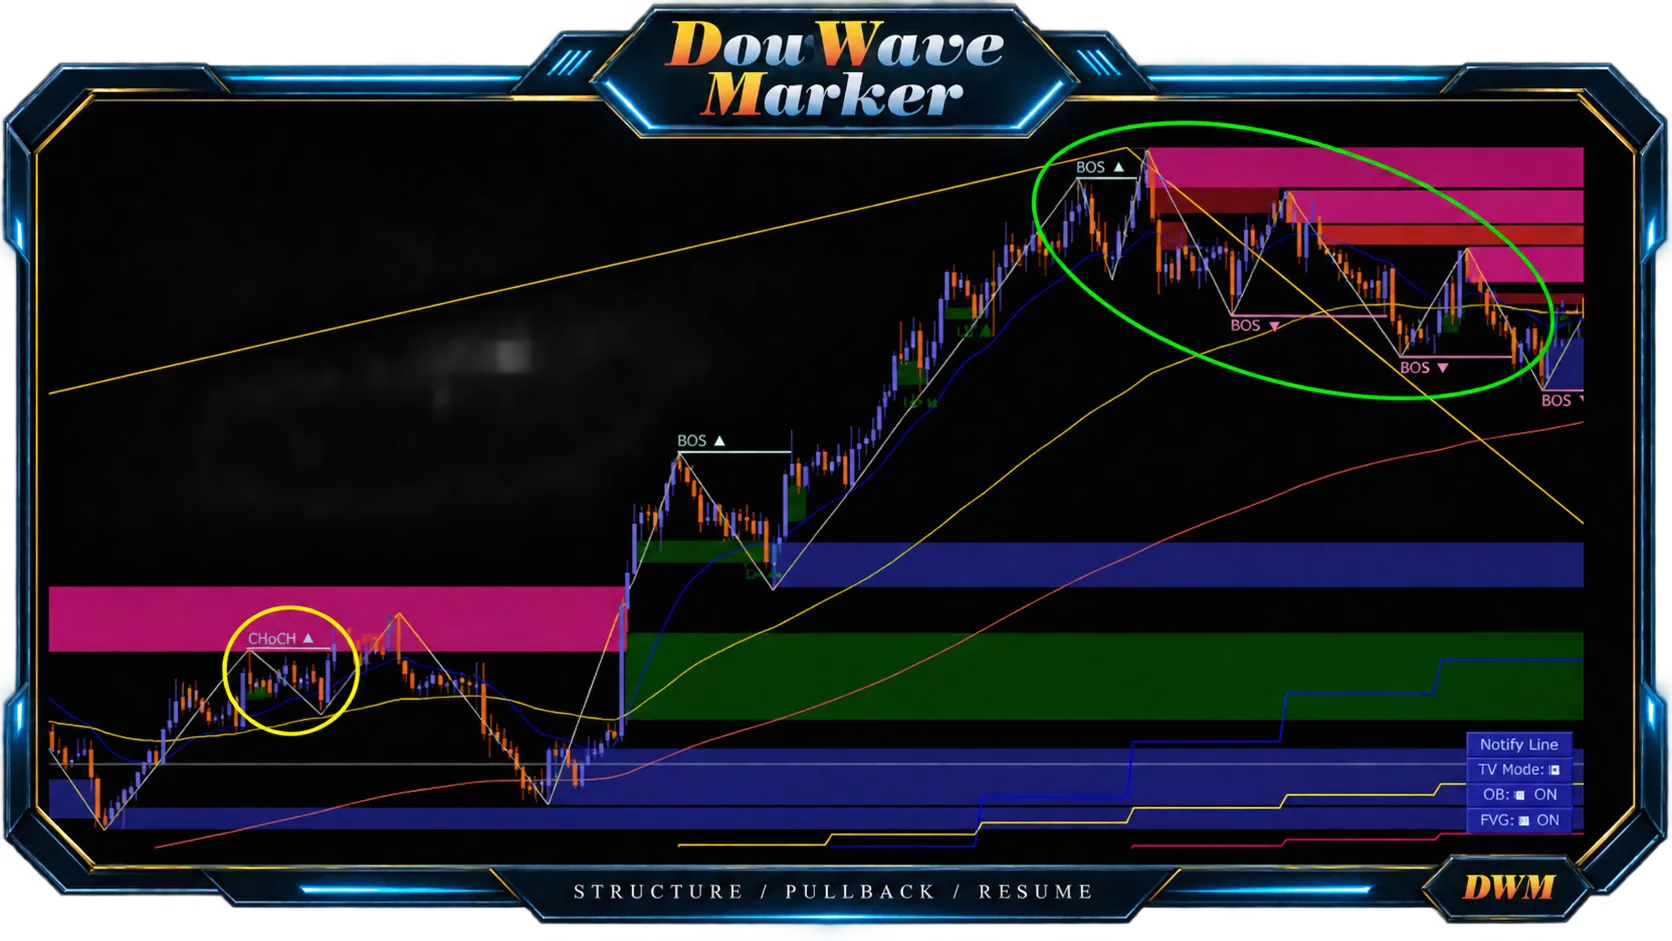
In the yellow circled area, there is a CHoCH▲ appearing for an upward move.CHoCH▲If you only look at CHoCH, you might think,
“the structure has moved upward → I want to consider buying”.
However, directly above there isan Order Block zone.
In reality, price responds to thatOrder Block, and after CHoCH appears, it does not immediately rise; instead it is pulled back significantly once.
In other words
“Even if you’re biasing upward, entering at that spot tends to result in getting caught at a swing high.”
That is what we can understand.
■ After being pulled back, the area above accumulates supporting elements
Afterward, price moves downward.
However, at the point where it is pulled back to, there are
◯ long-term MA of the execution leg
◯ Order Block that can serve as support
that converge in price.
Here, unlike before, there are elements that could support a decline stacking up.
In fact, price reverses around here, and subsequently rises withBOS▲.
This sequence can be seen as
◯ market structure
↓
◯ pullback
↓
◯ trend resumes
.
I do not viewCHoCHandBOSas“signs to enter as soon as they appear”.
■ While the execution leg shows an upmove, there is resistance on higher timeframes
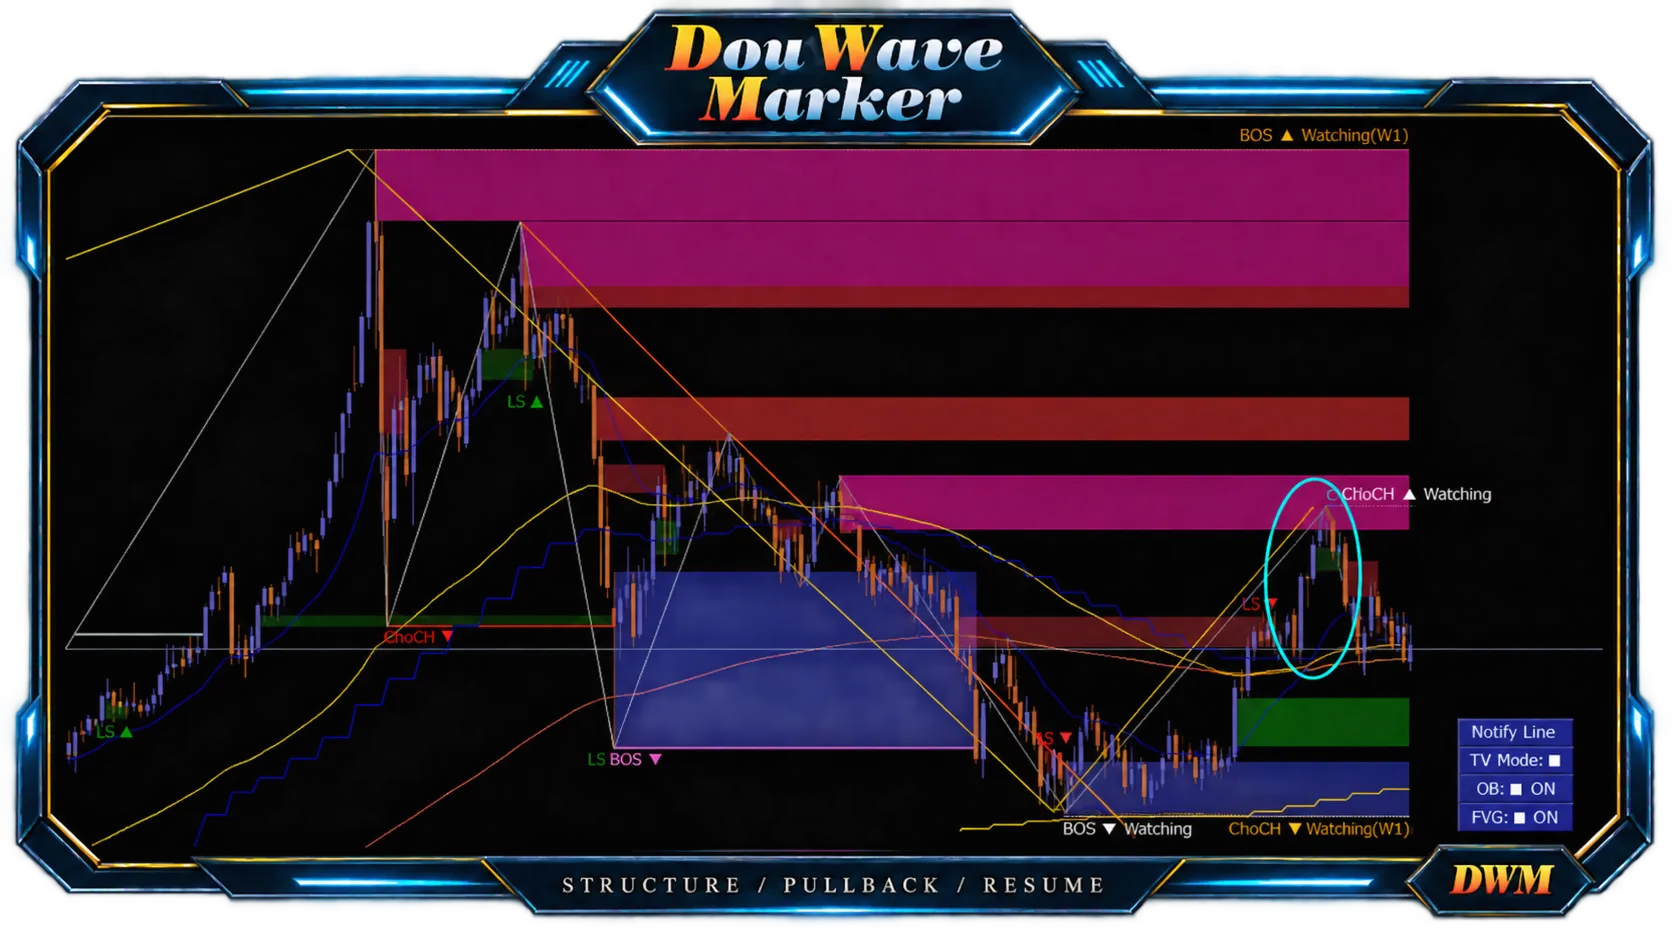
Next, on the higher timeframe, there is a blue-circled area withan Order Block zone.
On the execution leg,BOS▲is accompanied by an upward move, so it feeling like“it could still move up”.
However, on the higher timeframe, price has reached a major resistance zone.
In fact, near thisOrder Block, upward momentum is curbed, and the subsequent change is a downward structural shift.
In other words
even if the execution leg appears to be in a bullish continuation, on higher timeframes entering near a resistance zone can be a jump into the market at the wrong place
.
■ CHoCH/BOS are about “where” rather than “whether it appeared”
In this chart, what I want to focus on is not CHoCH or, BOSitself.
What matters is
◯ at which price range they appeared
◯ whether there is a resistance or support zone beyond them
◯ whether a pullback occurs
◯ whether price reacts at the pullback level
◯ whether it then moves in a favorable direction again
.
“CHoCH/BOS guide the direction”
“Entry location is determined by its relationship to the price range”
.
■ Key thinking when using DowWave Marker
DowWave Marker(DWM)is not merely an indicator that shows CHoCH or BOS and stops there.
With DowWave Marker(DWM)you can
◯ CHoCH / BOS
◯ execution leg and higher timeframe market structures
◯ moving averages
◯ Order Block
◯ FVG(Fair Value Gap)
◯ CRT(Candle Range Theory)
◯ CET(Original signal)
and so on, to organize what stage the current market is in..
Currently, in CET, we place emphasis on the flow of“market structure → pullback → trend resumes”.
“Enter because a sign appeared”is not the mindset here, but rather
◯ whether we are at the stage to confirm a reversal
◯ whether we are at the stage to wait for a pullback
◯ whether we are at the stage where price has begun to move again
to organize our thinking.
■ Summary
CHoCH andBOS are very useful for understanding market structure.
However,“Enter immediately after CHoCH appears” or “Chase after BOS”can lead toswinging high or low.
In this chart as well,
◯ CHoCH/BOS
◯ reacts at the Order Block
◯ pullback
◯ reversal with long-term MA + Order Block
◯ trend resumes with BOS
◯ price reacts again at higher timeframe Order Block
and this flow was confirmed.
CHoCH・BOS when viewing, it is important not only to mark them but also to observe“where they appeared, and how it moved afterward.”.
■ You can try DowWave Marker free for 14 days
DowWave Marker(DWM)allows you to review not onlyCHoCH・BOSbut alsoOrder Block・FVG・CRT・CET, and execution leg・higher timeframe structureson the chart.
Currently, we offer a14-day free trialto try all features of DWM.
Please try the flow of market structure → pullback → trend resumes on your own chart. .
▼ Free trial product page is here
※Clicking the banner will take you to the free trial product page.