
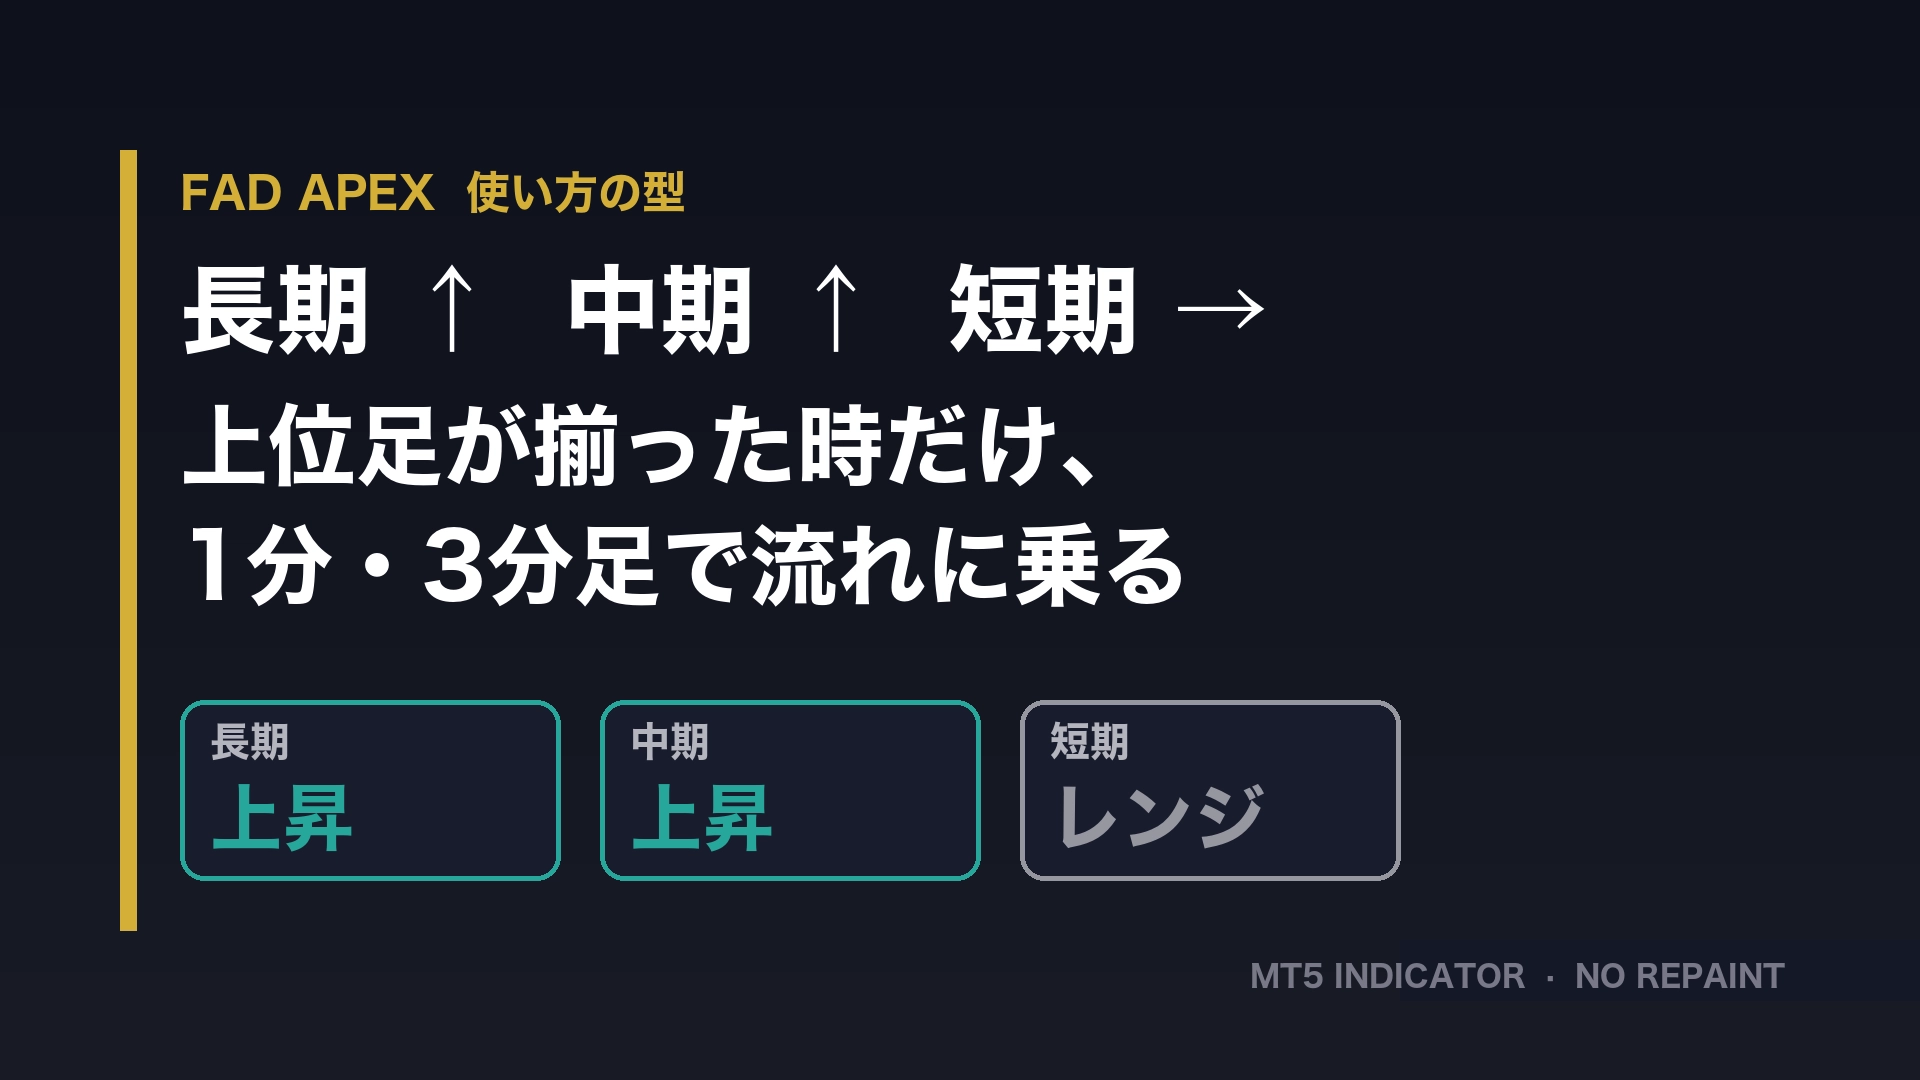
【FAD APEX】Only when long-term↑, mid-term↑, short-term→ align, ride the trend on 1-minute and 3-minute charts. The entry type when the three layers align (common for both buy and sell)
“Only ride the trend on the lower time frame when the higher time frame is pointing in the same direction”。In the FAD APEX user community, I will write about the model that currently feels the most reproducible, including logic, conditions, steps, real-world examples, things not to do, and a checklist. The goal is that, after reading this, you can test it on tomorrow’s chart as-is.
|
What you will understand from this article ・When long-term ↑, mid-term ↑, short-term →, take only the “upward direction signals” on 1-minute and 3-minute charts (selling is the mirror) ・Why this situation tends to extend (structure that captures the range of the higher time frame with small stop-loss on the lower time frame) ・Condition table, 5 steps, example diagrams, situations not to enter, pre-entry checklist ・The role FAD APEX plays in this model and the flow from introduction to operation |
I’ll state the conclusion first.Long-term = Up, Mid-term = Up, Short-term = Range, thentake only the upward directional (BULL) signals on 1-minute and 3-minute charts. The downward direction (long-term = Down, mid-term = Down, short-term = Range) is the mirror image,take only BEAR. All other cases are ignored.
1. Why the “lower-time frame when the three layers align”?
There are patterns in which many people lose.It’s when you look only at the lower time frame and enter against the higher time frame. Even if a clean buy signal appears on the 1-minute chart, if the 4-hour chart is in a downtrend, that buy is merely a “brief rebound within a big decline.” Profit is small, and stop-loss is large.
Conversely, when the long-term and mid-term point in the same direction and only the short-term is range-bound (temporary consolidation and price range build-up),this is a situation where price tends to unwind in the direction of the higher time frame after the adjustment finishes. Using signals from the lower time frame here makes the following three conditions hold simultaneously.
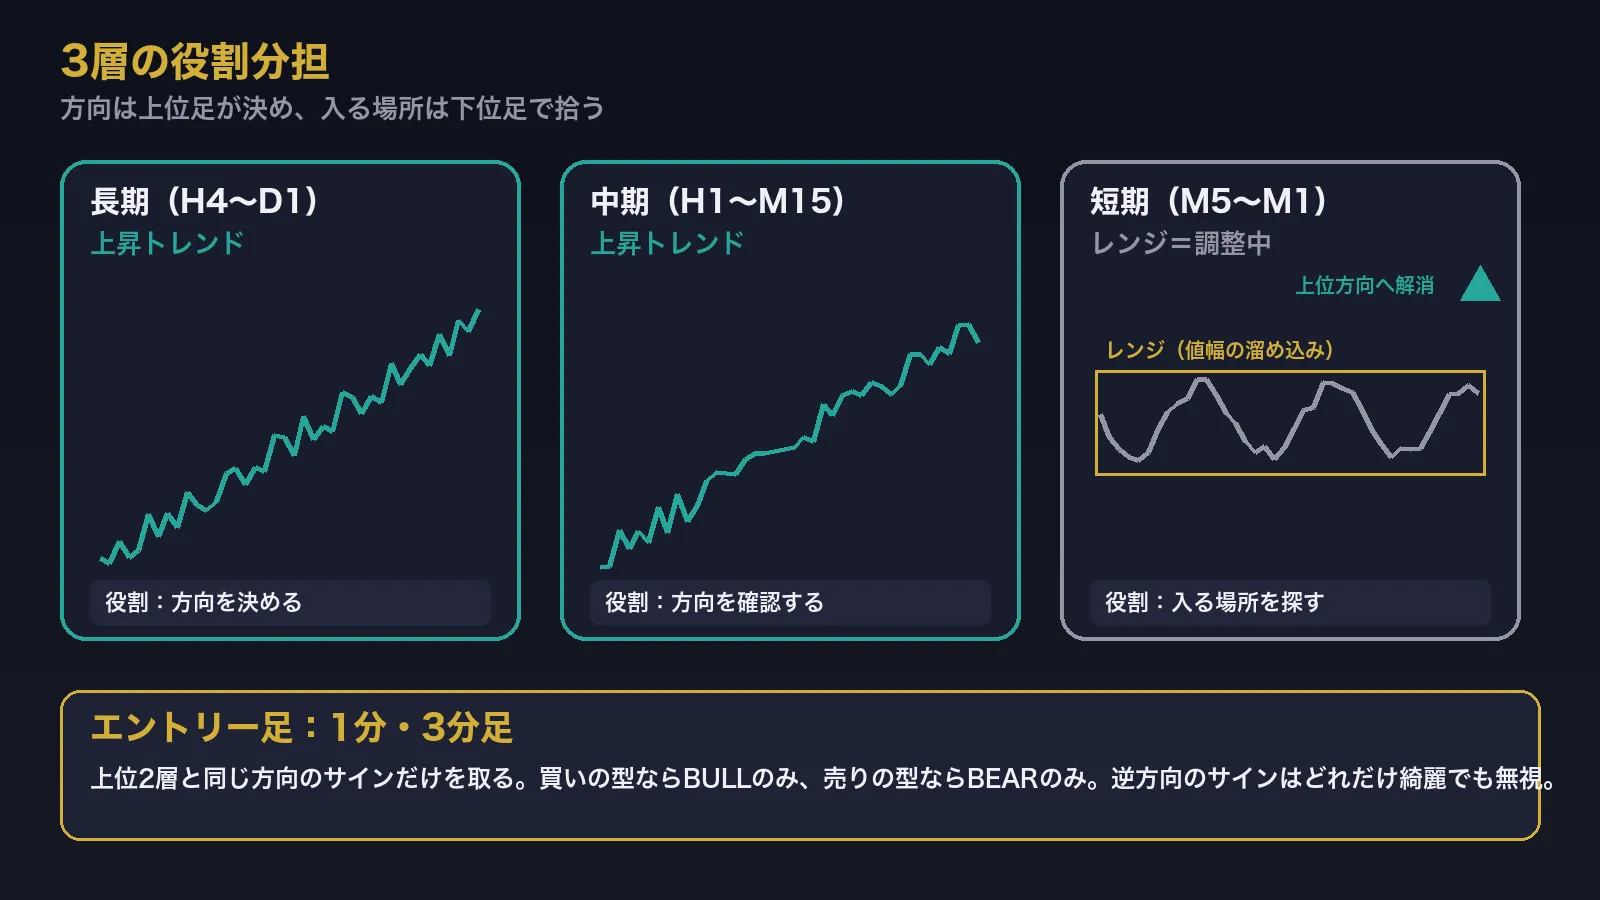
| Direction | Both upper two layers determine it. You don’t have to worry about up or down yourself |
| Timing | Within the short-term range, 1-minute and 3-minute signals pick up the “end of the adjustment” |
| Stop-loss width | Because you enter on the lower time frame, placing SL at the edge of the range results in a smaller width. You can capture the higher-time-frame range with the lower-time-frame stop-loss width |
In other words“Direction is the higher-time-frame, entry is the lower-time-frame”, a model with completely divided roles. Entering on the higher time frame leads to large stops, entering only on the lower time frame risks missing the direction. It eliminates the weaknesses of both approaches.
2. Conditions (only when these three align)
| Layer | Bull (buy) type | Bear (sell) type |
|---|---|---|
| Long-term(H4〜D1) | Up | Down |
| Mid-term(H1〜M15) | ||
| Short-term(M5〜M1) | Range | Range |
| Entry candles | 1-minute and 3-minuteBULLonly | 1-minute and 3-minuteBEARonly |
| Rank | Until you're熟れる(accustomed)S・Aonly (B ignored) | |
The short-term being in a“Range”is the key. When the short-term is moving in the same direction, it has already moved, tending to be a high-level buy at the top or a low-level sell at the bottom. When the short-term moves in the opposite direction, the adjustment is not finished yet.“Upper two layers in the same direction, short-term in Range” is the only scene worth waiting for.
3. Example image (3-minute chart)
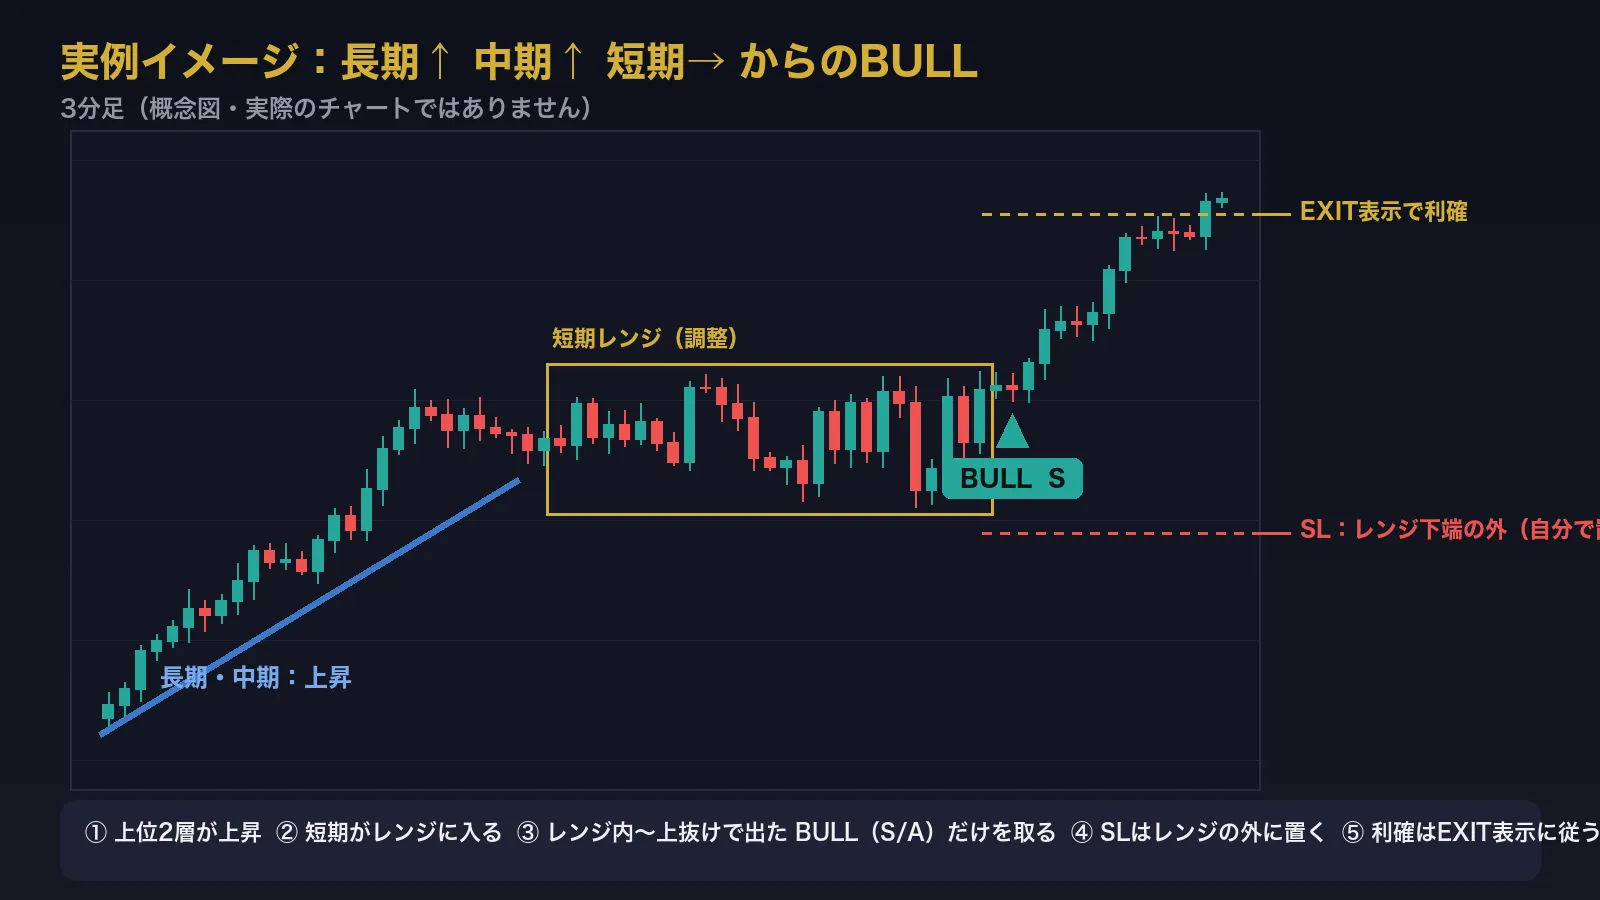
While the upper two layers are rising, the 3-minute chart enters a sideways range. Within this range, or at the moment of a breakout, we take onlyBULL(S/A)signals. Place SL outside the lower end of the range by ourselves. Take profit according toEXIT display (if splitting, take half first). This is one cycle of the flow.
|
Profit/loss structure by numbers (example) If you place SL outside the range lower edge, the stop width becomes “range height + a little.” Meanwhile, the profit target aligns with the direction of the higher time frame, so you often aim for 2–3 times the range height.Risk 1 to reward 2–3, structurally built. ※Ratios vary by scenario. This does not guarantee profit. |
4. Steps (5 steps)
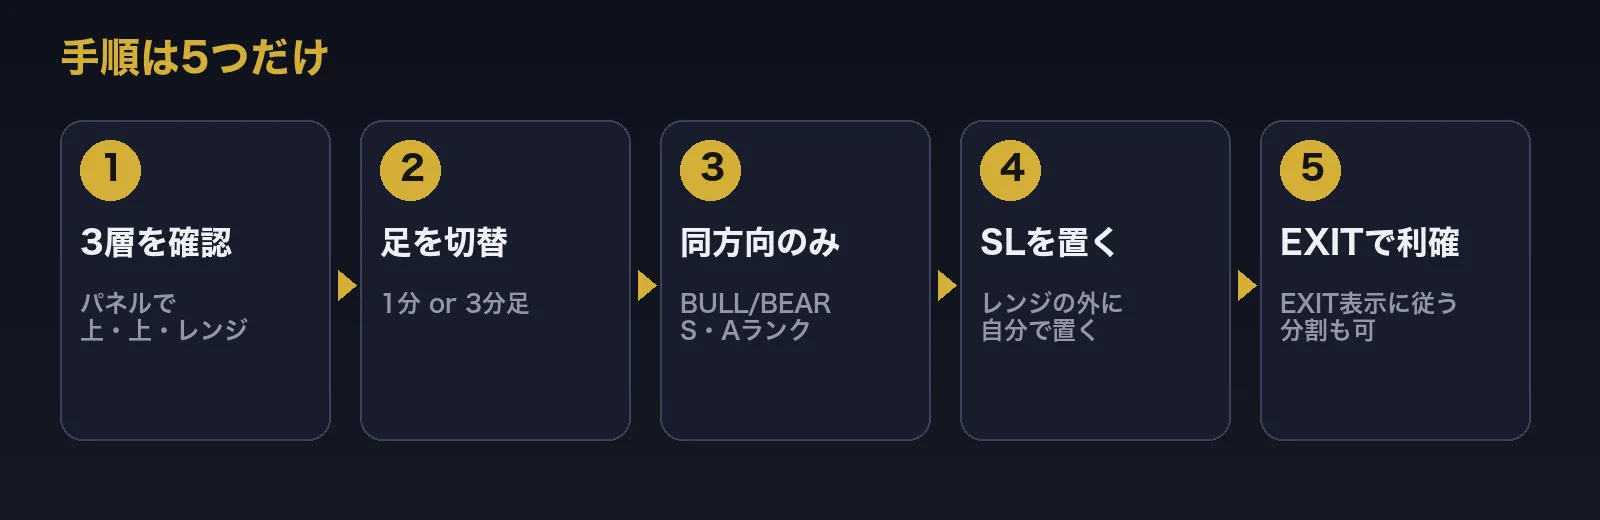
STEP 1|Confirm the directions of Long-term, Mid-term, Short-term
FAD APEX displays on the panel the three-layer directions ofLong-term, Mid-term, Short-termconstantly. There is no need to switch time frames to eyeball. Check the panel to see if it shows “Up-Up-Range” or “Down-Down-Range.” If not aligned, this model has no use that day.
STEP 2|Set the chart to 1-minute or 3-minute
If the three layers align, open a 1-minute or 3-minute chart for entry. Market with fast moves like gold may use 3-minute; currency pairs that are calmer can use 1-minute.Recommendation for beginners: use 3-minute. 1-minute has more signals, so more rejections.
STEP 3|Wait for signals in the same direction as the upper layers
If buying, wait for onlyBULL signals. Ignore BEAR signals. FAD APEX assigns a ranking of S/A/B to signals, so initiallylimit to S and A to simplify decisions. “Waiting” accounts for 80% of this model.
STEP 4|Always place a stop-loss (SL)
Place SL at the far end of the short-term range, or at the recent swing low (for buys). The height of the range guides the stop width, so decide your entry level beforehand.Entries without an SL are not this model.
STEP 5|Take profit according to the EXIT display
Take profit according to FAD APEX’sEXIT display. Since it follows the direction of the higher time frame, the short-term move can contribute to the higher time frame’s range, sotake half at first and let the rest ride to the EXIT display. This is a compatible split strategy.
5. Not entering situations (these keep results stable)
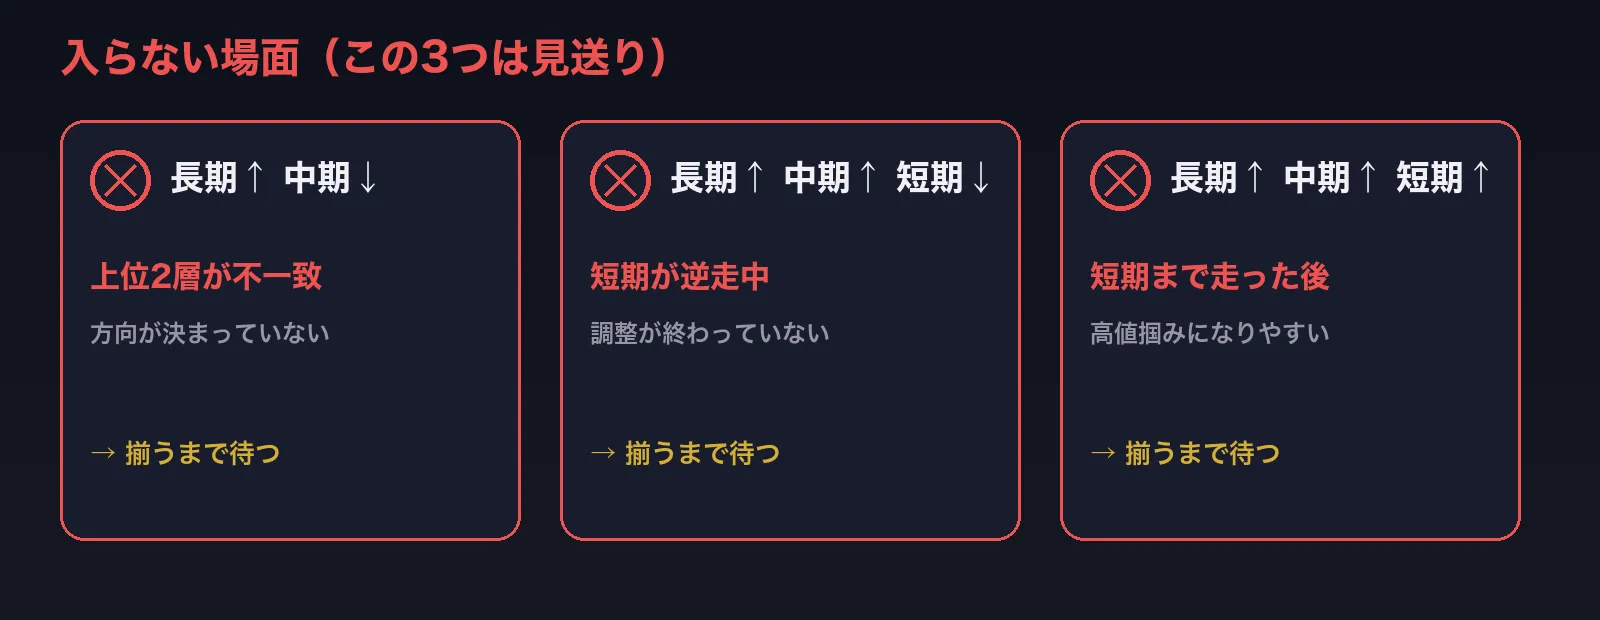
| ✕ | Long-term and Mid-term directions differ. If direction isn’t determined, just skip |
| ✕ | Short-term is moving in the opposite direction of the upper layer. Adjustment not finished. Wait for range |
| ✕ | After short-term already moved in the same direction. Prone to buying high or selling low |
| ✕ | Signals contrary to the upper direction. Even if 1-minute BEAR looks clean, ignore if the upper layer is rising |
| ✕ | Around major news indicators. The three-layer judgment can collapse instantly |
| ✕ | Increase positions with only B-rank. Until accustomed, stick to S/A |
6. Pre-entry checklist (only this on every trade)
| ☐ The panel’s long-term and mid-term arein the same direction. ☐ Short-term isRange. Not moving in the opposite direction, nor already finished ☐ Watching the1-minute or 3-minute ☐ The signal that appeared is in the same direction as the upper layer, and the rank isS or A ☐ TheSL position has been decided (placed outside the range by yourself) ☐ The take-profit handling has been decided (follow the EXIT display / if splitting, take half first) ☐ Immediately after there is noImportant indicator. |
Only enter when all seven boxes are checked. If even one is missing, skip. The less discretionary room there is, the more stable this model becomes.
7. The role FAD APEX plays in this model
This model itself can be reproduced theoretically without FAD APEX. However, actually doing it would require you tomanually determine the direction for three time frames each time, and that judgment varies day to day, depending on your condition and whether you have drawn down. FAD APEX fixes that“varied” part.
| Work that humans tend to vary | What FAD APEX fixes |
|---|---|
| Switching among three time frames to determine direction | Display long-term, mid-term, short-term directions on one panel constantly. Eliminates switching and subjective judgments |
| The feeling that “this signal seems good” | S / A / B ranksquantify the degree of condition alignment in the same standard every time |
| Deciding exit positions by feel | EXIT display, and manage exit by the same standard (SL outside the range by yourself) |
| A sign proven in tests but disappears in live trading | No-repaint (evaluated on the confirm candle). Because signals do not disappear later, testing and live use align |
| Worried about the tool placing orders by itself | Do not use automatic trading. You must place orders yourself |
Compatibility is with MetaTrader 5 (MT4 not supported). Validated scopes: Gold (XAUUSD), major currencies, BTC, on M5–H4. Use 1-minute and 3-minute as entry lower-timeframes, and always determine direction on the panel’s upper timeframe.
8. Common questions
Q. Which is better, 1-minute or 3-minute?
A. Use 3-minute until you’re accustomed. The 1-minute chart has more signals, which increases the chances you pass on entries. Once you’ve learned the model on the 3-minute chart, you can switch to 1-minute and choose from more signals.
Q. How frequently does the three-layer alignment occur?
A. It depends on the instrument and market environment. If it never aligns, you don’t enter. Being able to accept “zero entries today” is the difference between continuing with this model or not.
Q. It’s difficult to judge whether the short-term is in Range.
A. The FAD APEX panel shows the short-term state, so if you’re unsure, follow the panel’s display. The aim of this model is not to judge with your own eyes.
Q. What about win rate?
A. Win rate and profits cannot be guaranteed (legally also). What you can do is provide the same decision materials for entry, exit, and waiting every time. The most reliable way is to see posts from actual users in the free Discord.
Q. Can beginners use it?
A. A 5-step manual is included. Settings work with default values. If you’re unclear, you can ask in Discord.
9. People who suit it and those who don’t
| Suitable for | Not suitable for |
|---|---|
| ・Want to reduce entries and improve quality ・Have experienced losses by going against the higher time frame ・Trade with the assumption of placing stop-loss ・Feel it’s easier to follow rules | ・Want to trade a lot every day ・Want the tool to automatically trade for you ・Do not want to place stop-loss ・Expect guarantees for win rate or profit |
10. Voices from people who actually use it
Gogojungle’s rating is★4.91 (37 reviews),224 peopleare using it (as of Sep 2026, listed on product page). You can read the reviews directly on the product page. We keep both positive and negative feedback unchanged.
In the free Discord community “FAD Community,” users post daily usage reports.Before purchasing, it’s best to see real usage and decide.
11. From introduction to operation

|
View FAD APEX product page ▶ FAD APEX|MTF Structure Analysis × S/A/B Rank Signals × EXIT Take Profit|MT5 Indicator |
https://www.gogojungle.co.jp/tools/indicators/78372
【Disclaimer】This article explains how to use analysis software and does not endorse specific trades or guarantee profits. Margin trading such as FX/CFD carries the risk of losses due to price movements, and leveraged trades may incur losses exceeding deposited margins. Expressions like “likely to extend,” or “risk 1 to reward 2–3” are based on the author’s and the user community’s experience and are examples, not guarantees of future results. The example diagrams are conceptual and do not reflect actual charts. We are not registered to provide investment advice or agency services. The final decision and its outcome in trading are entirely the customer’s responsibility.