

Nikkei 225 Futures Simple Trade September 11, 2026 (Friday) Review (Chart Commentary)
Good morning!
Let's review yesterday's trade answers.
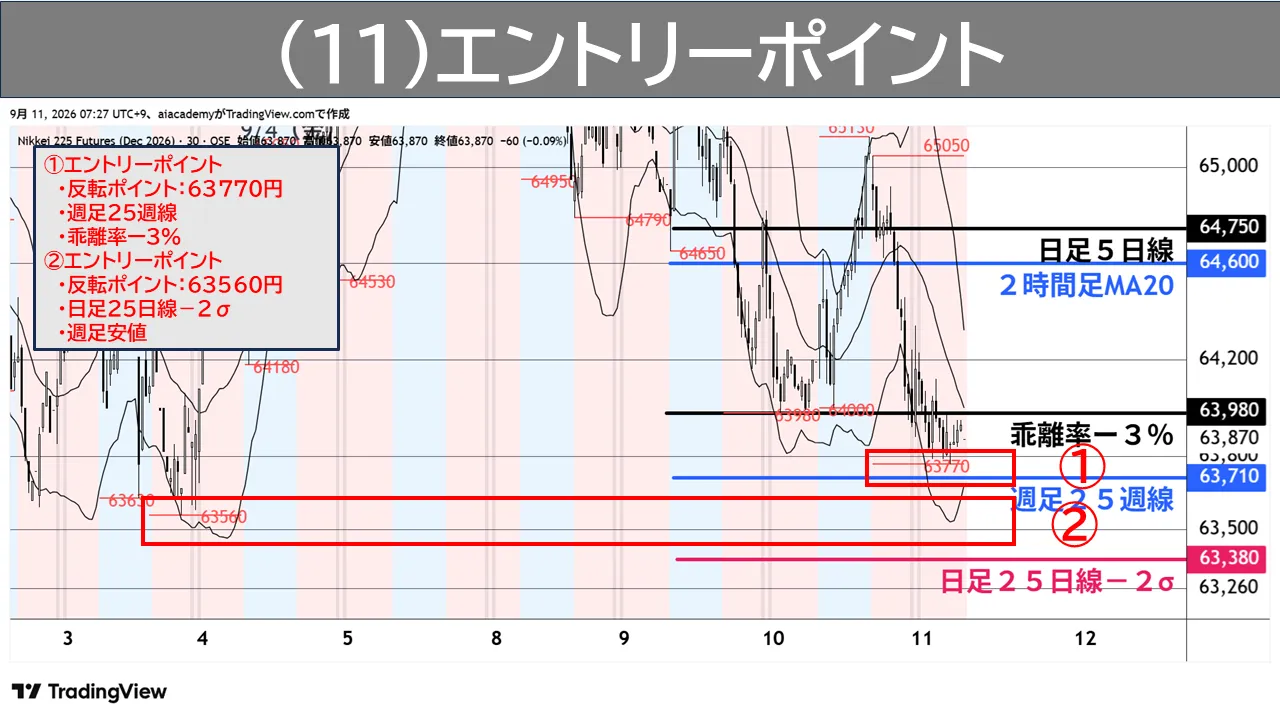
The chart below shows the entry point that was distributed on the morning of September 11.
Those who viewed the distribution, what points did you focus on when watching the market?
On this day, the key points for interpreting the market were as follows.
① There is a downward deviation of 3%, the weekly 25-week line, and the daily 25-day line minus 2σ.
② If it reverses and starts to rise, pay attention to the 2-hour MA20 above or the daily 5-day line.
We considered the combination of these reversal points to determine the entry, along with the candlestick setup.
In the chart below, we will step by step review how each price action and actual price movement behaved.
Those who are members will understand, but...
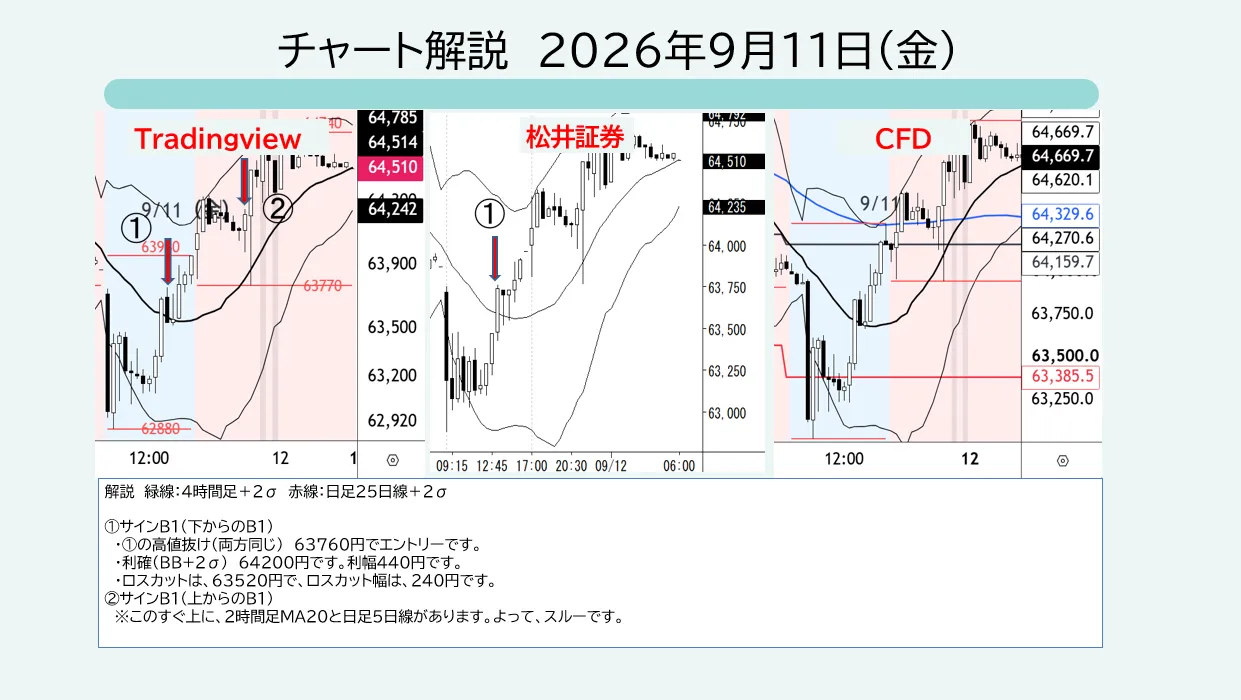
Before point ① occurs, A1 signals appear, but since there is no reversal point, we cannot judge.
We skip it.
The signal at ① was easy because the candlestick setup lined up neatly.
As for the signal at ②, there are two-hour MA20 above and the daily 5-day line above.
This judgment was difficult.
Since the signal at ② is the second B1, the win rate is considered low, so skipping is better.
Today (the 14th) looks like a similar market as well.
If it drops sharply, trades like this will occur, so it’s easy to anticipate.
For a detailed review, please refer to the chart below.
Thank you again for today as well.