
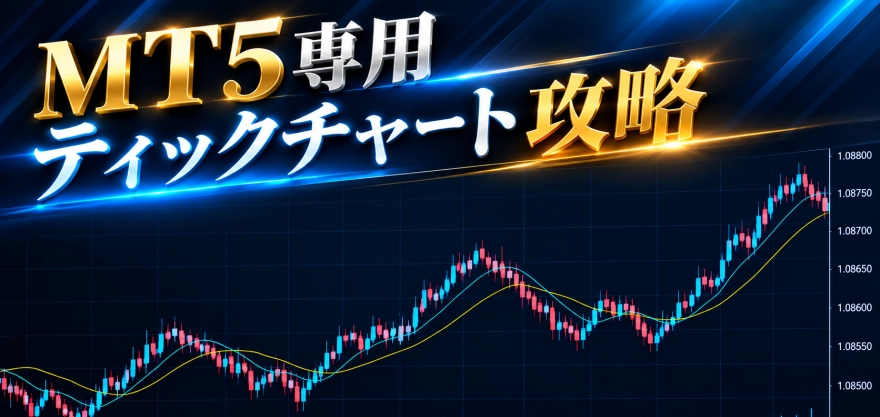
It is possible to display an arbitrary tick chart in MT5!
I created an MT5 indicator that displays a “tick chart.”
Bob Volman’s FX Scalping, a long-standing classic book read overseas. The illustrations in that book are all drawn as tick charts. They are charts that divide trading by number of trades, not by time, in an unfamiliar form.
Readers typically first confront the question, “Where do I put this chart in MT5?”
The answer is, nowhere. It isn’t natively included in MT5.
To fill that gap, I created this tool.
What exactly is a tick chart
Open MT5 and create a chart. It can be a 1-minute chart, 5-minute chart, or daily chart.
The horizontal axis of that chart is all “time”.
One minute passes and a new candle is born. Five minutes pass and the next one is born. No matter what happens in the market, as time moves forward, the candles advance.
This seems obvious yet is actually a little strange.
In the dead of night at 3 AM, when prices hardly move, candles are still born every minute. A row of almost meaningless candles lines up almost horizontally.
On the other hand, at the moment of an economic release, thousands of trades occur within one minute and prices move by tens of pips. Yet the candle remains just one. The world’s most dense 60 seconds are squeezed into the same width as any other 60 seconds.
Time does not know whether the market is moving.
Tick charts change this fundamentally.
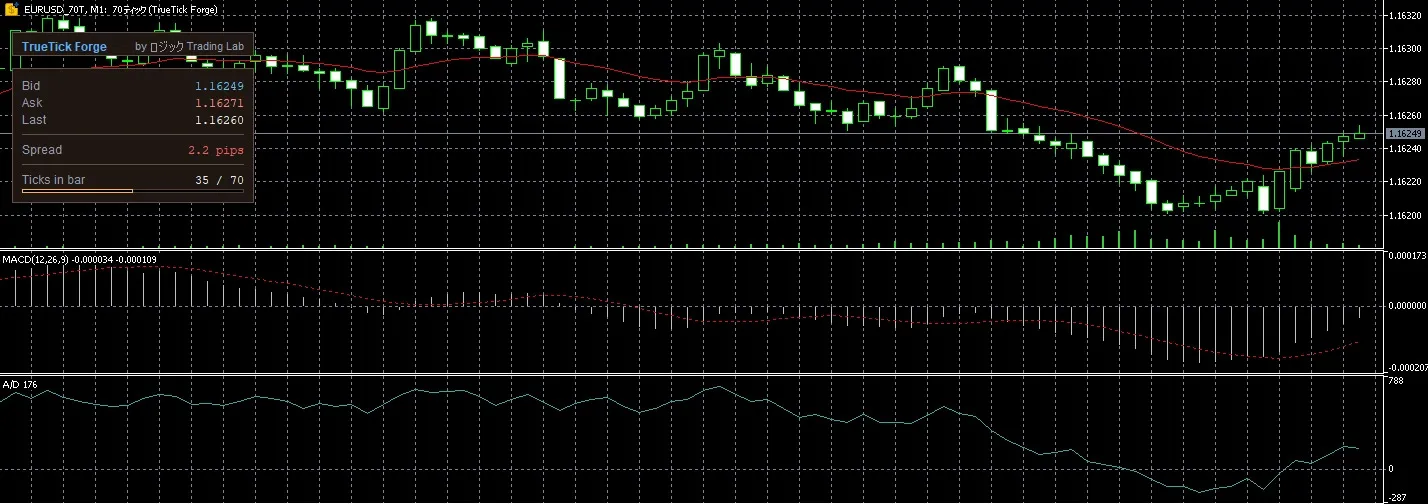
Not by time,but by how many trades have occurredto define each candle. If there are 70 ticks, a new candle forms every 70 price movements. When the market is active, candles flow; when it’s quiet, they stop promptly. No meaningless candles in the late night, and dozens of candles during releases.
The chart’s width becomes the amount the market actually moved.That is the screen Volman watched.What TrueTick Forge can do
- Change the number of ticks to generate candles freely
- Use many existing indicators as-is
There are only two capabilities, but they are substantial.
The generated view can be treated like a regular MT5 chart. In other words, you canoverlay any indicator you like
Whether moving averages, oscillators, or your own creations, you can place them on the tick-axis exactly as you would on a standard chart.
The same logic, but with a different x-axis, changes how things look.
Periods with no price movement do not advance candles. The display runs calmly, and judgments become quieter. Conversely, when prices move, what would have been a single minute candle on a 1-minute chart can break into dozens on the tick axis. The amount of information you can read from the same 60 seconds is dramatically different.
There’s no need to change methods.You can verify your current methods on a different axisthat’s all.
The first tick count is the same idea. Volman’s “70” is not a fixed value. It can be adjusted to suit the instrument, time of day, and your trading speed. 70 is a starting point, and beyond that is up to the user to decide.
I didn’t want this to be a tool that merely reproduces a book’s diagram. I prepared a foundation and let users decide what to place on top. That’s how this is built.
In conclusion
There are no flashy trading signals. It won’t tell you “buy here.”
What this tool does is simple.Create a display inside MT5 that MT5 didn’t havebefore.
However, what you look at during short-term trading is probably as important as how you interpret it. Whether you’re watching the clock or watching the market matters more than you might think.
If I can reach someone who has been treading water at the same point, I’d be glad.
Product Page: MT5 Tick Chart Generation EA TrueTick Forge
#GogoJan Scalping Feature 2026