
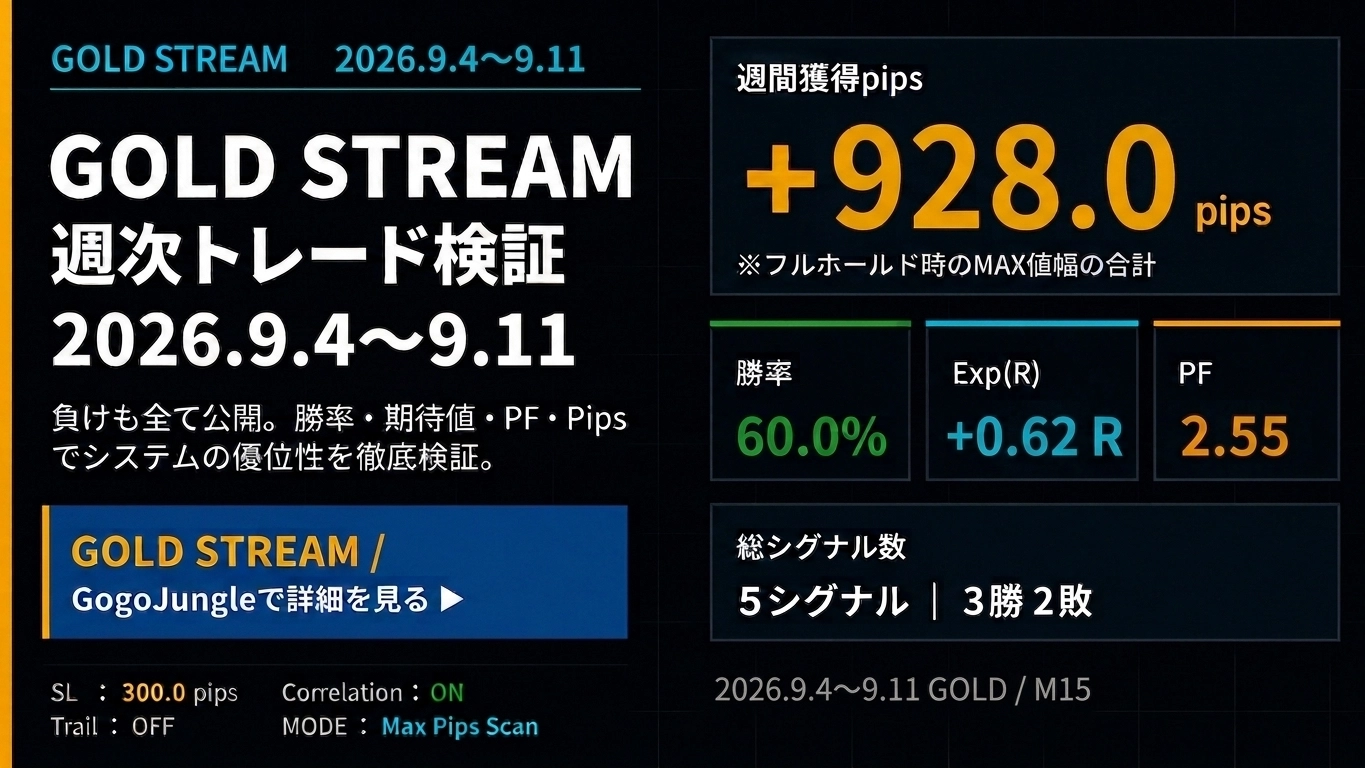
+928pips【Weekly Trade Verification & Distribution History】GOLD Day Trading Specialty "GOLD STREAMv2" 2026.9.7~9.11
+928pips【Weekly Trade Verification & Delivery History】
GOLD Day Trading Focus "GOLD STREAM v2" 2026.9.7~9.11
Assess GOLD’s price movements, strength, and correlations, and verify signal accuracy, price range, and expected value each week. Not only win rate but also compare PF, Exp(R), and 5-day ADR to evaluate this trading environment.
① GOLD Market Analysis
1. Price Variability
From September 7 to 11, GOLD traded in a market that reacted to interest rates, the dollar, and inflation indicators throughout the week. In the latter part of the week, after US CPI, expectations for Fed rate hikes strengthened, putting downward pressure on the price, but on September 11, buying on dips pushed spot gold temporarily to around4,363 dollars ± over 1%. However, on a weekly basis it fell about 1.5%, indicating a short-term consolidation within an uptrend.
US August CPI rose by+0.4% versus the prior month, and with stronger expectations of Fed rate hikes, US interest rates rose, weighing on GOLD’s upside. CME FedWatch showed probability of a rate hike at the next meeting rising to temporarilyabout 87%. For GOLD, this creates a difficult-to-define direction as both “inflation-driven safe asset demand” and “headwinds from rising interest rates” exist simultaneously.
2. Demand/Supply & Investment Factors
On the supply side, central banks continuing to accumulate gold remain a medium-to-long-term support for GOLD. According to the World Gold Council, pure central bank gold purchases in Q2 2026 were289 tons, a high level. Also, July saw central banks overall net purchases of23 tons, with China purchasing 20 tons and Poland 8 tons.
On the other hand, price increases continue to pressure jewelry demand. WGC reports jewelry demand in Q2 2026 fell to278 tons. While physical demand is restrained at high prices, central banks and investors’ demand supports the market.
Regarding supply, Q2 2026 mine production rose 2% year over year to 965.6 tons965.6 tons, but recycled supply declined by326.1 tons, down 6% YoY. Total supply was roughly flat YoY. Even at high prices, supply growth is not accelerating, leaving medium-to-long-term price support factors intact.
3. Investment Trends
In terms of investment, August saw particularly strong inflows into gold ETFsGold ETF inflows were especially strong. According to the World Gold Council, August’s global net inflow into gold ETFs reached$18 billion, a monthly record. Total assets under management for gold ETFs rose by 16% MoM to$6,150 billion, and holdings increased by 121 tons to4,189 tons, a new high.
Regionally, North America and Europe saw notable inflows, with North America at$7.7 billion and the UK at$4.4 billion. In Asia, funds flowed into gold ETFs, led by China. WGC cites concerns over fiscal policy and US debt markets, currency policy anxiety, and momentum investing from rising GOLD prices as factors boosting inflows.
Moreover, as of September 11, despite expectations of higher interest rates due to US inflation indicators, GOLD saw dip-buying. Reuters reports that physical demand in India was weak due to price fluctuations, whileChina shows strong investment demand. In other words, GOLD’s price formation is now significantly influenced by ETF/investment demand and central bank demand, in addition to physical jewelry demand.
4. Overall Assessment
This week, GOLD faced a tug-of-war between upward pressure from higher interest ratesand buying demand from central banks, ETFs, and investors. In the short term, it’s highly dependent on US CPI, Fed policy, US 10-year yields, and dollar movements, making it risky to chase only the upside.
In the medium-to-long term, however, continued central bank buying, large ETF inflows in August, and constrained supply support GOLD. Therefore, it’s important not to judge GOLD as simply strong or weak, but to assess by integrating interest rates, the dollar, ETF funds, central bank demand, and price range.Judging by the combined factors: interest rates, dollar, ETF funds, central bank demand, and price rangeis crucial.
This week’s 5-day ADR was981 pips, offering ample range for short-term trades, but with many opportunities where the market direction reversed after entry. Instead of “buy because it rose,” first identify the potential price range you can target, then assess strength/weakness and correlations before entering. This order of steps is especially critical for high-volatility assets like GOLD.
⑤ SILVER / COPPER Market Conditions
SILVER
SILVER rebounded on September 11, temporarily up1.6% to around 64.54 dollars, but the week fell about2.6%. While US CPI-driven rate hike expectations and rising yields weighed on prices, Chinese investment demand provided support. Like GOLD, it’s important to follow the direction using interest rates and the dollar, while considering industrial demand.
COPPER
COPPER rose in the first half of the week on the LME to over$14,800/ton before retreating due to tariff-related uncertainty. As of September 11, it was around$14,233/ton. Supply constraints remain, but tariffs, high rates, and economic slowdown create choppier short-term moves.
② GOLD STREAM v2 Weekly Trade Verification
Weekly verification results
③ GOLD STREAM v2 Delivery History
Weekly signal delivery history

④ Weekly Verification AI Evaluation
This week5-day ADR 981 pips provides ample range, but there were many instances where the market direction reversed mid-move. Therefore, we evaluate not only whether a signal appeared, but also win rate, PF, expected value, and range efficiency.
■ Signal Judgment and Entry Precision
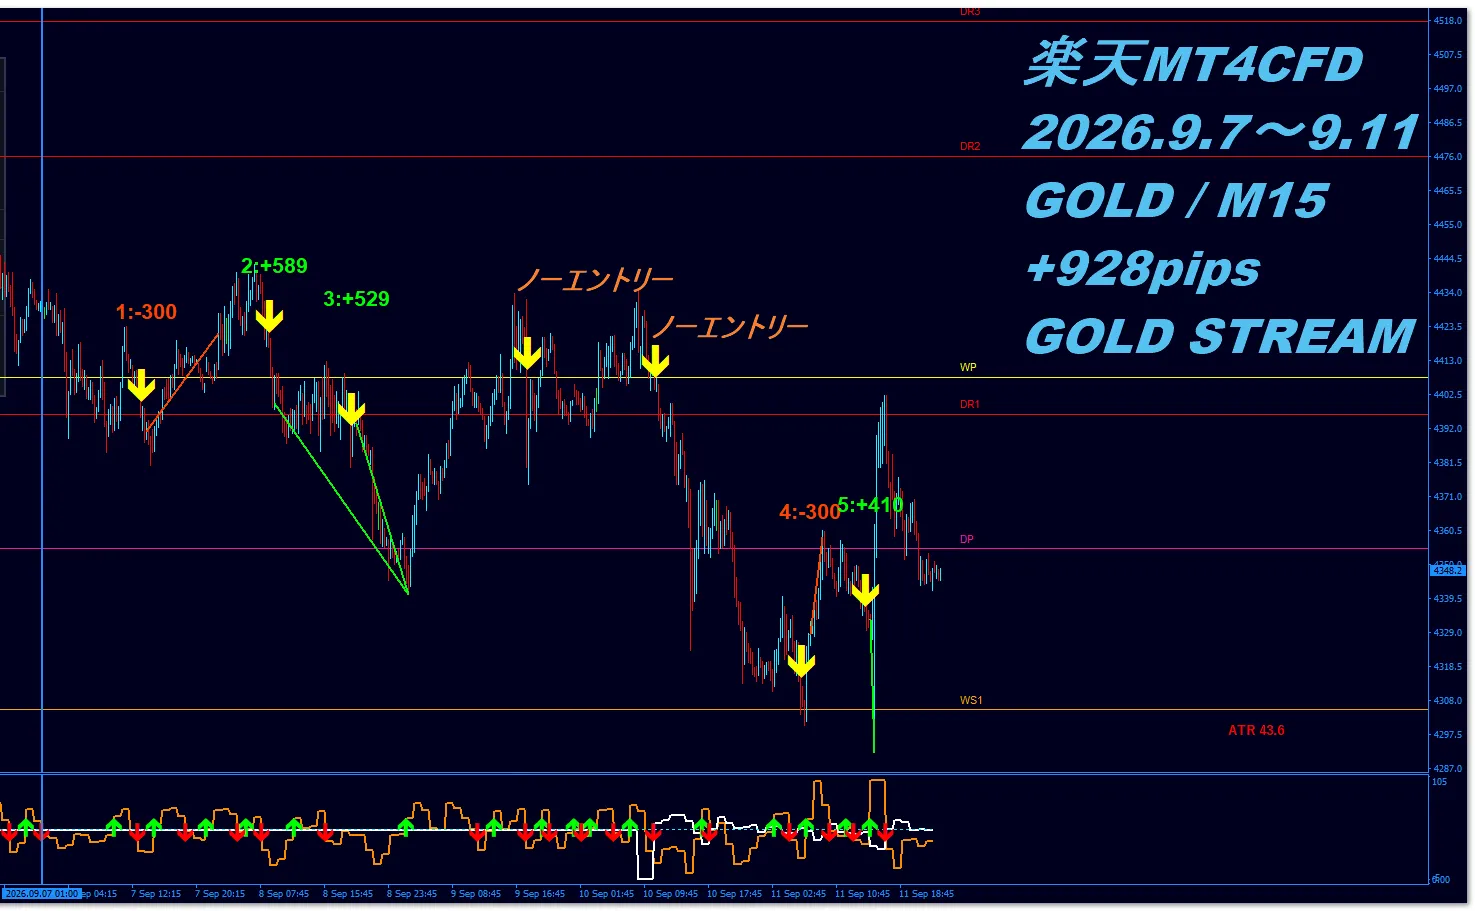
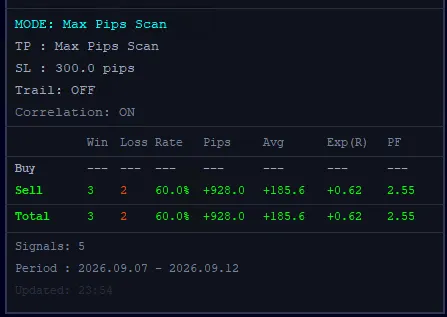
The verification panel recorded5 signals with results of3 wins, 2 losses; win rate 60.0%. All were Sell signals this time, with three winning trades of +589pips, +529pips, +410pips and two losses of -300pips. Also, two signals were signaled to skip due to misalignment in correlation.
Total maximum range is+928 pips, with an average of+185.6 pips. The total max range relative to the 5-day ADR of 981 pips is about94.6%, capturing a consistent range within the week’s environment.
Looking only at the win rate of 60.0% suggests “2 of 5 lose,” butPF 2.55 indicates total profits about 2.55 times total losses, andExp(R)+0.62R shows that even with a 300-pip stop loss, the average expectation was positive. From both win rate and payoff balance perspectives, the signal accuracy is at a level with positive edge.
■ Results from Win Rate, PF, Exp(R)
Win rate 60.0% does not mean all signals win. However, losses were limited to -300pips on two occasions, while winning trades secured +589pips, +529pips, +410pips, creating a structure that limits losses and exceeds them on the win side.
As a result, PF is2.55. This demonstrates a profitability balance that cannot be explained by win rate alone. AlsoExp(R)+0.62R indicates, when viewing each trade as a 300-pip risk unit, the average expectation was positive.
However, with only 5 signals in the sample, it is important to continue weekly verifications using the same criteria to ensure win rate, PF, and Exp(R) stay positive.
■ Strength, Weakness & Correlation Analysis
This week, US CPI, the dollar, and US rates influenced GOLD’s direction. Therefore, it was crucial not to chase Sell based on price alone, but to verify whether strength/weakness and correlations pointed in the same direction.Whether strength and correlation aligned in the same direction was important to confirm.
In charts, we tested 5 signals under Correlation: ON (correlation filter applied). From 3 wins and 2 losses, directional detection maintained a certain level of accuracy, but rebounds also produced reversals. Going forward, it’s important to consider both price ranges after signal generation and reversal risk.
■ MAX Pips Scan & SL
This chart usesMODE: Max Pips Scan / Correlation: ON.
The displayed pips indicate the MAX value if the price action after a signal is fully held. Therefore, +928 pips does not represent actual filled profits.
Also, the stop loss (SL) decision is based onthe 4-hour chart. It is not determined by short-term movements on the M15 chart.
■ GOLD Market Difficulty
★★★★☆ 4 / 5
5-day ADR981pips provides ample range for short-term trading opportunities. Yet, directionally disturbed by US CPI, interest rates, and dollar moves, finishing 3 wins and 2 losses shows that simply following one direction is challenging this week.“There is range, but direction must be judged”, so difficulty is rated 4/5.
■ GOLD STREAM Weekly Trade Verification Evaluation
★★★★☆ 4 / 5
This time, results were favorable with win rate 60.0%, PF 2.55, and Exp(R)+0.62R. Specifically, three winning trades of +589, +529, +410pips outweighed two losses of -300pips, indicating a range that exceeded losses.
On the other hand, given only 5 signals and a 60% win rate, it is important to continue weekly checks to see if PF and Exp(R) remain positive.
■ AI Overall Commentary
What we want to evaluate this week is not just simple win rate.Even with a 60.0% win rate, PF 2.55 and Exp(R)+0.62R were measurable, showing that it’s not only how many wins but how the magnitude of wins vs losses was managed that yielded a positive result.
In markets like GOLD where one move can be large, it’s more important to understand the target range and confirm strength and correlation before entering rather than chasing with a sole focus on win rate.Understand target ranges, confirm strength and correlation, then decide to enter.
To reduce the hesitation of “I don’t know where to enter,” and to judge calmly including win rate, PF, and expectancy, use GOLD STREAM v2 as a GOLD trading decision basis that does not rely on intuition alone.
Verification data evidence
Are you hesitating on GOLD entries?
“It’s rising, but I don’t know whether to enter now.”
“I can’t decide where to enter.”
“Moves are too big; entry feels scary.”
In markets where price ranges are large like GOLD, it’s important not to chase with intuition alone, but to have a decision framework that confirmswin rate, PF, expectancy, strength, and correlationbefore entering or waiting.
GOLD STREAM v2 is specialized for GOLD day trading, supporting entry decisions by confirming market strength and correlations.
View GOLD STREAM v2 product page Ask a questionRelated Articles
For more on trading concepts and GOLD trading, click here.
- 【Video】“GOLD STREAM Signals Movement After Signals | TRADE REVIEW (2026.8.10~9.04)”
- The one reason results aren’t there
- Why trades end up “drip and drop”
- 【Unveiling the tool’s true performance】GOLD STREAM Exclusive Win/Loss Analysis Tool Verification
- Conclusion: GOLD (XAU/USD) can be traded in domestic FX accounts.
The results and figures published in this article are based on back-tested data from past markets and are for reference only. They do not guarantee future profits or similar performance.
The pips and profit/loss data shown are based on the maximum range reached after an entry signal (MAX range) under fixed stop-loss (SL) settings. This MAX range reflects full-hold price movement after a signal and does not indicate actual filled profits or realized results.
Actual profits and losses depend on entry/exit timing, spreads, slippage, trading fees, execution environment, position size, take-profit/stop-loss judgments, and market conditions. SL judgments use the 4-hour chart as a basis, and results may vary under actual trading conditions.
Moreover, differences in trading conditions and price feeds across brokers and platforms may result in variations in actual prices, pips, profit/loss, and execution outcomes. Therefore, there may be discrepancies between published data and actual trading performance.
This data is intended as a reference for evaluating the signal edge and market analysis of GOLD STREAM v2. Final investment and trading decisions should be made by you, considering your financial situation, risk tolerance, and trading environment, at your own risk.