

【Entry Pattern Explanation】How to Use Trend Lines ~Trend Lines Part 2~ 【Line Analysis Basic Course #6】
Hello! This is SAKU.
Todayprevious articlecontinues with an article about trendlines!
In the previous article we looked at what a trendline is and what properties it has, but this time let's specifically examine its roles and how to use it!
The role of trendlines
As the name suggests, a trendline is drawn along the trend, and by drawing the line you can use it to judge entries, stop losses, and take profits.
Let's look at the basic usage.
・Entries using trendlines
In an uptrend, it serves as a cue for buying on dips; in a downtrend, as a cue for selling on rallies.This can be used as a signal for buying on dips.
When an uptrend line connecting two swing lows is drawn, and price approaches near that uptrend line, the idea is that the uptrend will continue (price will rise again), souse it as a buying on dips signal.
Using it as a buying on dips signal means thataround the uptrend line area there is a tendency for new buy orders (perceived support)to come in.
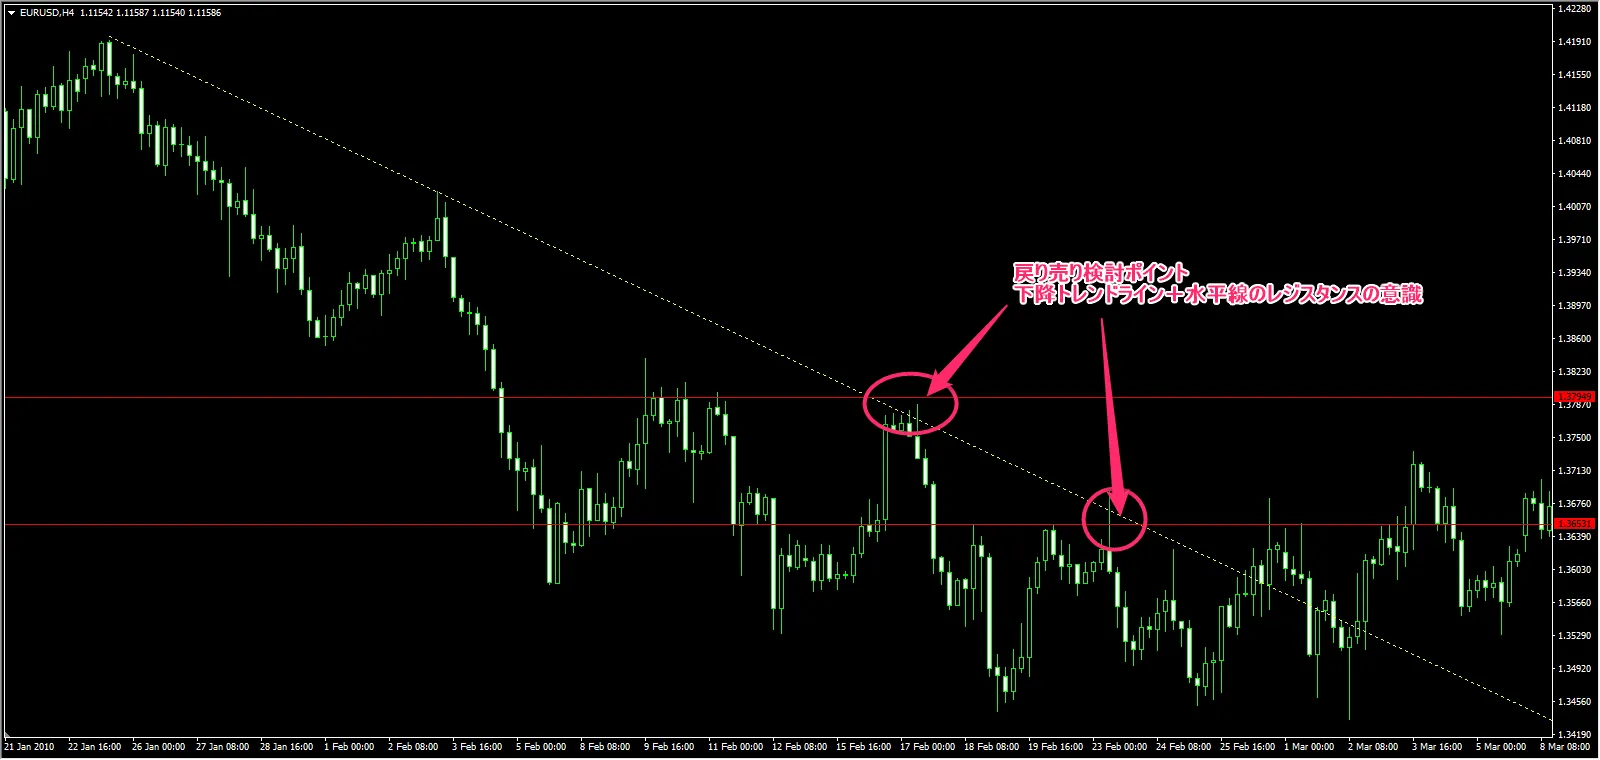
In the case of a downtrend line it is the opposite (perceived resistance, selling on rallies).
Also, if a trendline breaks, the trend flow may change, soentries after a trendline breakare possible.
We will discuss setup examples using trendlines later.
・Loss-cutting (stop-loss) using trendlines
When a trendline is broken → the trend direction may change, so if you used a trendline as a guide for buying on dips or selling on rallies, you place a stop lossoutside the trendline..
・Take-profit using trendlines
If the trendline is maintained,the trend is continuing, so you can hold the position.
If the trendline breaks, that may indicate a change in the trend, so it might be better to take profits on your existing position.
Trendline-based setup examples
From here, let’s look at setup (entry) examples using trendlines!
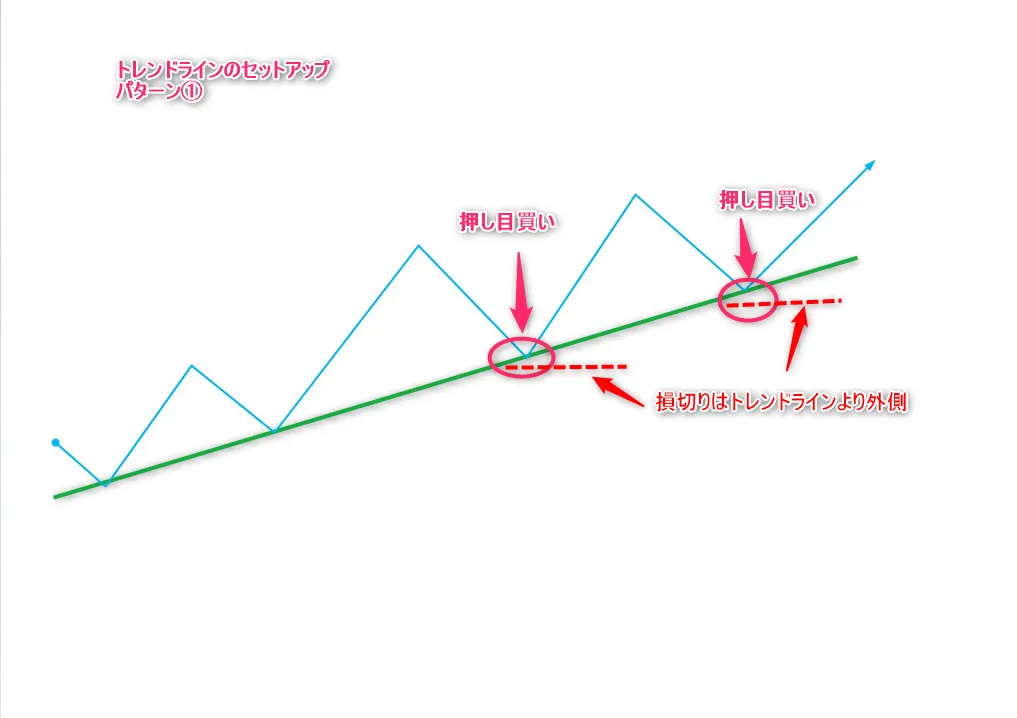
① Buy on dips / Sell on rallies pattern
Trendlines can also act as support or resistance in the direction of the trend,making them a guide for buying on dips or selling on rallies.This can be used as an entry cue..
In this case,the expectation is that the previous buying/selling sentiments around the trendline will continue, so the entry is made with that in mind.
・Trendline entries should also consider horizontal lines!
If you enter simply because price touched or came near the trendline, you’ll likely get stopped out repeatedly.
Because different traders draw trendlines differently and they aren’t always watched closely,
you should also check horizontal lines near the trendline to strengthen your entry.
The intersection of the trendline and a horizontal lineis where the diagonal and horizontal worlds collide, making the entry justification stronger.
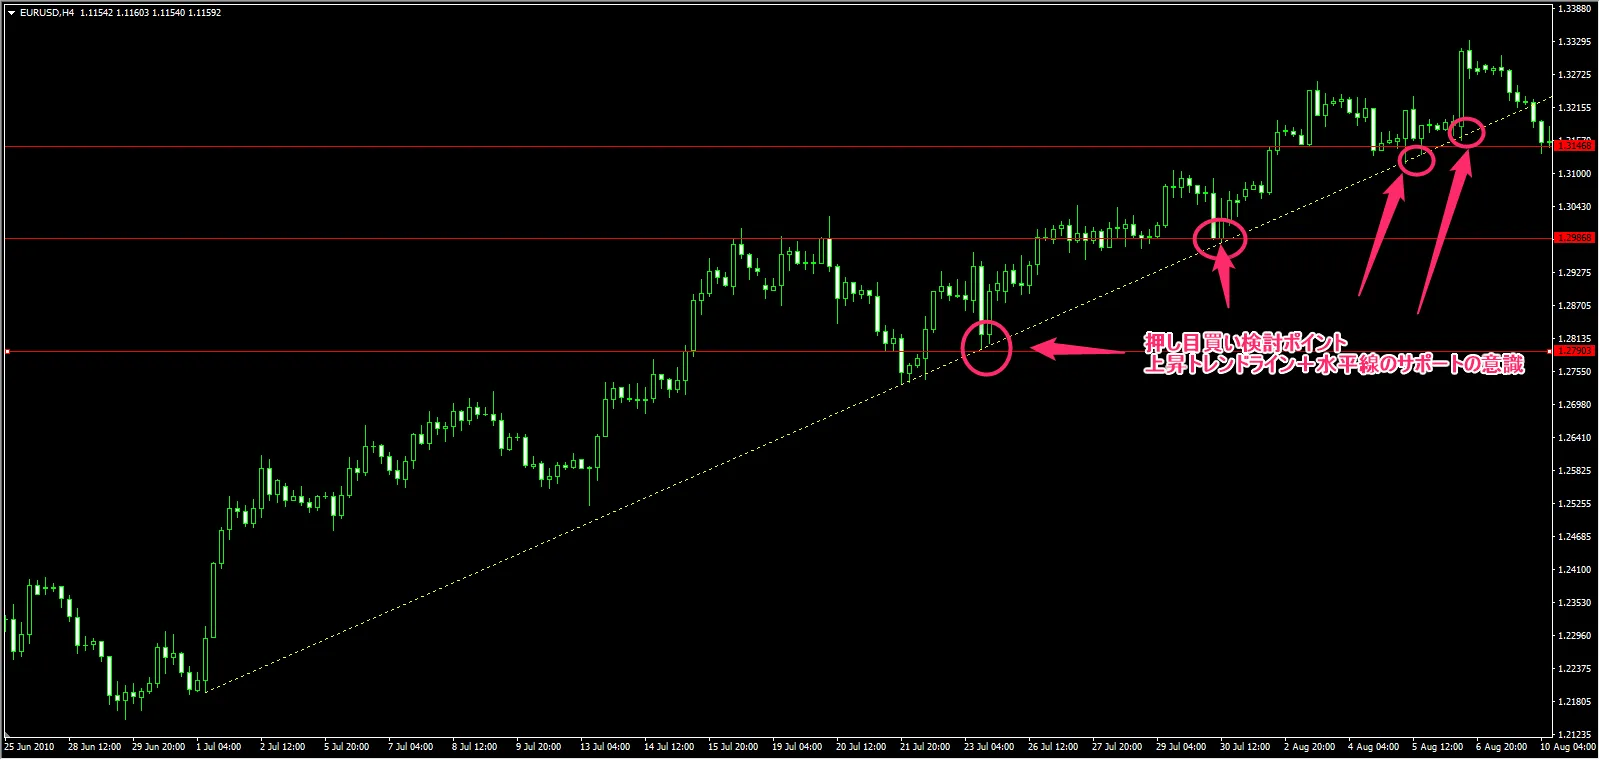
“Trendline + horizontal line dip-buy example”
② Trendline Breakout Pattern
If a trendline breaks (is breached), that suggests the trend may be changing.In this pattern,
after the trendline is broken, you anticipate a reversal in the opposite direction of the previous trendand enter accordingly.
More precisely, those who believed the uptrend line would continue are likely to have placed stops outside the trendline, so you target a drop that sweeps those stops..
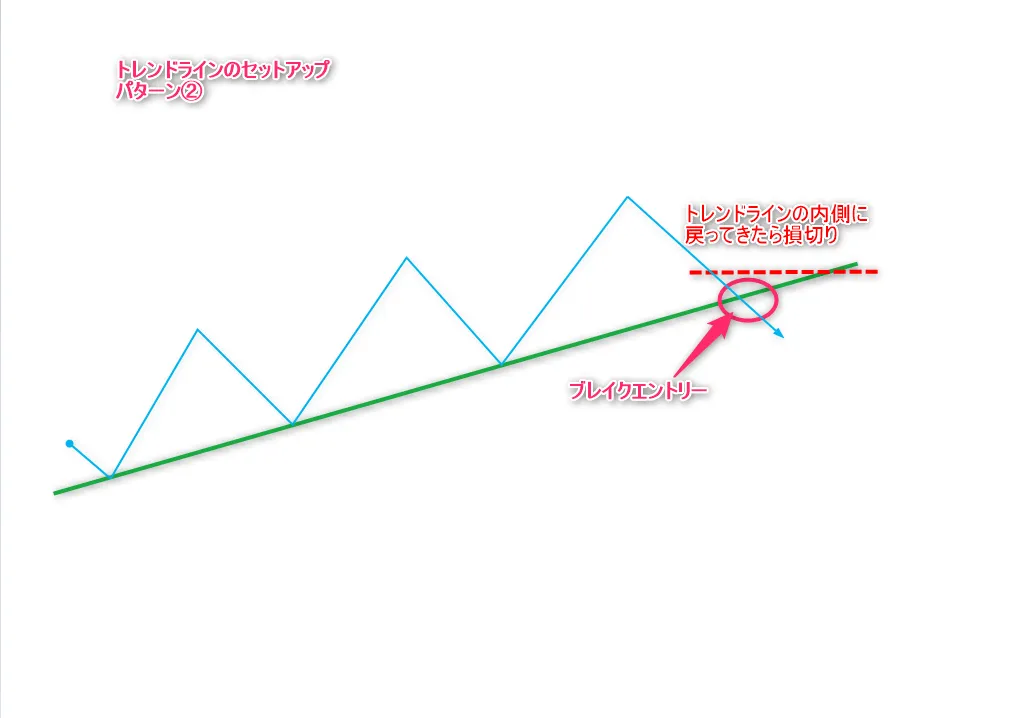
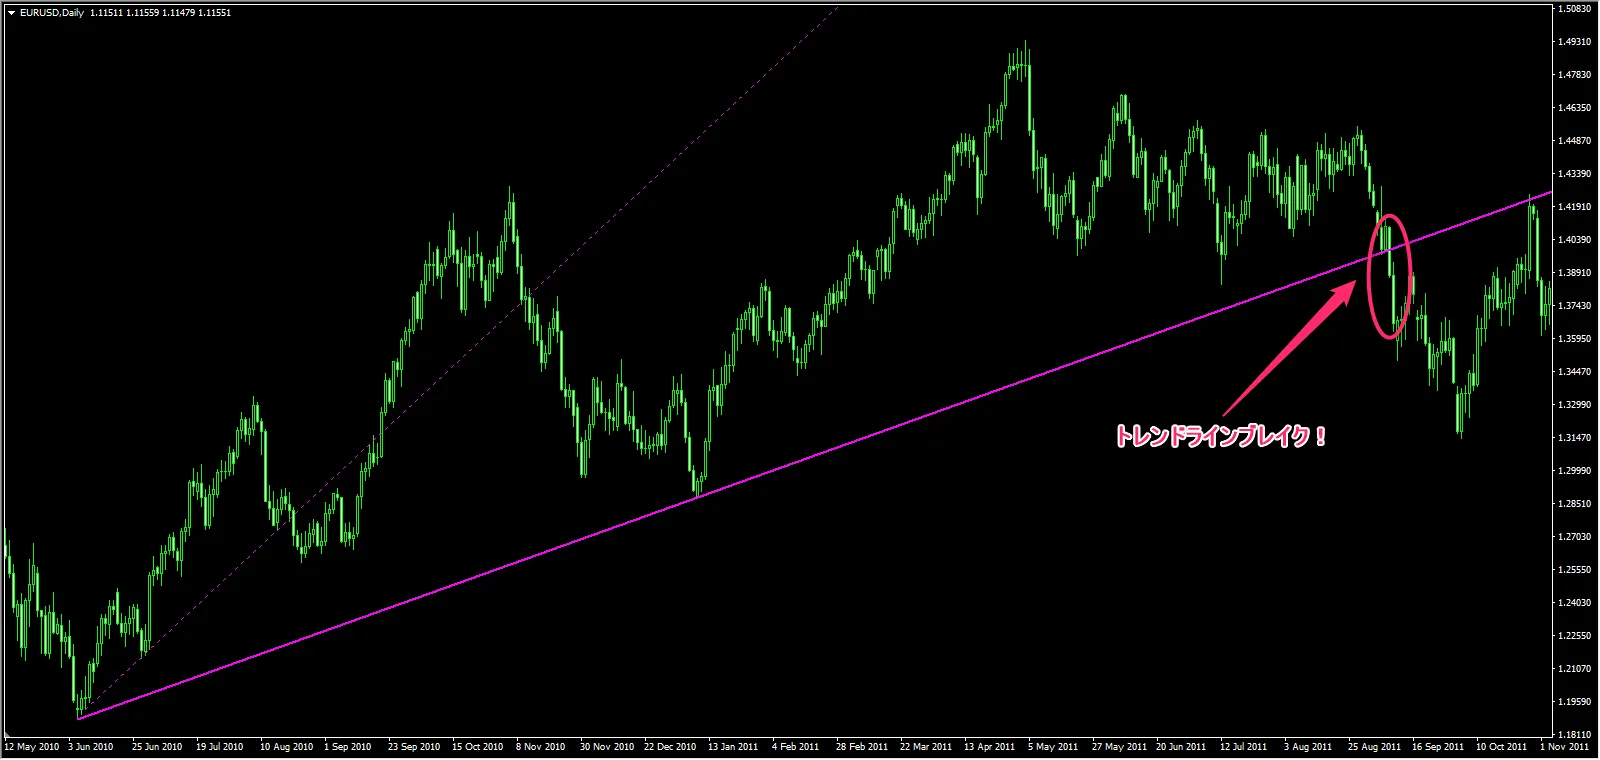
※ The dotted line on the left of the image is not a relevant line! Please ignore it! (sweat
What to watch out for here istrendline break ≠ trend end or reversal.
Trendlines are drawn along the trend flow, sothe actual judgment of trend end or reversal should be based on Dow Theory.
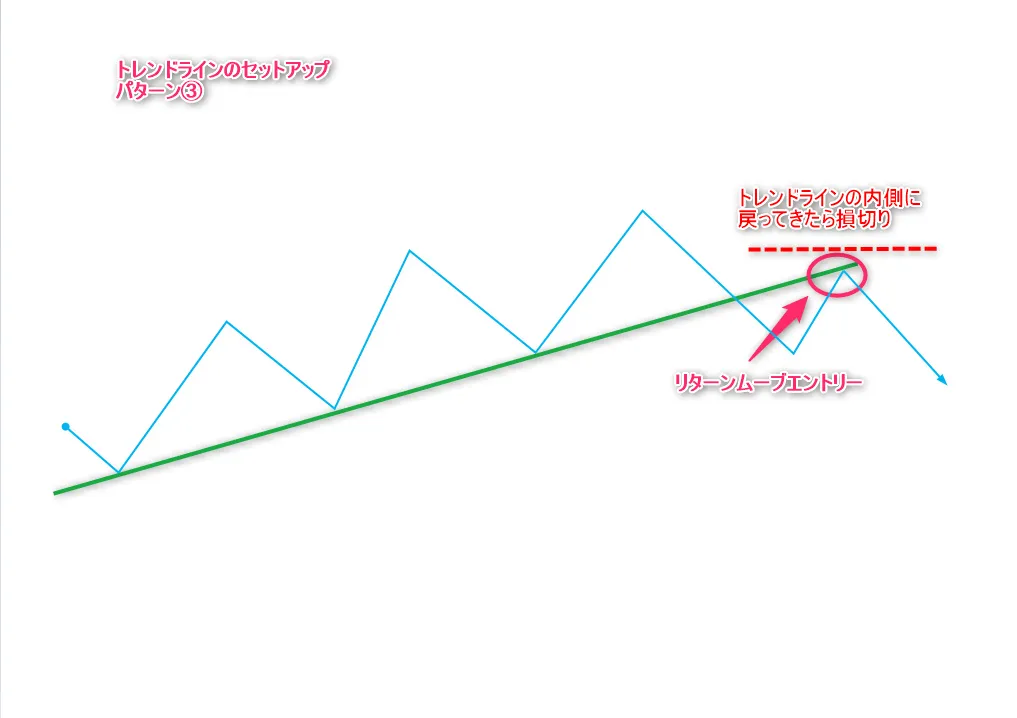
③ Return move (pullback) after trendline break pattern
Like horizontal lines, when a trendline breaks there can also be a return move.From a buying/selling mindset, in an uptrend, those who bought near the trendline on dips may take profits or cut losses when the line breaks. Yet some buying pressure may remain, so price may rise temporarily, but cannot return inside the uptrend line’s interior; what was support can become resistance (support-turned-resistance), and traders may exit or new selling pressure may appear, pushing price down rapidly.
These are the points targeted by the trendline break return move entry. I also call it a reversal entry.
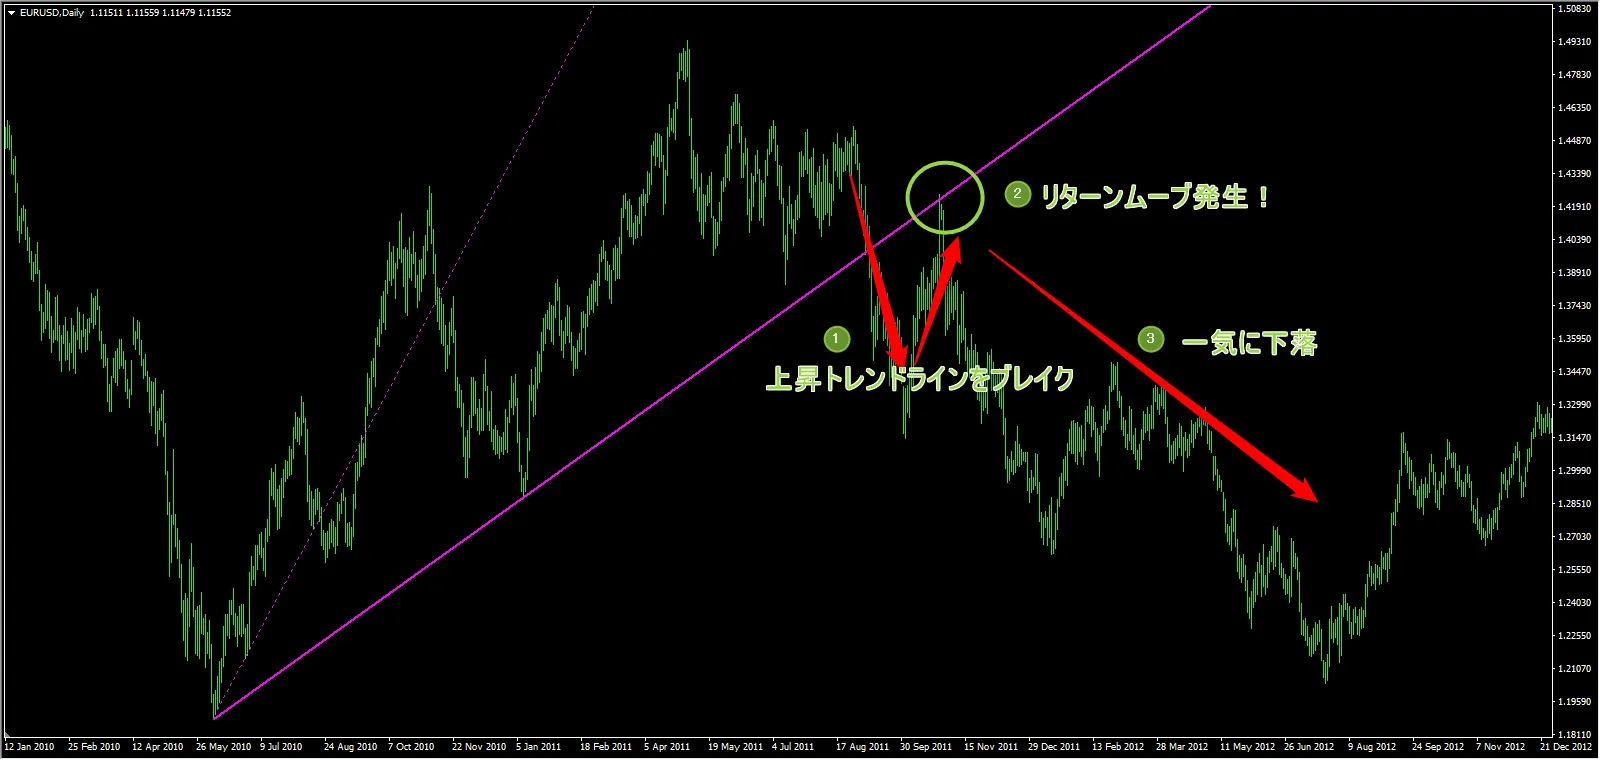
※ The dotted line on the left of the image is not a relevant line! Please ignore it! It just appeared by itself (sweat)
This entry method is recommended because if it works well you can hold a position from the early stages of a trend reversal.
Personally, I like this approach more than buying on dips or selling on rallies near the trendline.
Summary of setup examples
That’s all the setup examples introduced above summarized!
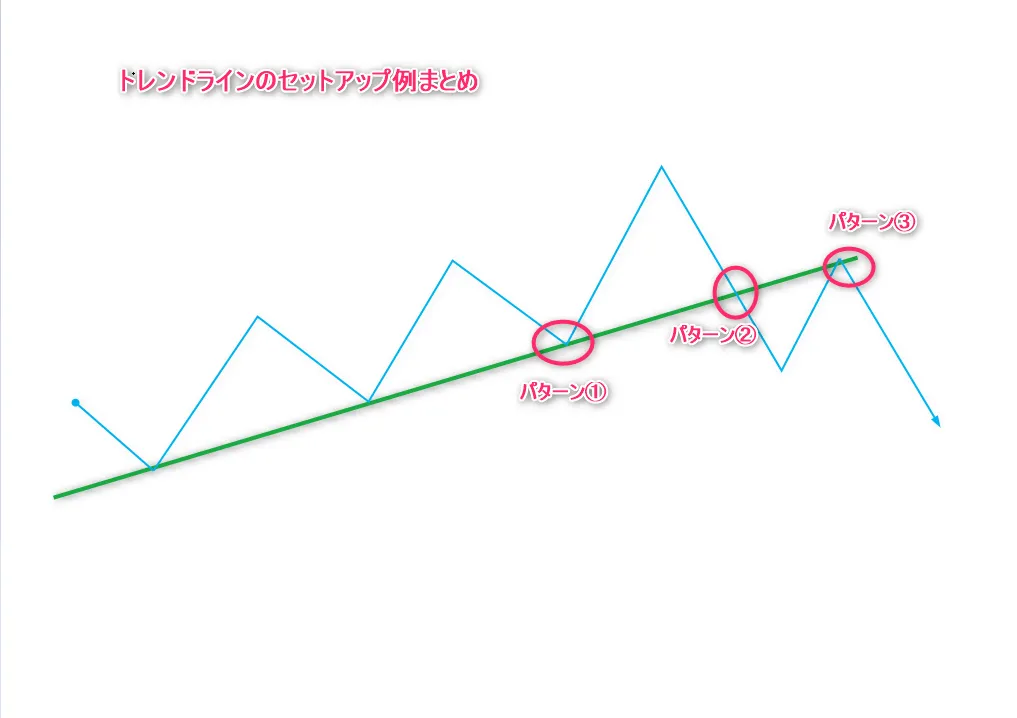
Each entry targets different movements, trading mindsets, and expectations, sodon’t assume all entries are the same or混乱させないようにplease be mindful!
There may be value in having many entry methods, but first understand and master one solid setup well.
From next time,“Channel lines”will be studied.
If this article was helpful, please give a like or a heart! It’s励みになります!
Next article here↓
What are Channel Lines? How to draw them, their properties and meaning – Channel Line Part 1 – Line Analysis Basics #7
For more practical and advanced line analysis and setup patterns from the basics, click here ↓
→MTF Multi-Time Frame Analysis Essentials (There is also a free trial version)

【Limited-time launch campaign!】→ MMS Trading Encyclopedia— The truth of the “structural traps” that individual investors fall into and market microstructure analysis that reveals the footprints of big players — (There is also a free trial version)