

What is a trend line? How to draw it, its properties and meaning ~ Trend Line Part 1 ~【Line Analysis Basic Course #5】
Hello! This is SAKU!
Up until now, we have looked at horizontal lines, how to draw them and how to use them, but starting from this articleI will write about diagonal lines with angles!
First, among diagonal lines, the representativeTrend lineswill be explained in several parts!
Master not only how to draw thetrend line but also its role!
What is a trend line
A trend line is a diagonal line with an angle drawn with a focus on the trend.
By drawing a trend line,you can visualize the overall direction, momentum, and flow of the trendand use it as a guide for entries, taking profits, and stop-loss levels.
Also,an uptrend line serves as a support line with a buying-oriented mindset, and a downtrend line serves as a resistance line with a mindset of upper price limits.
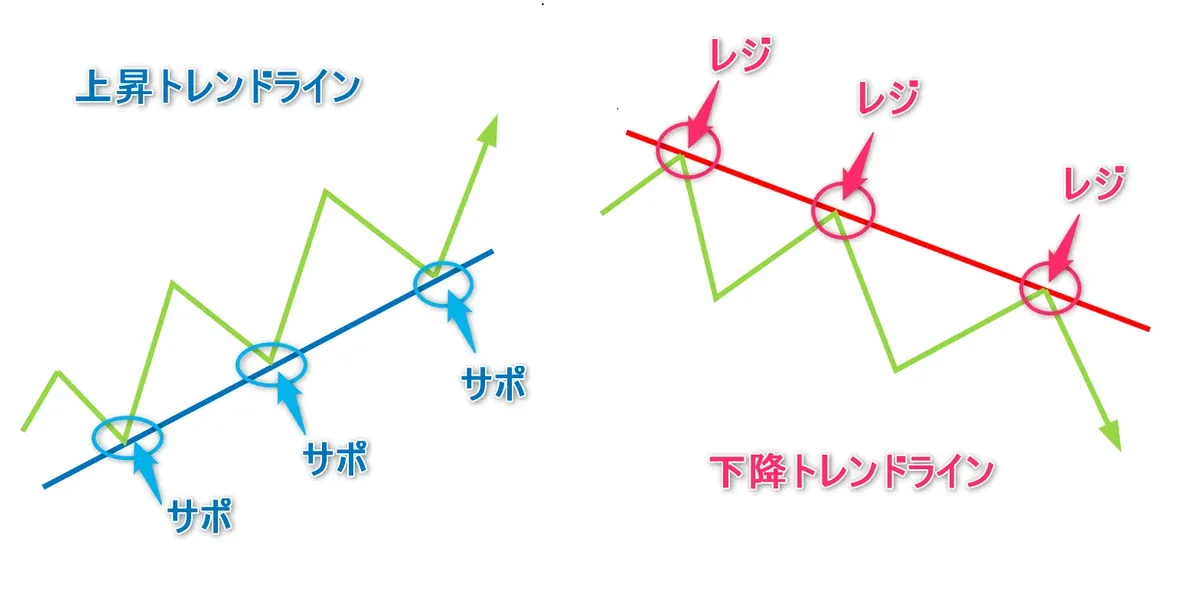
How to draw a trend line
・Definition of the trend line
Here, think aboutDow Theory’s definition of a trendagain.
In an uptrend, the lows and highs rise, and in a downtrend, the lows and highs fall,as you know.
A trend line is drawn to view the trend’s movement, so according to this definition,in the case of an uptrend,draw a rising line by connecting the two rising lows,and in the case of a downtrend,draw a line connecting the two falling highs in a right-shouldered down slope.
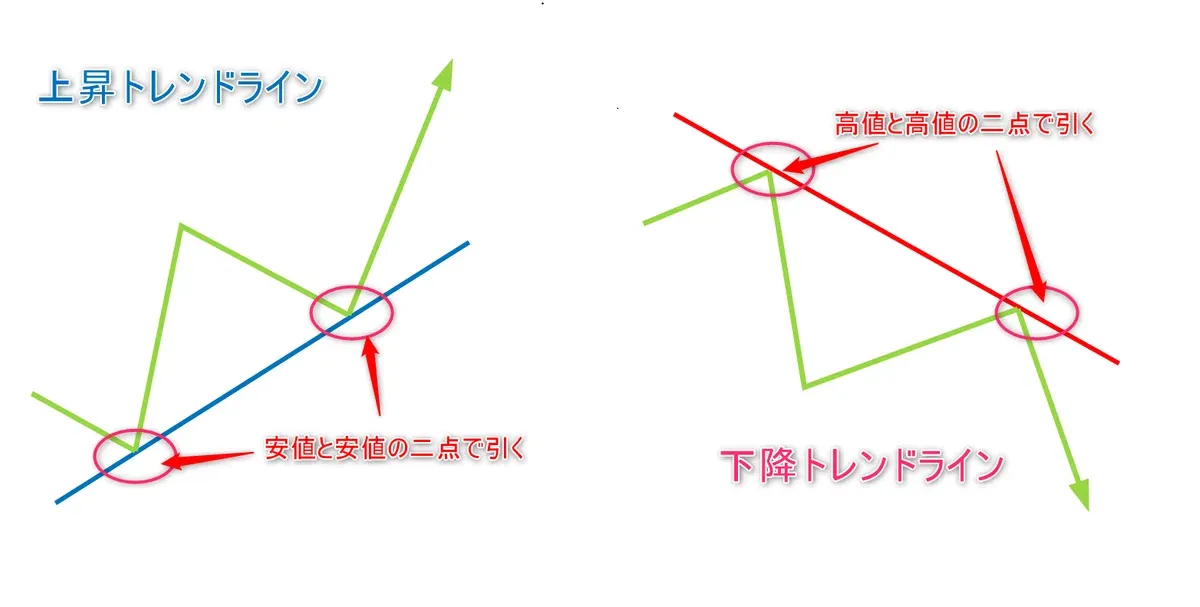
Sometimespeople draw a line by connecting the highs to form a rising line, but that isnot a trend line.
There are also uses of that kind of line, and if there is some intention behind drawing it, that’s fine, but if you’re drawing it without understanding, you shouldn’t call it a trend line.
To reiterate,an uptrend lineis drawn by connectingthe rising lows and lows,a downtrend lineis drawn by connectingthe falling highs and highs.
・Drawing along Dow Theory trend definitions
In an uptrend, simply connecting any lows and lows is not always appropriate.
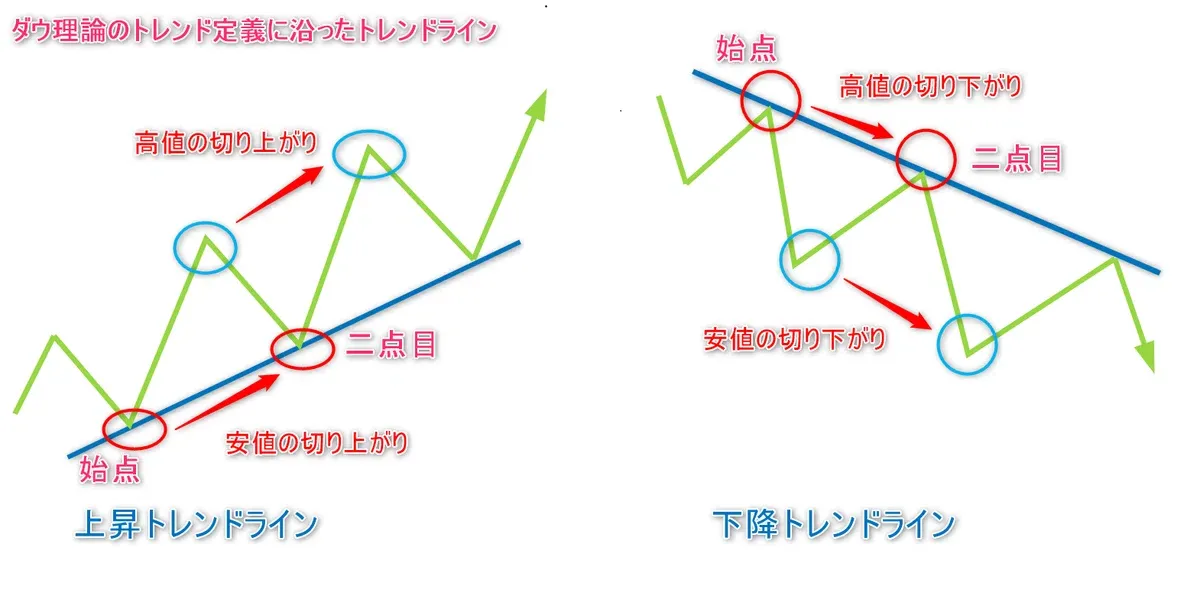
Trend lines are for visualizing trend movement, so first learn to draw lines that followDow Theory trend definitions.
In other words,an uptrend linedrawn byconnecting lows that are risingand,a downtrend linedrawn byconnecting highs that are falling.That’s how you draw it.
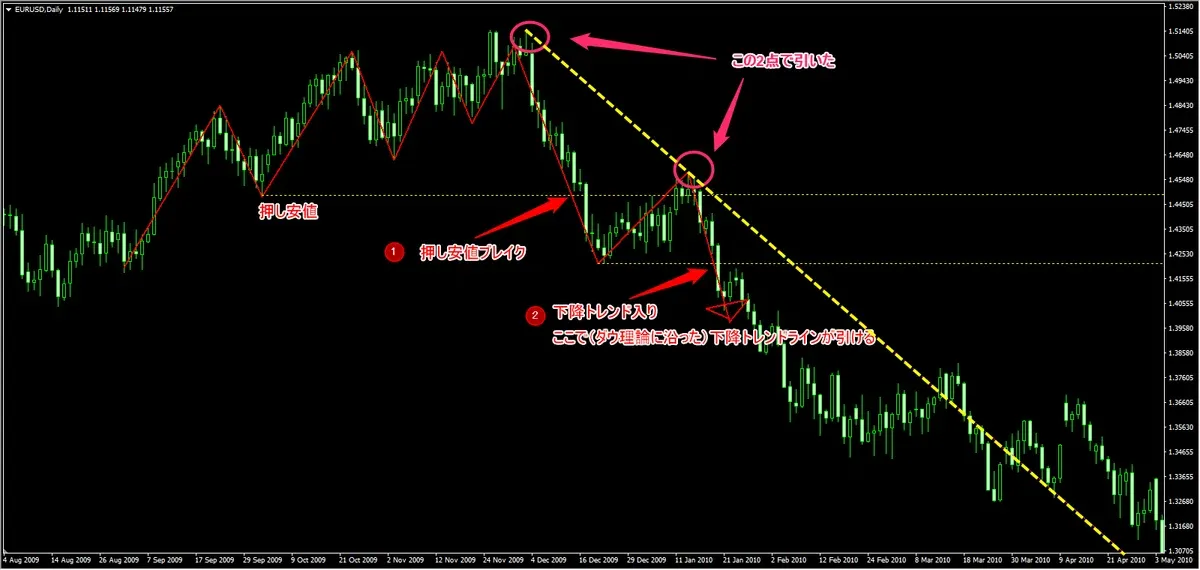
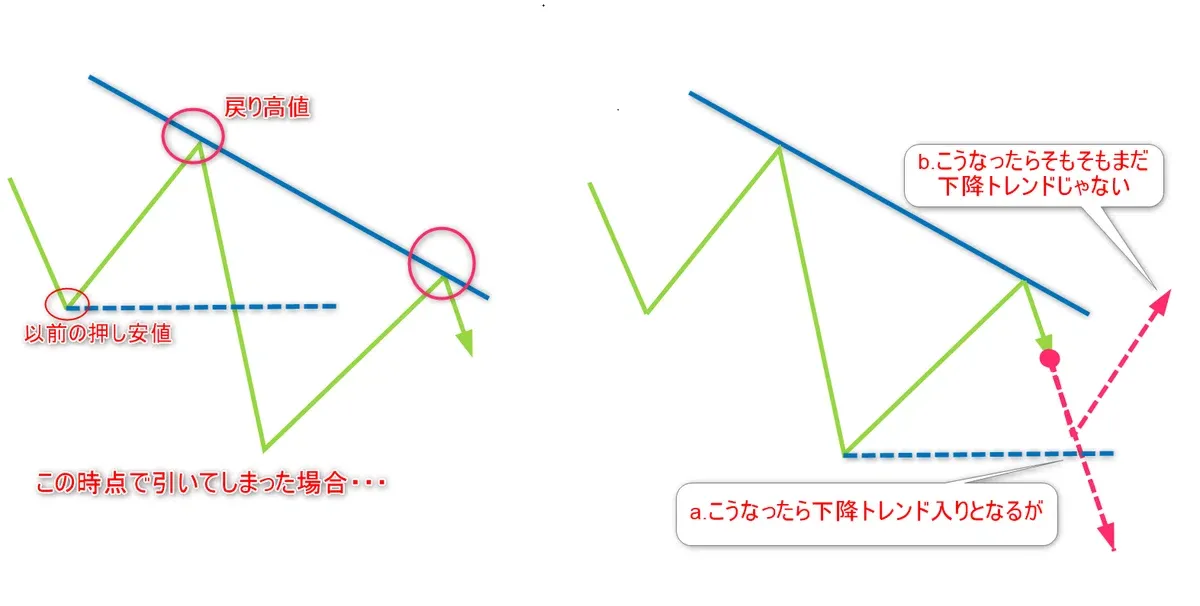
In the upper figure, at point ① the previous swing low was breached (the starting pink circle became a retracement high), and around the second point pink circle the highs appear to be falling, butthe lows have not yet fallen(i.e., the retracement high has not been updated), so at this point a Dow Theory trend line cannot yet be drawn.
Then at ②, the retracement high update (lows begin to fall) is confirmed, and only then can you draw a downtrend line. = Downtrend confirmed.
You could draw a provisional downtrend line around the second pink circle, but later you must confirm that it exceeds the previous low.
If the previous low is not surpassed, you may need to adjust or delete the line depending on the situation. Keep in mind that it is only a provisional downtrend line.Keep in mind that it is only a provisional downtrend line..
...Feeling tangled with retracement highs and such?
To be thorough, here is a schematic diagram!
Did you get it roughly?
There are many other ways to draw trend lines, and it’s not necessary to follow the Dow Theory method shown here, but as a basic starting point, it’s good to master this method.
Should you draw using wicks or bodies?
Basically,draw using the wicks.
The reason is that in many cases abroad candlesticks are not used, bar charts are, and a wick concept does not exist in bar charts, and drawing using the bodies alone does not account for wick ranges, making it more prone to noise.
Furthermore,draw so that there are no partial breaks in the line.
That said, if the wick is excessively long, you may ignore that part and draw..
Angle of trend lines
Trend lines are lines with an angle, and this angle is the key point.
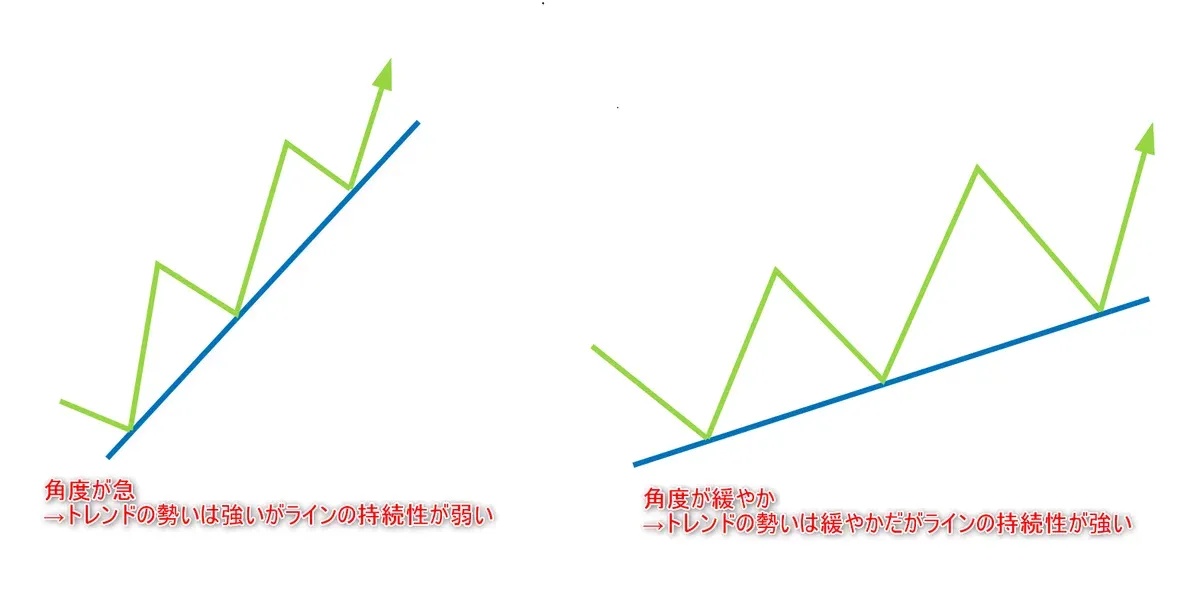
Generally,the more steep the trend line, the stronger the trend momentum, and the more gradual the angle, the milder the trend momentum.
On the other hand,in terms of trend line durability,the steeper the angle, the weaker the line’s durability, and the gentler the angle, the stronger the line’s durability.
This is because when the angle is steep,
the trend momentum is high → flow is fast → many are late to join → few people are watching the line → the line ends up short-lived
.
Conversely,
It’s like a sprinter in short distance vs. a long-distance marathoner!
First, avoid drawing lines that are too steep; aim for a more gradual slope.
This time we looked at the basic properties and drawing methods of trend lines!
I love trend lines; I believe they are a core element of line analysis!
As with lines in general, drawing methods vary by person, and there is no absolute correct way. Rather than drawing haphazardly, consciously consider this role and property, and practice a lot in your own waypractice hardPlease!
Next time, we will look at the specific roles and uses of trend lines! Stay tuned!
If this article was helpful, please give a like or♡ to encourage me!
If you want to learn more practical and advanced line analysis from the basics, click here ↓
→The Essence of MTF Multi-Time Frame Analysis (Free trial version is also available)

【Limited-time opening campaign!】→ MMS Trading Encyclopedia—The truth behind the “structural traps” that individual investors fall into and Market microstructure analysis to glimpse the footprints of big players— (Free trial version is also available)