Utilization of the "Visualization Indicator" (Part 268)
“Visualization Indicator” Utilization(Part268)
1. Further evolving the “28 Currency Pair List Indicator” into an advanced indicator
“8CP Visualization Indicator”toUSDJPY Plot
The “8CP Visualization Indicator”hasOceania version, London version, NewYork version, and AnyCP versions.This time, I used the London version.
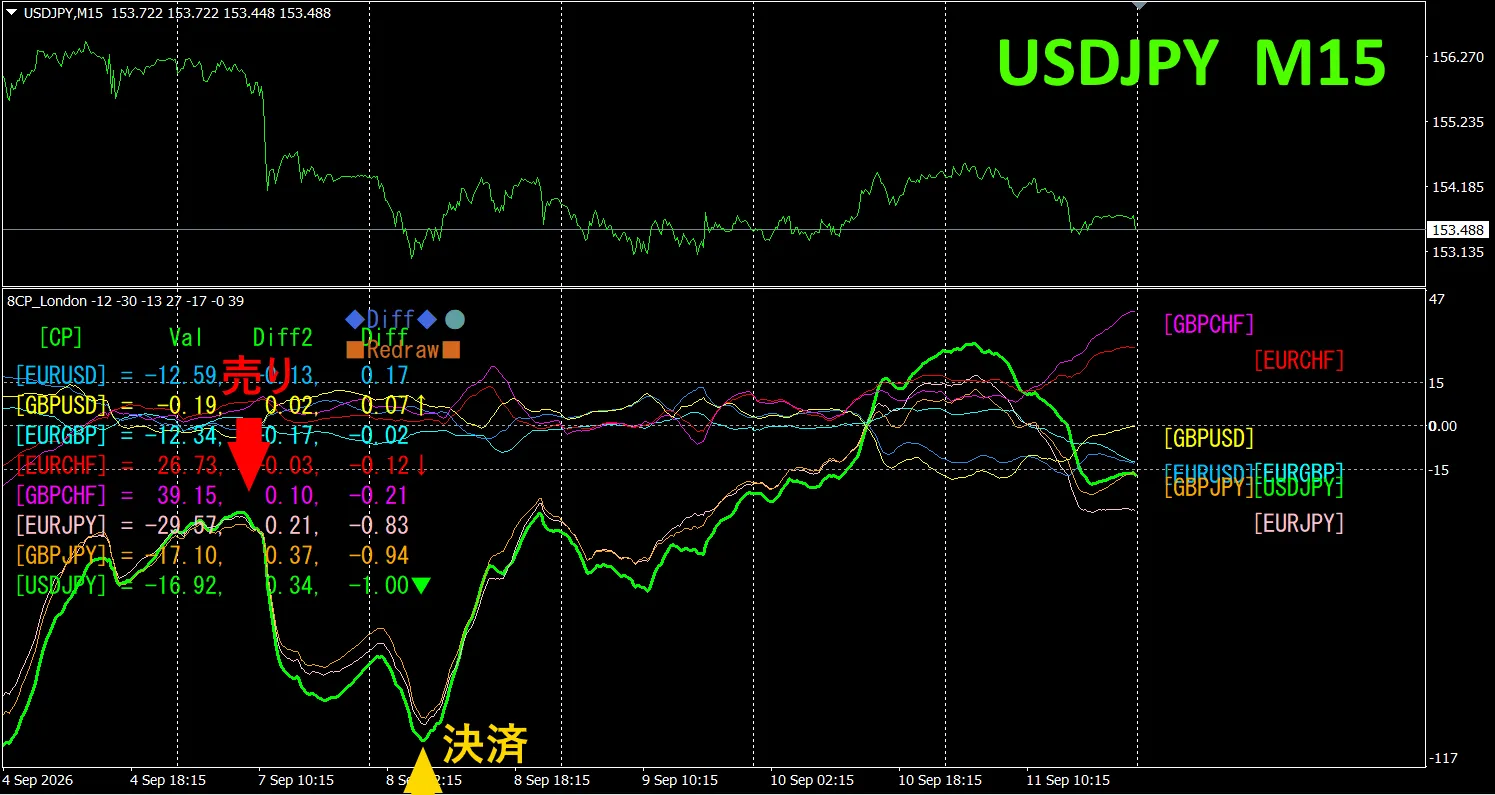
The upper half,USDJPYis a15-minute chart.The lower halfis from the “8CP Visualization Indicator”.,The bold green linegraphUSDJPYcorresponds to
On Monday,the USDJPY graph, which was originally positioned lower than the other graphsUSDJPYgraph,fell further at a steep angle,so I opened a sell position.On Tuesday, it reversed from the bottom, so I closed the position.About270pipsprofit was obtained.
Currency strength chart
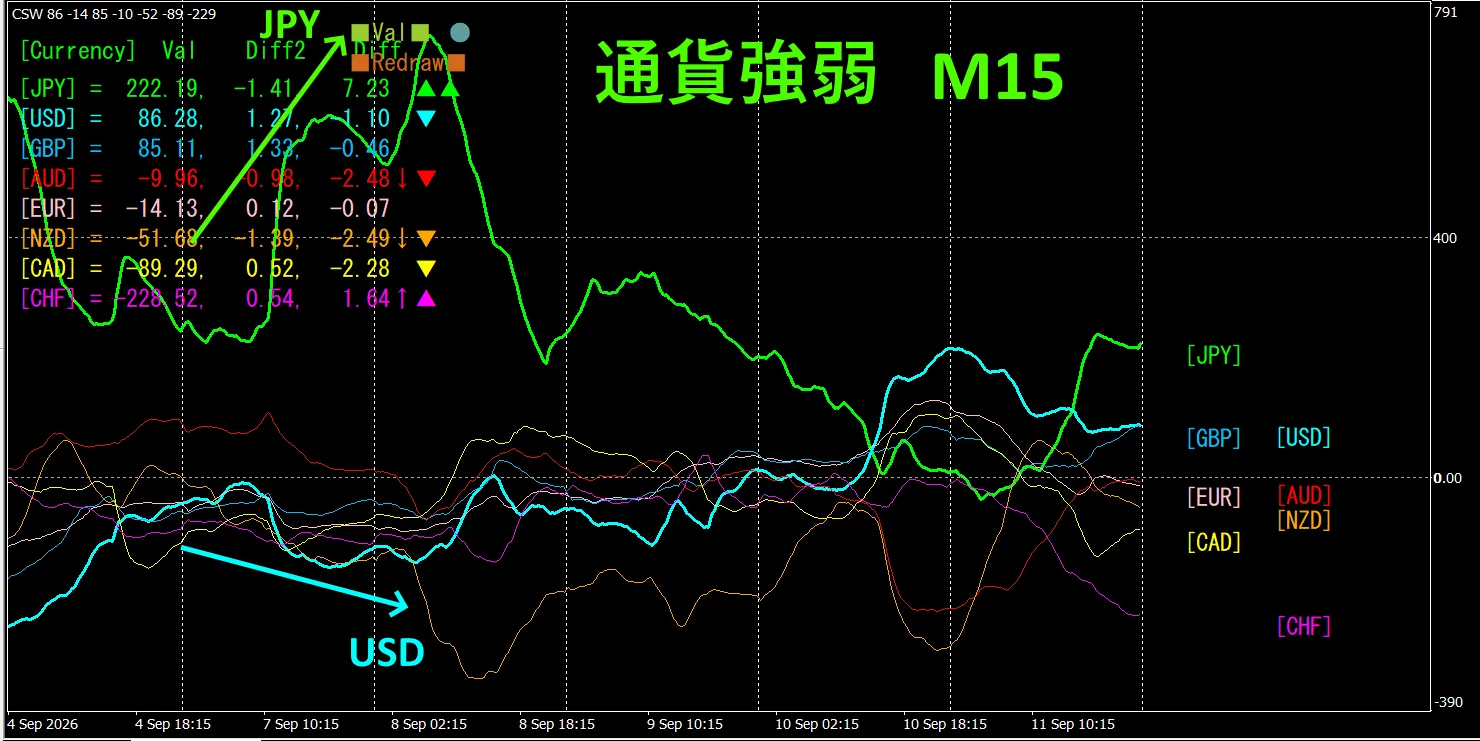
Looking at the15-minute currency strength chartJPYandUSDare,in an inverse correlation.JPYandUSDOnly trade the sections where they diverge and spread apartonly. JPY > USDtherefore,during the divergenceUSDJPYsellyou should trade by selling.Inverse correlationrelationshipSince they are in,we trade targeting only those points.
In FX,if you select the currency pairthat is currently extending the most,and is inversely correlated,results will naturally follow.
“Aim for inverse correlation in currency strength!”isan FXiron rule.
If you use “TrendLine-EX”,you can automate entries and exits on diagonal trendline breaks.Since you can leave it as is,it enableseasy,effortless trading. “TrendLine-EX”is,a semi-automatic EA,that can auto-sell on a trendline break belowEAand auto-close on a break above.
2. Try using the Best SelectIndicator
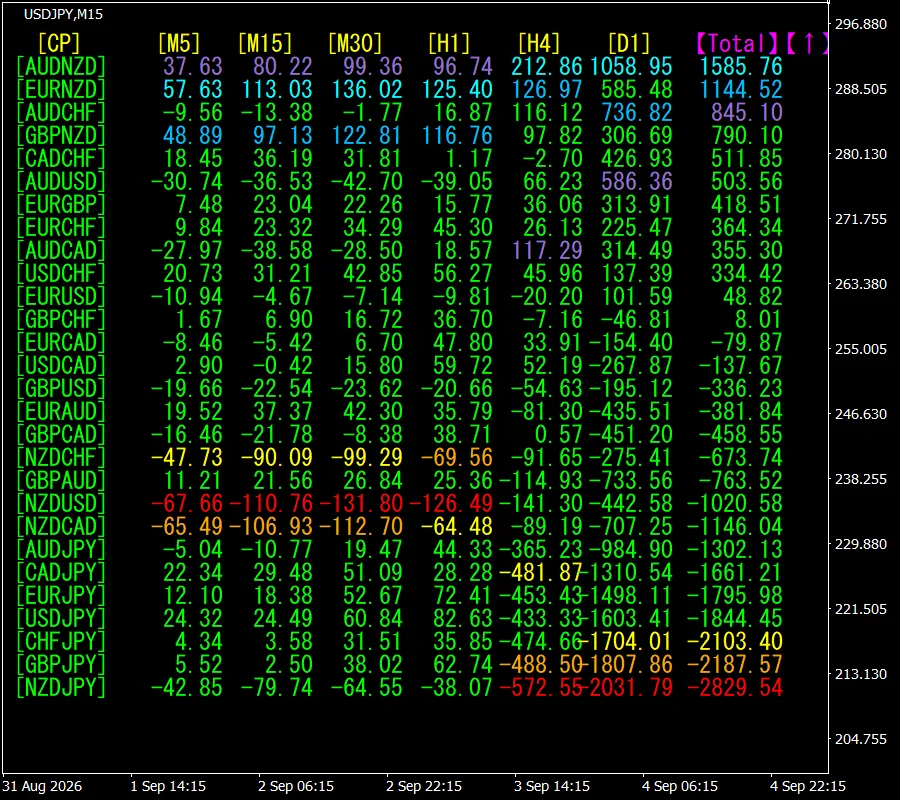
Thefigure belowis a screenshot from2026,September7th10:46(JST) ..
[Total]is sortedin descendingorder by value.At the top,AUDNZDis,displayed inbluetones across all timeframes. Totalvalueis1585.76and,it is a positivenumber.It suggests thatAUDNZDhas anuptrenddeveloping.
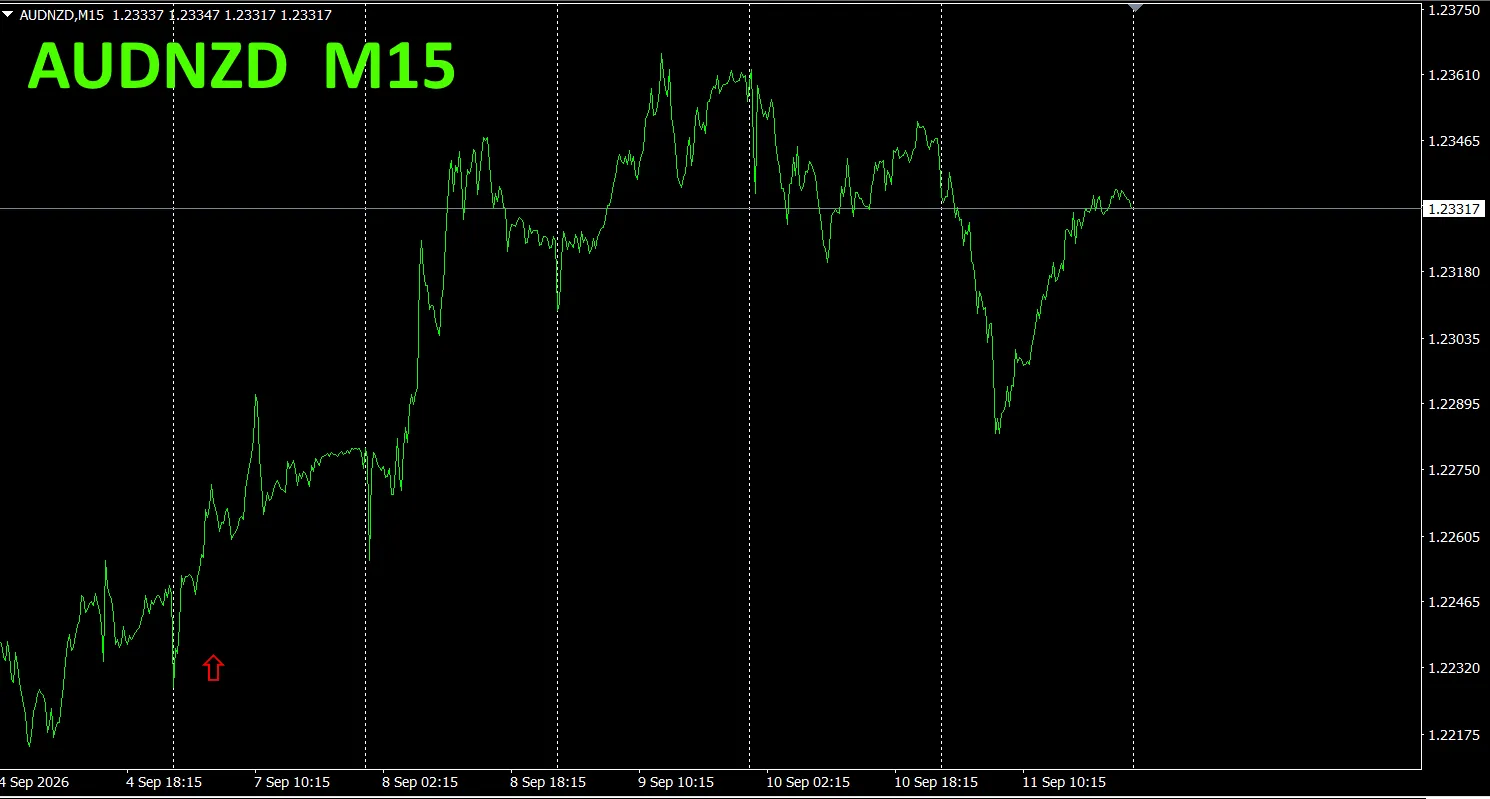
Now,let’s look at theAUDNZDchart.
The red arrow indicates where the screenshot was taken.It captures the portionthat is extending upward within an uptrend.
The “28 Currency Pair Best Select Indicator”can,among the 28 currency pairs,easily identify which currency is showing the strongest trend.Also,the “28 Currency Pair Divergence Comparison Indicator”will,among the 28 currency pairs,tell you thepair with the greatest divergence.From all currency pairs,you caninstantly judge which pair to tradeat a glance—an excellent indicator.
“28 Currency Pair Best Select Indicator”

https://www.gogojungle.co.jp/tools/indicators/35128
3. Since2021,May, trackingEURJPY—what happened to the movement?
Since2021,May, I have been tracking the movement ofEURJPY.
To see the overall flow,I plotted roughly the last3 weeks on a 30-minute chart.
Previously,I wrote as follows.
Pink isEUR,green isJPY..The vector ofEURwas,pointing slightly upward from horizontal,and the previously strongJPYturned down. From the currency strength chart, EURJPYwas,expected to rise going forward.
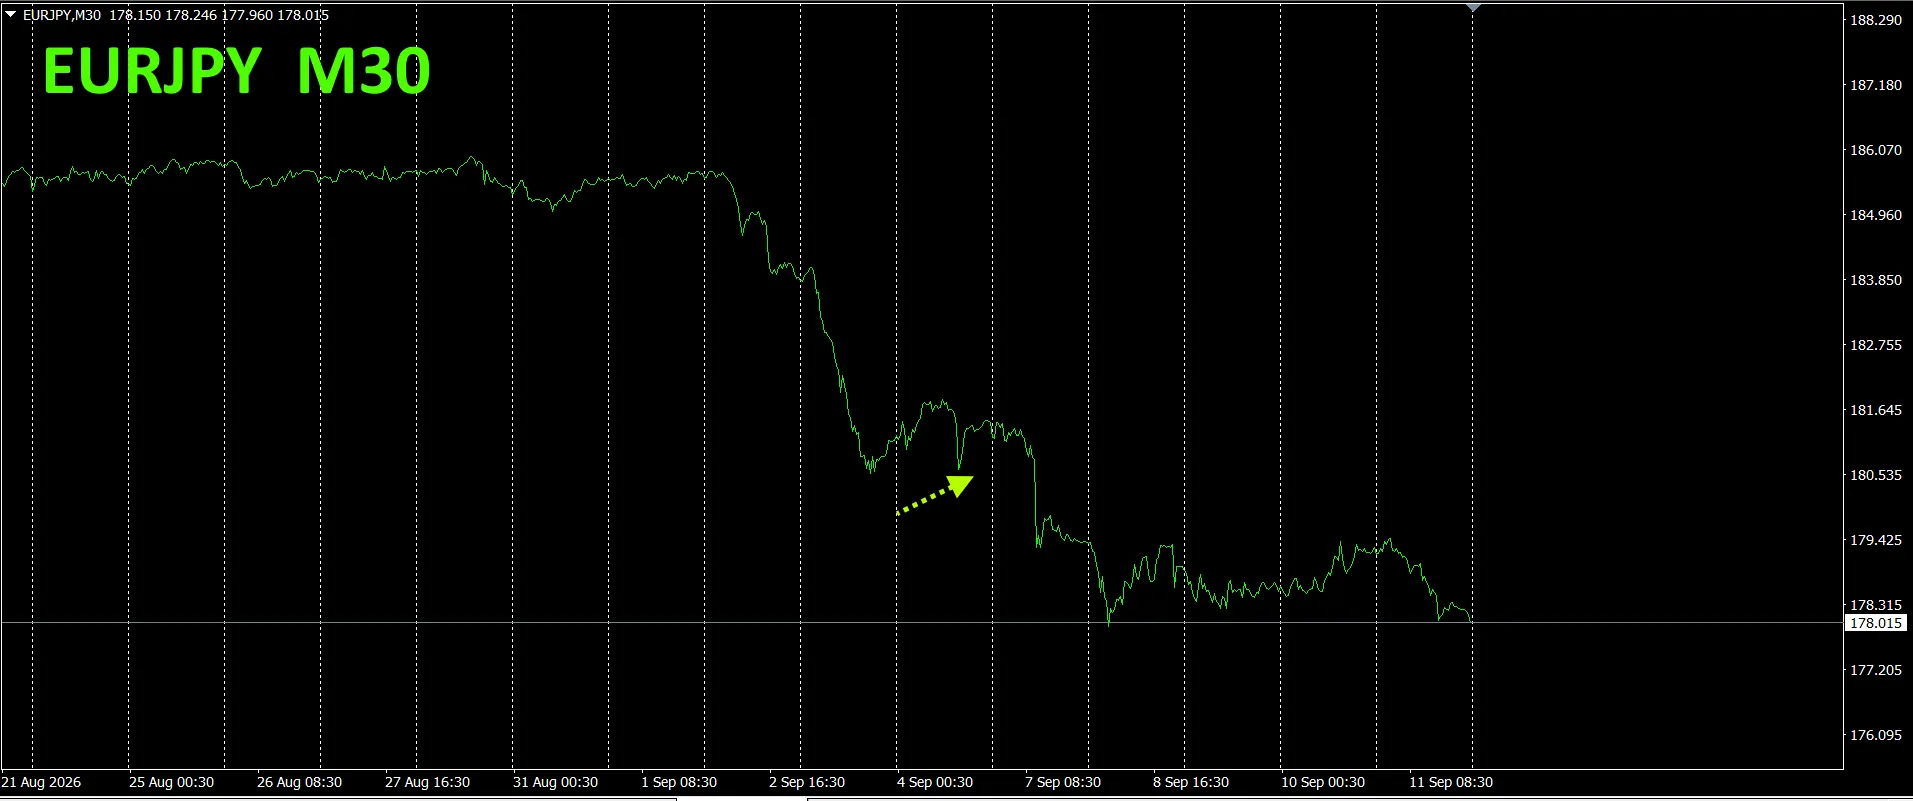
As a result of the yen strengthening, EURJPYfell.
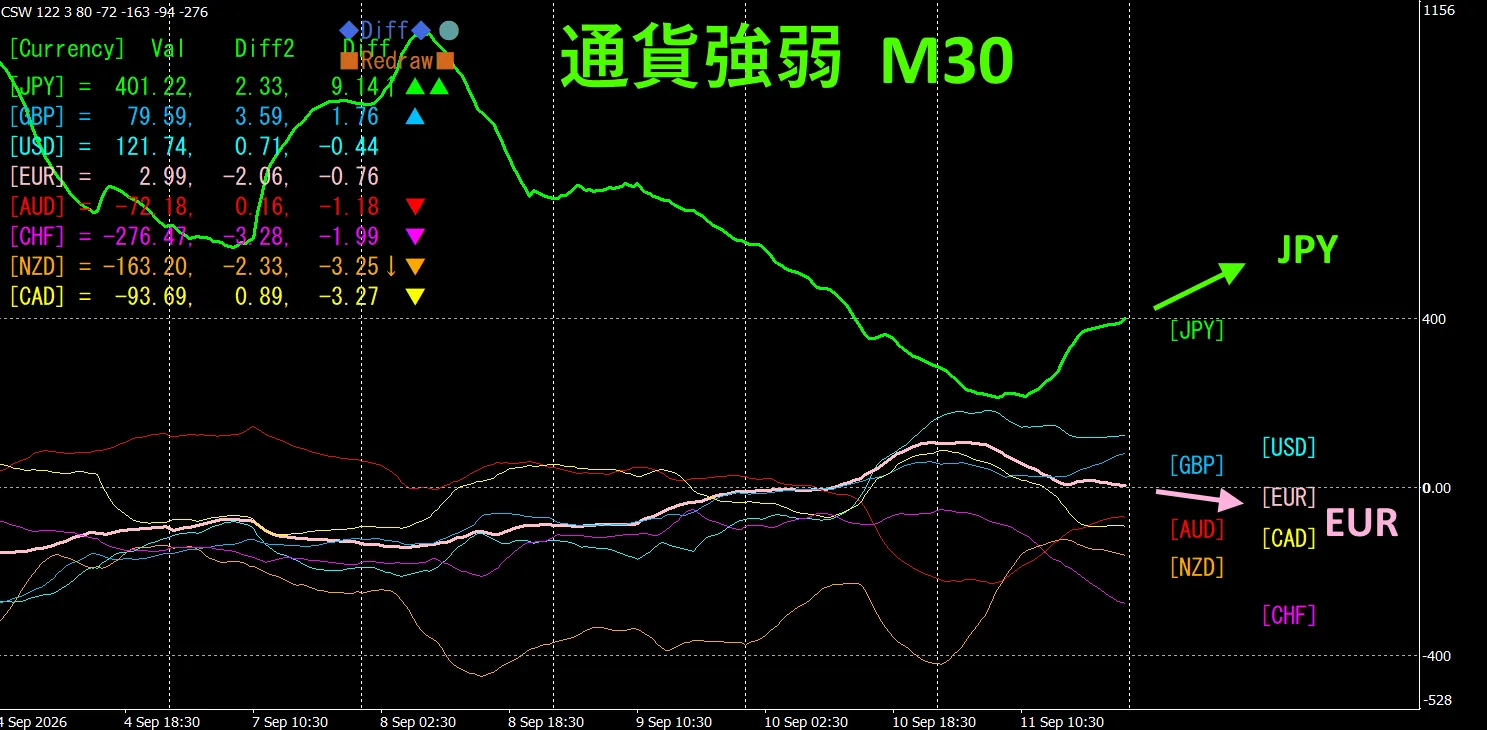
This is the30-minute currency strength chart.
Pink isEUR,green isJPY.The vector ofEURis,pointing slightly downward from horizontaland JPYis pointing upward. From the currency strength chart, EURJPYis,expected to decline going forward.
4. I tried using the new indicator Dual_MACD_Trend_Indicator
Please see the new indicator “Dual_MACD_Trend_Indicator” below.
MT4version:https://www.gogojungle.co.jp/tools/indicators/62199
MT5version:https://www.gogojungle.co.jp/tools/indicators/62202
This indicator clearly shows the trend direction using colors.If the color bar isLimeit’s a buy, Redit’s a sell,making it easy to understand for beginners.If the bar is green, it’s an uptrend,if red, a downtrend,and if there is no color, there is no trend.Because it’s color-displayed,you can grasp the trend state at a glance.
I introduced this indicatorto USDJPYon the1-hour timeframe.
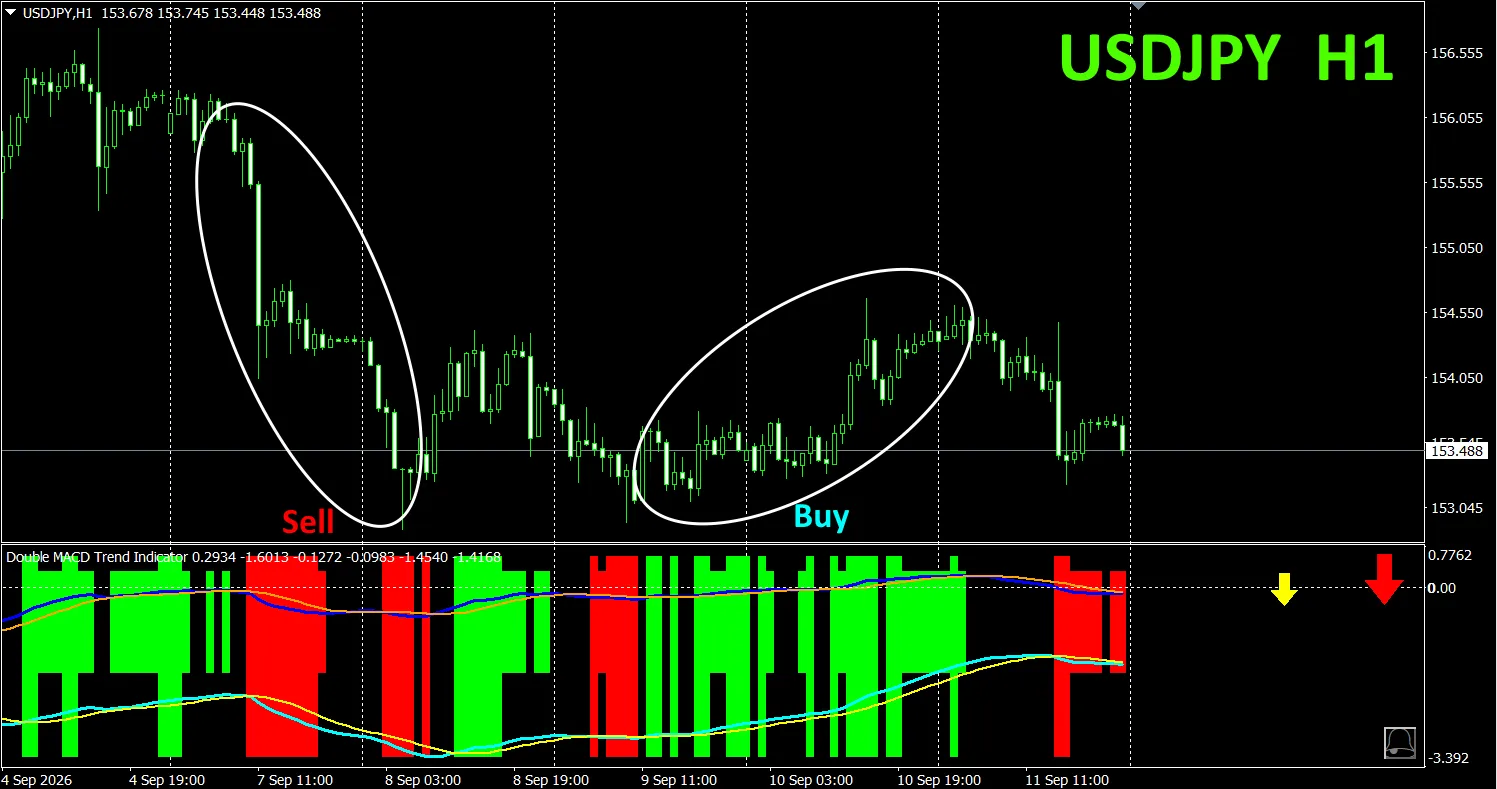
The red sell zone and,the green buy zone,are cleanly separated,making it easy to trade at a glance.In the figure above,focus on the sections where price moves up and down with a certain slope,sell in the areas surrounded by white ellipses where it’s red,and buy in the areas surrounded by white ellipses where it’s green.The slope of the indicator’s long-termMACDis also useful.If the long-termMACDis sloping down to the right, sell,if it’s rising to the right, buy.
With “Dual_MACD_Trend_Indicator”,you simply follow a straightforward rule: buy in green zones,sell in red zones,and do not trade otherwise.
With “Dual_MACD_Trend_Indicator”,you will no longer be confused about trade direction.
Furthermore,“Dual_MACD_Trend_Indicator”has been improved through an update,with a two-tier bar display2levels,and now shows the trend directions of the toptwohigher timeframes with arrows.
5. “Trend_Color_MA_MTF”has beennewlyreleased
From the sales page
“Trend_Color_MA_Dual_MTF”was,developed to transform your trading.This tool is not just a moving average.It visualizes trend direction“with color”,and the moment an opportunity arrives“with sound”and“notifications”alerts you,acting as your dedicated assistant..
As one example,on USDJPYthe1-hour chart, I simultaneously displayed the4-hour moving average.
The jagged, step-like lineis the4-hour moving average. 1-hour MAand the4-hour MA,are displayed in blue tones when rising,and in red tones when falling,so the trend direction of the current chart,and that of the higher timeframe,can be identified at a glance by color.
When the colors of the higher timeframe and the current timeframe align in the same tone,sell if they are red tones,buy if they are blue tones.
For a sell,when the 1-hourMAisredand falling, the 4-hourMAisorangeand falling—sell there.
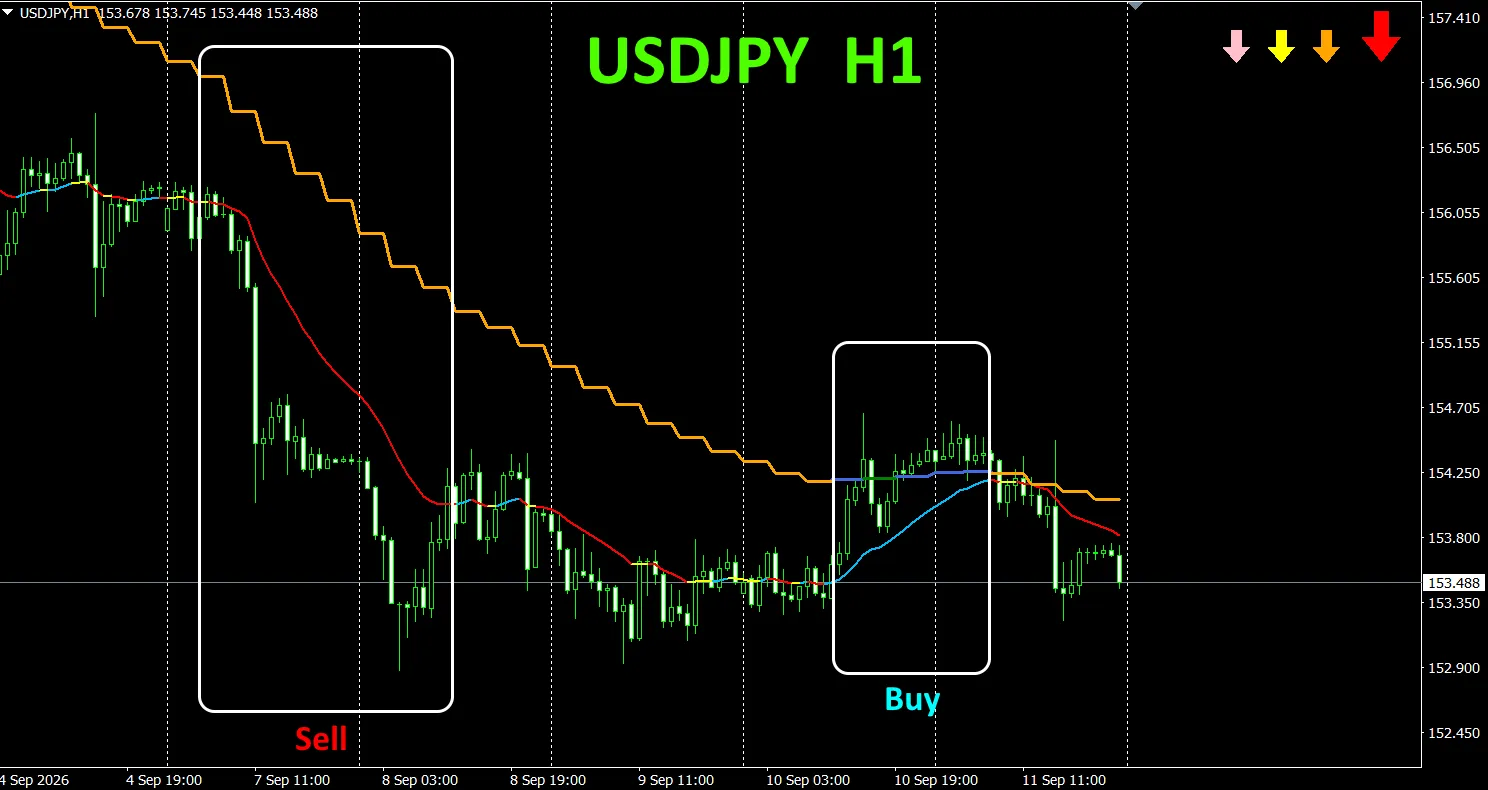
In the figure above,focus on the areas enclosed by white rectangles to trade sell/buy.
For details,please see the following link.
https://www.gogojungle.co.jp/tools/indicators/75985
“8CFD Visualization IndicatorAny version”
https://www.gogojungle.co.jp/tools/indicators/32288
“ToreTore Indicator”
https://www.gogojungle.co.jp/tools/indicators/50115
“TrendLine-EX”
https://www.gogojungle.co.jp/tools/indicators/42257
“8C Currency Strength Visualization Indicator”is,please refer to the page below.

MT4version https://www.gogojungle.co.jp/tools/indicators/39150
MT5version https://www.gogojungle.co.jp/tools/indicators/39159
[My listed products]