
9/12 Weekend USDJPY ABCD Analysis (Annual, 6-month, and 3-month charts also included)
In this article,as of the weekend of 9/12, we summarizedUSD/JPYfocused“ABCD analysis with the 20SMA (Yearly to 30-minute)”and“ABCD analysis with 20–400SMA (4-hour)”.
Main points
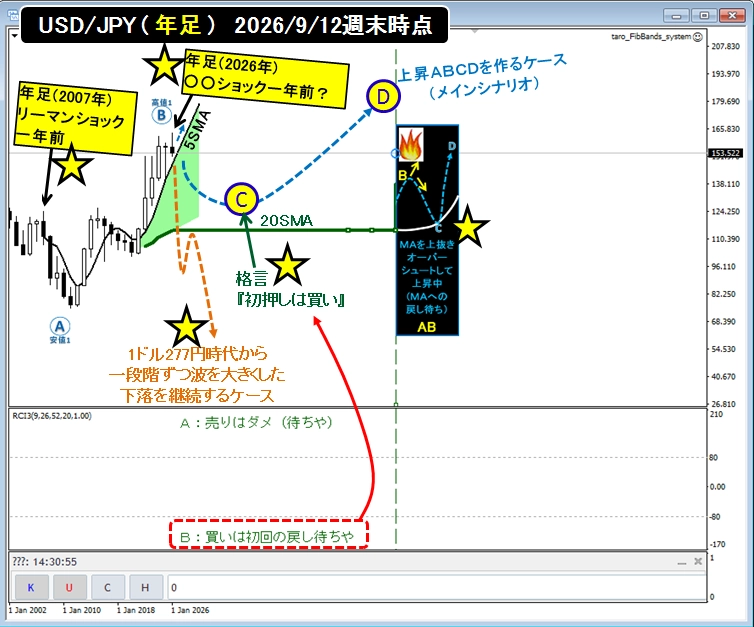
●ABCD analysis on the 20SMA for Yearly/6-Month/Quarterlywas added to the previous article.The Yearly is “overshooting and continuing to rise”and“If it breaks below +1σ at year-end, there are two cases: after returning to the Yearly 20SMA it resumes higher to make new highs, or it follows price action similar to the Lehman Shock breaking the prior low (a continued decline where each wave grows one step larger since the 1 USD = 360 JPY era)”as can be seen.
●After the week opens,one scenario is a 4H red ② 50SMA bearish ABCD that keeps below the 5/13/20SMA, breaks point B, and completes the bearish ABCD, andanother is to sequentially break above the 5/13/20SMA, form a blue ① bullish ABCD, then set a green ③ high near the underside of the green 100SMA, followed by forming a green ③ bearish ABCD. We planto follow the 4H 5SMA → 13SMA → 20SMA in that order and go with the direction that price reacts to after the week opens.
Reference articles
●Example of ABCD analysis with the 20SMA →This article
●Example of ABCD analysis with 20–400SMA (Soccer-player linkage chart) →This article
●Six years of two-way trading (ended on a break of 155.22) →This article
●Comparison of one year before Lehman Shock vs now (about 4x scale) →This article
●Falling while enlarging waves from 1 USD = 360 (277) JPY →This article
USD/JPY (Yearly) ABCD analysis with 20SMA
●On the Yearly, we are progressing through a bullish AB,with candle bodies (closes) holding above the 5SMA and +1σ, overshooting and rising—that is the current stage.
●We do not know how far it will rise, butfor example, if at year-end it breaks below +1σ and the turning-down green 20SMA area C becomes a dip to buy, price could break above point B and rise to point D to form a bullish ABCD.
(Assuming the saying“Buy the first pullback”)
●However,if it goes on to break down through the green 20SMA,thenwe anticipate a decline that breaks the USD/JPY all-time low as shown by the orange dotted path,a drop about four times (≈4.147x) the magnitude of the Lehman Shock bear move. (From the 1 USD = 360 and 277 JPY eras, USD/JPY has been forming a downtrend while increasing wave size step by step, and measured from 277 JPY the current area is around (slightly above) the 38.2% retracement acting as a return-to-sell zone while the downtrend forms
●Ifprice moves the same as one year before the Lehman Shock, the 2026 yearly candle could resemble 2007’s. Comparing the prior candle, it formed a long lower-wick candle,which feels somewhat similar. In 2007 the yearly candle formed a bearish candle with a lower wick, with the body (close) holding above the 5SMA. If 2026 forms similarly, it might first dip below the yearly 5SMA, then by late December return to around the yearly 5SMA where the 2026 yearly candle finalizes—is that the image?
(If many traders see it as similar to the year before Lehman and trade while comparing charts, their actions could nudge price to move that way—but take this as half talk—no, more like 1/1000 of it (^^))
USD/JPY (6-Month) ABCD analysis with 20SMA
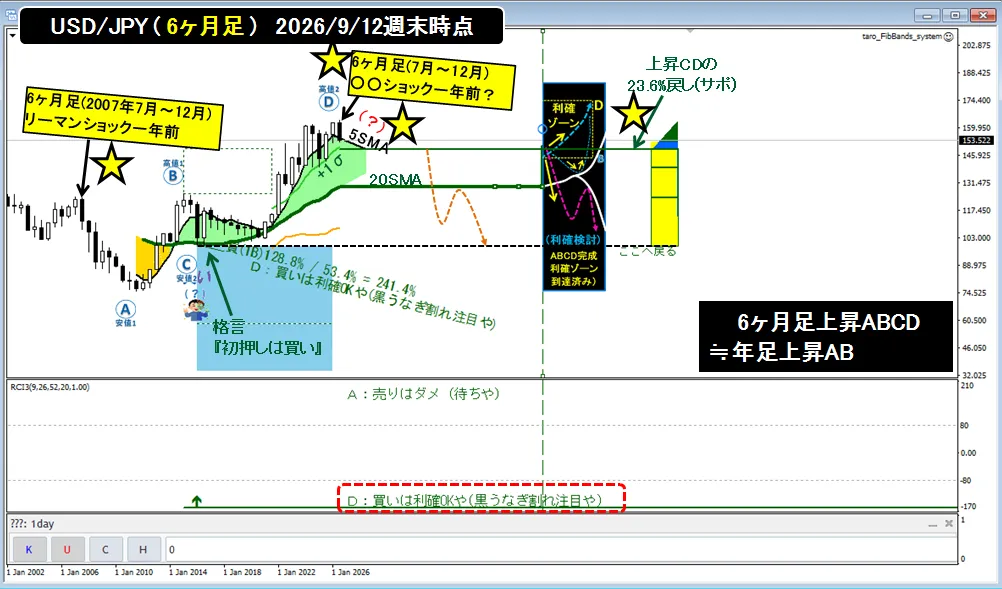
●On the 6-Month, after completing a bullish ABCD, closes are holding above the 5SMA/+1σ/23.6% retracement (support) of the bullish CD, overshooting and rising (corresponds to the Yearly bullish AB).
●We do not know how far it will rise, but if closes break below the 5SMA/+1σ/23.6% retracement (support) of the bullish CD and hold the lower zone, profit-taking on long positions from point C will accelerate and a decline in a bearish ABCD toward point C is anticipated (corresponds to Yearly BC).
●Compared with the candle one year before the Lehman Shock, the timing matches July–December, andone year before Lehman a bearish engulfing candle formed; we will check at year-end whether the current 6-Month also forms an engulfing candle.
USD/JPY (Quarterly) ABCD analysis with 20SMA
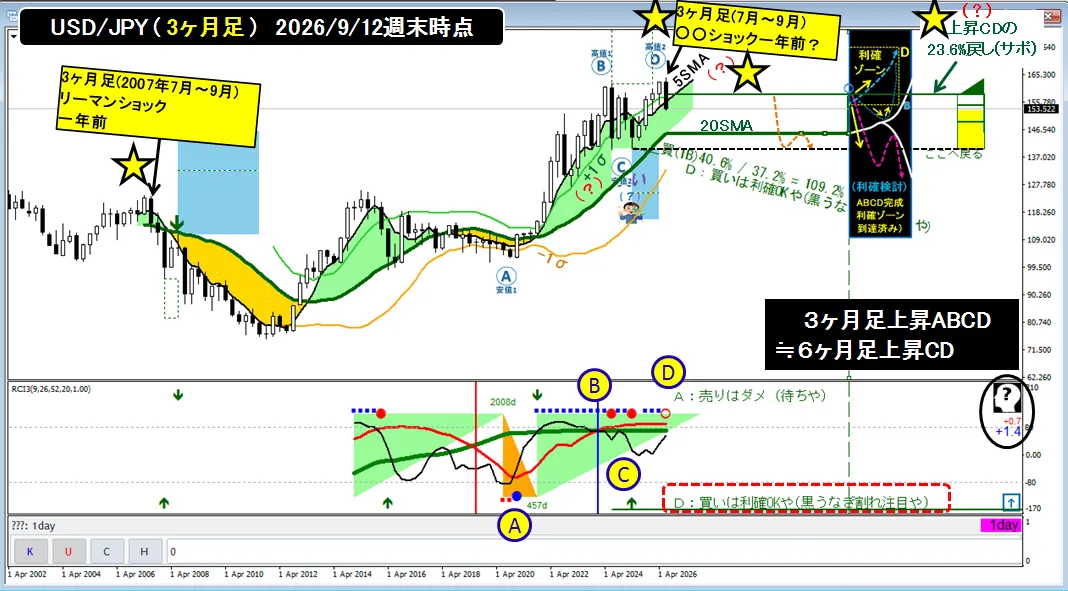
●On the Quarterly, after completing a bullish ABCD, current price has entered the lower zone under the 5SMA/+1σ/23.6% retracement (support) of the bullish CD. (Corresponds to the 6-Month bullish CD)
●By the Quarterly close at end-September,ifcloses hold below the 5SMA/+1σ/23.6% retracement (support) of the bullish CD, I think the probability increases for a bearish ABCD to form and price to return to the bullish point C (corresponds to the 6-Month bullish ABCD → point C).
●If, by the Quarterly close at end-September, price holds the upper zone, I will consider the uptrend to continue until it breaks down (corresponds to the 6-Month ABCD).
●Compared with the candle one year before the Lehman Shock, the timing matches July–December,and if it moves the same, price would dip below the Quarterly 20SMA during September, then by the September close the close would hold back above the Quarterly 20SMA.
USD/JPY (Monthly) ABCD analysis with 20SMA
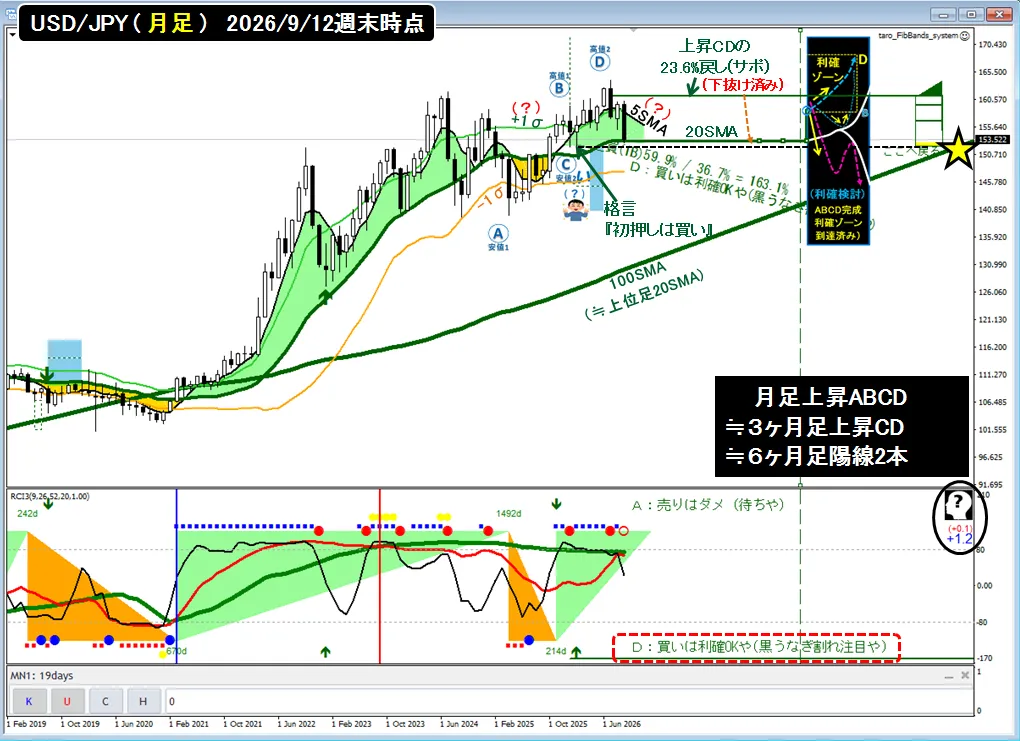
●On the Monthly, from point (A) where candles were capped under the green 20SMA, price broke above the green 20SMA and +1σ to overshoot at (B), then dipped below +1σ and returned toward the green 20SMA, and after breaking above (B) to (D),it completed a bullish ABCD. (Corresponds to the Quarterly bullish CD)
●Traders buy (long) from point (C), butat (D), when the close falls below the black 5SMA bullish CD 23.6% retracement (support) line, flipping it to resistance, more traders start taking profit. Thenonce everyone takes profit, price returns to point (C),margin returns to the traders’ hands,and the trade sequence is completed.
●The basic flow is (A) → (B) → (C) → buy (long) → (D) → take profit → (C).After margin returns to the trader at point (C),the trader regains margin capacity to move the market up and down by the (C)→(D) range.
●The assumed trader behavioris:enter at (C),take profit somewhere around (D),after price returns near (C),depending on conditions then, either enter at (C) on a one-step higher moving average, or,before returning to (C), flip (reverse) and enter when an opposite-direction (C) appears on one’s moving average.
●Looking at the current (D)→(C) pullback,it has returned right to around the Monthly 20SMA,and the yellow fill still remains.Here you can see traders who haven’t taken profit yet trying to add longs and push to new highs.
●If everyone takes profit and it returns to (C),the candle body (close) would slip under the green 20SMA,so we can see that (C) lies where traders who still haven’t taken profit will likely give up and exit their profitable positions.
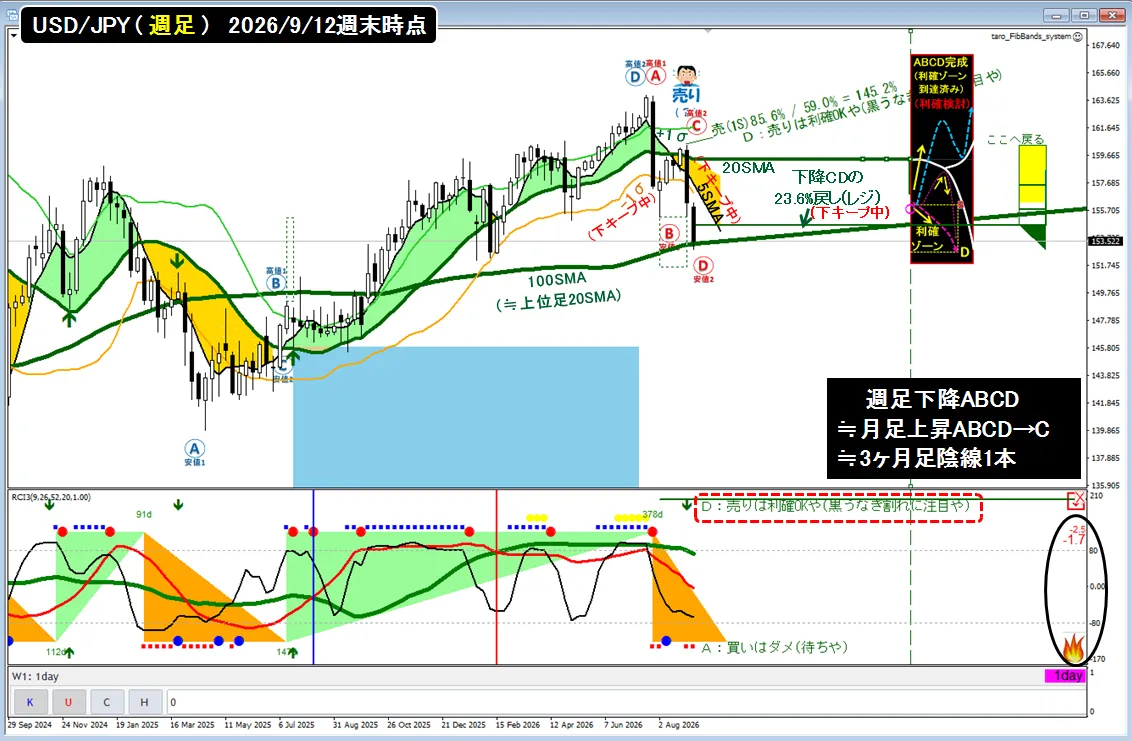
USD/JPY (Weekly) ABCD analysis with 20SMA
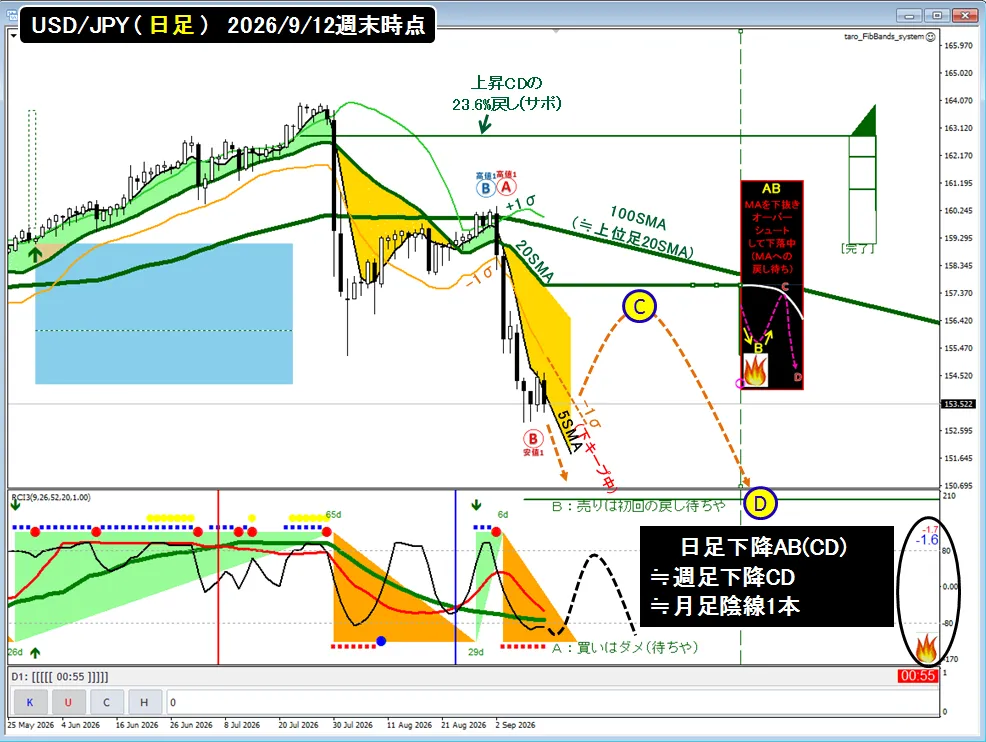
USD/JPY (Daily) ABCD analysis with 20SMA
USD/JPY (4-Hour) ABCD analysis with 20SMA
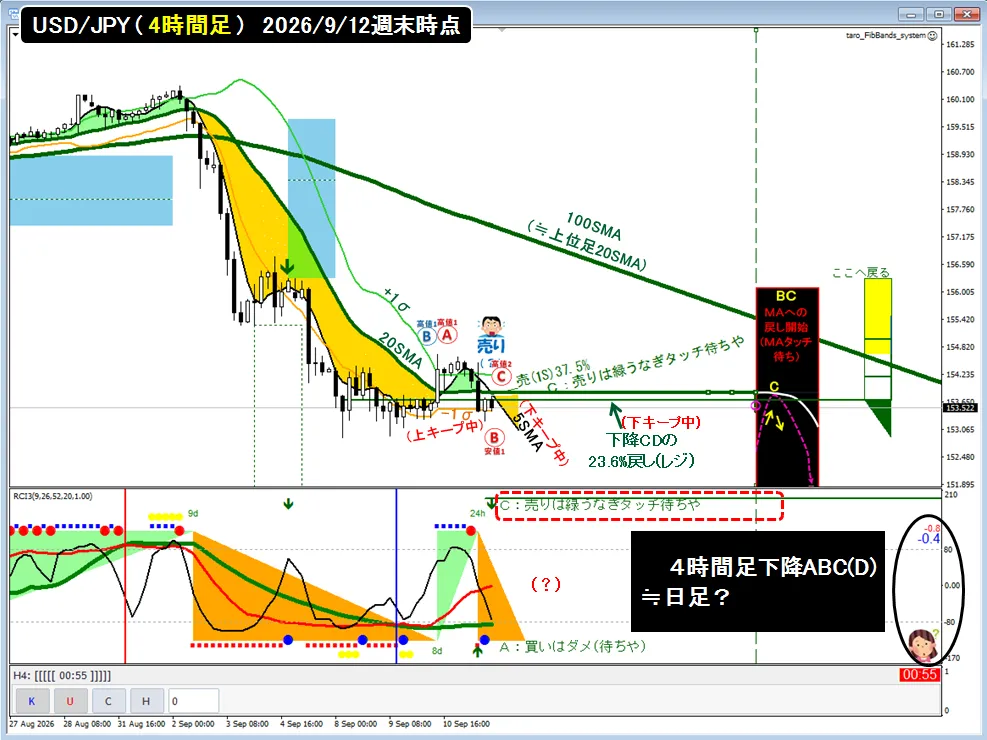
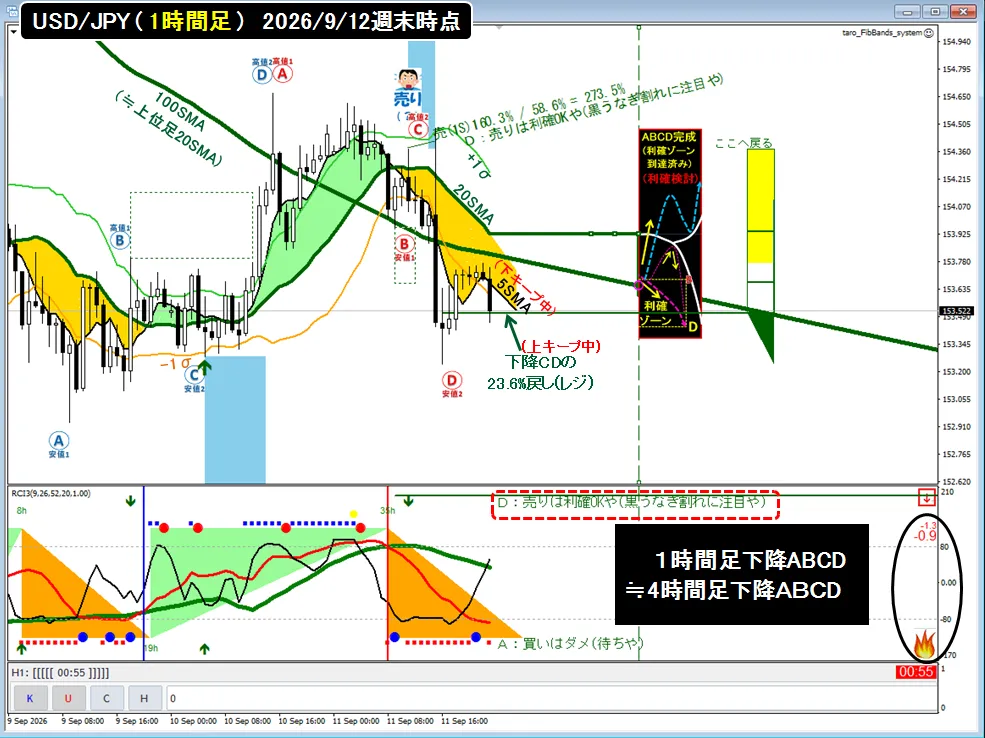
●On the 1-Hour chart,a bearish ABCD has formed. (Corresponds to the 4H bearish AB)
●Currently, although price has broken below the black 5SMA and -1σ, it also looks like it is trying to hold the upper zone above the 23.6% retracement (resistance) of the bearish CD and flip it to support; it seems we should wait for that battle to resolve.
●If it breaks higher, we anticipate a profit-taking return move to the bearish C entry (short entry) area.
USD/JPY (30-Minute) ABCD analysis with 20SMA
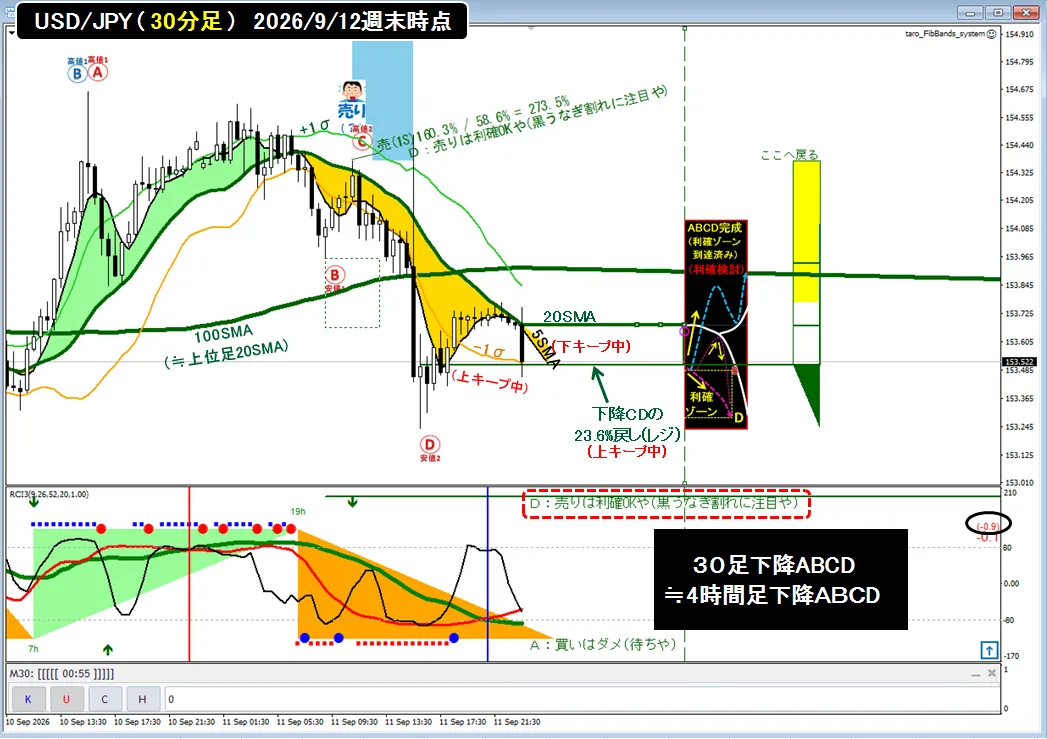
●On the 30-Minutechartas well,a bearish ABCD has formed. (Corresponds to the 4H bearish AB)
●Currently, although price is below the black 5SMA, it seems to be trying to hold the upper zone above -1σ and the 23.6% retracement (resistance) of the bearish CD to flip them to support; it looks like we should wait for that battle to resolve.
●If it breaks higher, we anticipate a profit-taking return move to the bearish C entry (short entry) area.
USD/JPY (4H) ABCD linkage analysis with 20/50/100/200/400SMA
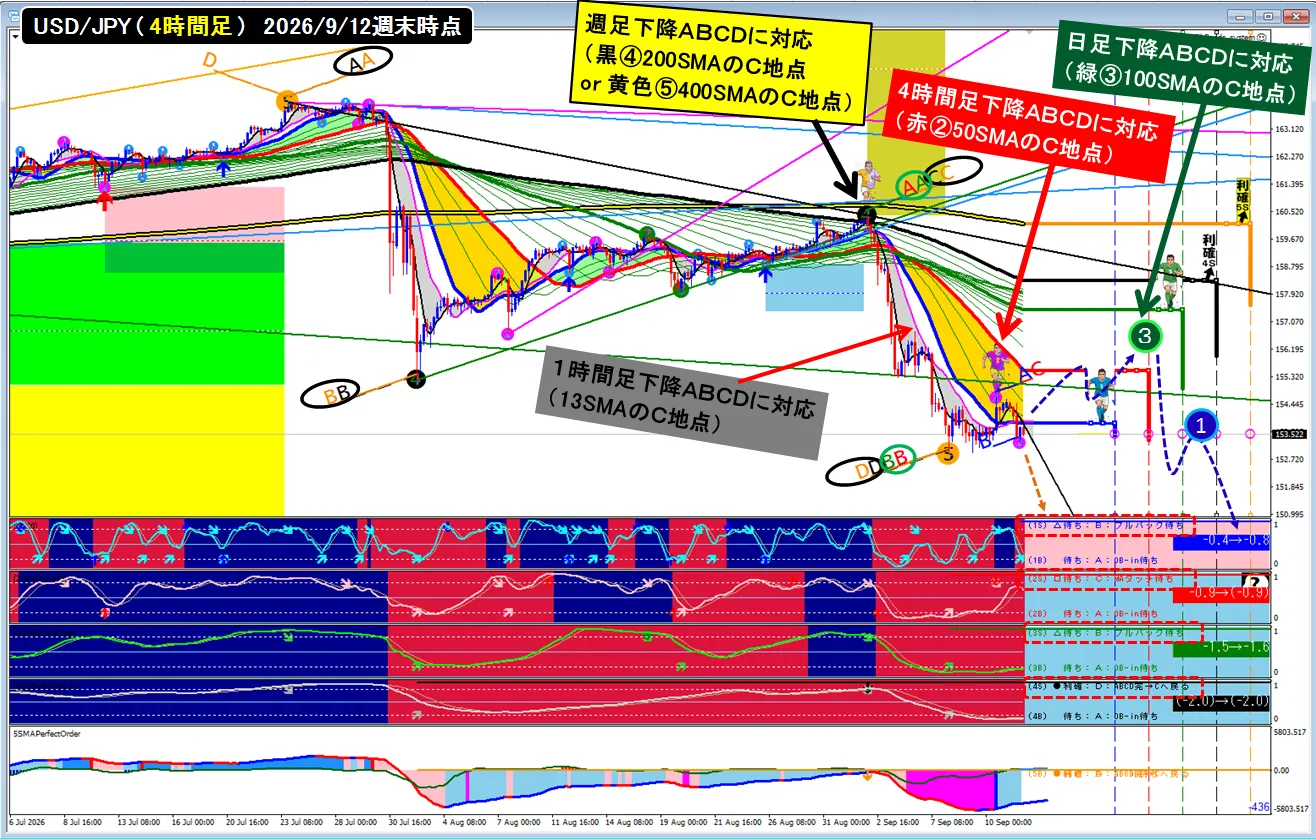
●The chart above is aUSD/JPY (4H) ABCD linkage chart with 20/50/100/200/400SMA.
●A decline using the return-to-sell around the yellow ⑤ 400SMA or black ④ 200SMA as point Ccorresponds tothe Weekly 20SMA bearish ABCD,
●A decline using the return-to-sell around the green ③ 100SMA as point C (not yet formed; expected)corresponds tothe Daily bearish ABCD,
●A decline using the return-to-sell around the red ② 50SMA as point Ccorresponds tothe 4H bearish ABCD.
●Thinking of price action asJapanese national soccer team players linking upcan make it intuitive: from the AA top to BB, after sending the ball down, Aoshima using the blue ① 20SMA line, Akahoshi using the red ② 50SMA, and Midorikawa using the green ③ 100SMA return the ball to the waiting Ougon (yellow ⑤ 400SMA) or Kuroda (black ④ 200SMA) around point C, and under the direction of playmaker Kuroda using black ④ 200SMA via yellow ⑤ 400, Aoshima ① (blue), Akahoshi ② (red), and Midorikawa ③ (green) each try to break the black ④ low by forming their respective bearish ABCDs. (Each color’s ABCD is depicted,and each player receives the ball at his color’s C from point B, then passes/shoots/dribbles to D beyond B.This corresponds to FX “first pullback buy” or “first rebound sell.”)
●Currently,it is attempting to form a red ② 50SMA bearish ABCD,after the week opens,we will watch whether holding below the 5SMA/13SMA/20SMA leads to breaking the yellow ⑤ low and forming the red ② 50SMA bearish ABCD.
●If the close breaks above the blue 20SMA and above the +1σ of the 20 Bollinger Band,as in the blue dotted path, we will watch whether a blue ① bullish ABCD sets a green ③ high below the green 100SMA, and then within the green ③ 100SMA bearish ABCD, a blue ① bearish ABCD forms and price falls.
Lastly
●There is a method of ABCD analysis using only the 20SMA across timeframes, anda method of analyzing multiple moving-average ABCDs in a single chart in a linked manner,each with its pros and cons.
●Broadly, there seem to be two “factions” of traders:those who use the 5/20/100/400SMA waves, andthose who use the 10/50/200/800SMA waves. When analyzing with only the 20SMA, the 50SMA-type waves can make things confusing when they appear,but when the market aligns so that these different waves point the same way, we can trade without minding the differences, and everyone can have enjoyable trading—that’s how it feels.