
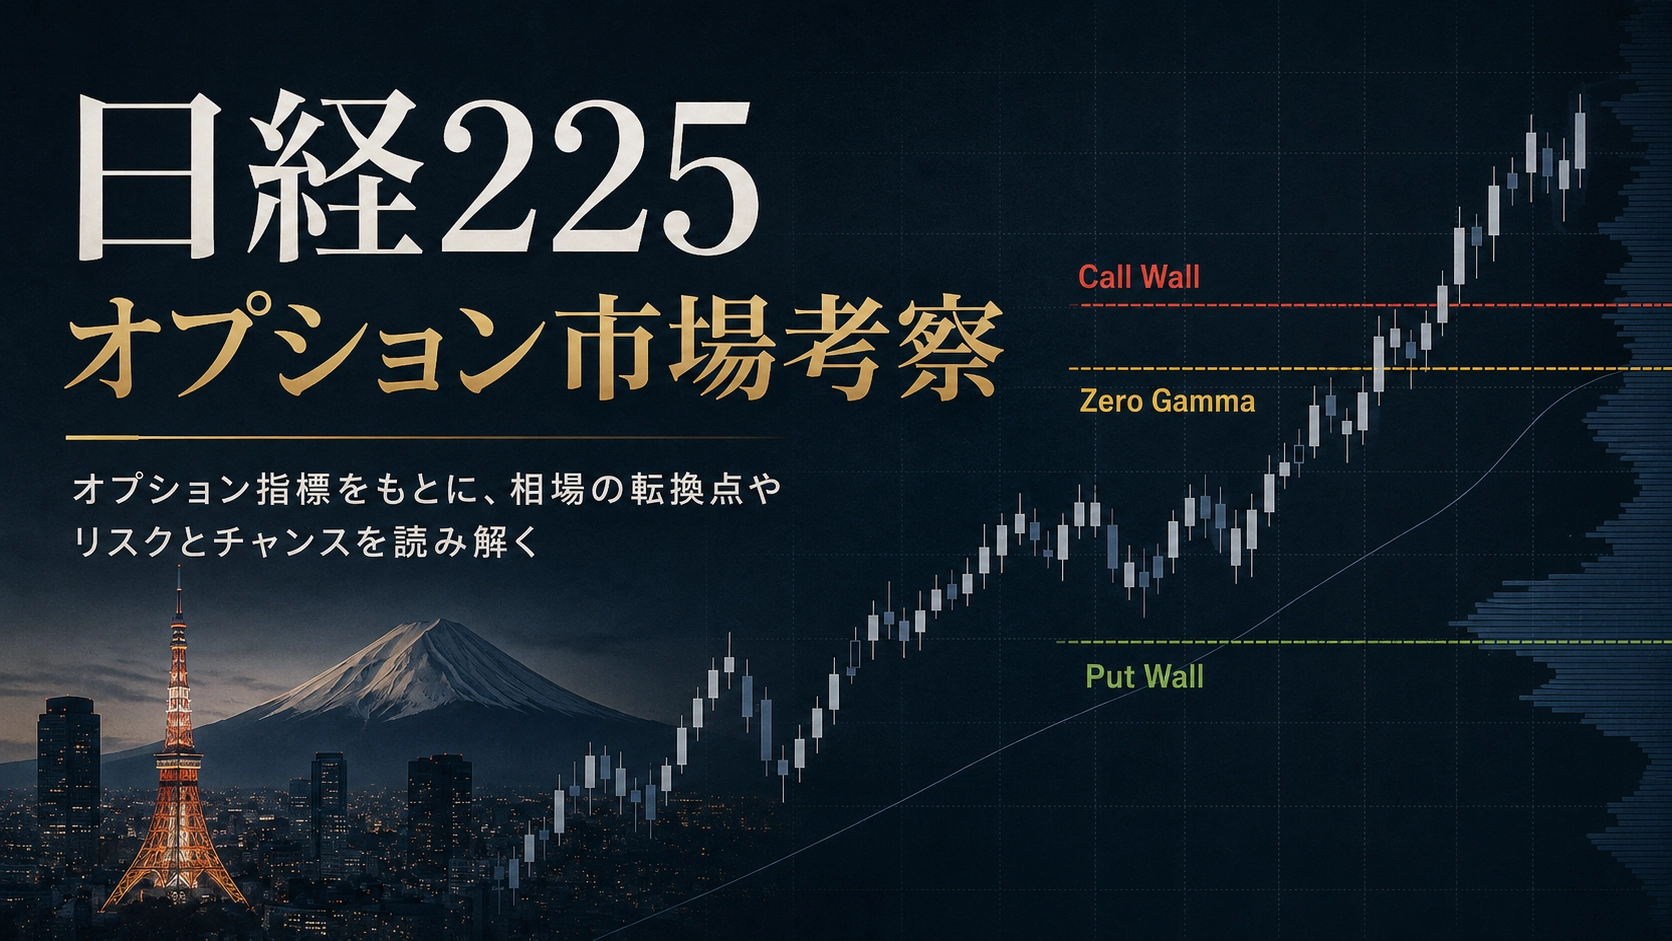
NK225 OPTION MONITOR — DAILY MARKET STRUCTURE 20260911
Today, the main focus shifts to the October 2026 expiry. Open Interest (OI), Wall, and OI center are evaluated using the October expiry history. For IV and Skew, because the headline on the previous business day was for the September expiry, there is no one-day comparison.NO_SAME_EXPIRY_PREVIOUSto be treated as.
| Judgment Item | Judgment | Key Points |
|---|---|---|
| Option Bias | Neutral 6/10 | Score -3.5, near bearish threshold of -4. Deep Put Building, decline in Call OI Center, and heavy Wall Building on both sides. |
| 15-minute MTF Price Structure | Short-term rebound; higher timeframe is downward | Rebounded from 62,880 to 64,340, but higher-timeframe declining MA bands and past high structures have not recovered. |
| Overall Direction | Dominantly bearish (during a short-term rebound) | Option bias is leaning bearish (Neutral). Price is well below Zero Gamma; higher timeframes also downward. Until 64,340 is broken, selling on rallies remains favored. |
| Gamma Environment | Expanding type | Total GEX -55.93, NEGATIVE GAMMA. Watch for widened price ranges after directional determination. |
Option Bias for October expiry is Neutral, but the Score is -3.5, approaching the bearish side. As of 20:51 futures stand at64,110, about 2,795 below Zero Gamma 66,905. A rebound from 62,880 is observable, but until 64,340 is broken and held, the rebound should be treated as“a pullback within a downtrend”and overall remains selling-favored.
| Item | Value | Assessment |
|---|---|---|
| Nikkei 225 Cash | 64,011.34 | JPX Daily Data Basis |
| Nikkei 225 Futures | 63,960 | Futures value basis of JPX daily data |
| Odds as of 20:51 Futures | 64,110 | about +150 from daily futures value |
| ATM Strike | 64,000 | October expiry / DTE 28 |
| Call Wall | 66,000 | BUILDING |
| Put Wall | 63,000 | BUILDING |
| Zero Gamma | 66,904.90 | about +2,795 from current price |
| Total GEX | -55.93 | NEGATIVE GAMMA |
For October expiry, Put Wall is 63,000 and Call Wall is 66,000. The current price of 64,110 lies between the two walls, but Zero Gamma sits far above at 66,905. Therefore the current price range is clearly under Zero Gamma, and the Gamma environment is expansionary.
| Strike | OI | 1D | 3D | 5D | Volume | Assessment |
|---|---|---|---|---|---|---|
| 64,750C | 755 | +754 | +755 | +755 | 758 | Large-scale new Building |
| 65,000C | 644 | +221 | +282 | +283 | 473 | Nearby Call Building |
| 66,000C | 2,109 | +886 | +900 | +924 | 1,186 | Call Wall Building |
| 67,000C | 1,467 | +128 | +277 | +942 | 266 | Upper Wall Building |
| 69,000C | 3,077 | +126 | -7 | +124 | 337 | High-level Call OI |
The most noticeable are 64,750C +754 and 66,000C +886. Close to the current price, 64,750–65,000 and the Call Wall at 66,000 have concentrated new formations. Call OI also spreads beyond 66,000 to 67,000 and 69,000, forming multiple Call bands upward.
Call Wall is66,000 / BUILDING. 66,000C has OI 2,109, 1D +886, volume 1,186. When combined with 64,750C +754 and 65,000C +221, the first Call Zone is64,750–66,000to be evaluated as.
From the current price of 64,110, 64,750 is the first upper judgment band. Followed by 65,000 and 66,000 Call Walls, expect to observe upward responses step by step during rebounds. Walls are not fixed resistances.
| Strike | OI | 1D | 3D | 5D | Volume | IV |
|---|---|---|---|---|---|---|
| 65,000P | 2,026 | +110 | +273 | +239 | 158 | 26.75% |
| 64,000P | 1,772 | +46 | +393 | +475 | 174 | 27.93% |
| 63,000P | 2,198 | +930 | +1,078 | +1,564 | 1,110 | 29.03% |
| 61,000P | 1,162 | +527 | +539 | +327 | 924 | 30.75% |
| 60,000P | 10,976 | +34 | +2,078 | +4,047 | 2,066 | 31.30% |
| 58,000P | 2,180 | -280 | -437 | -51 | 584 | 33.87% |
Near-Market P/C OI Ratio: 2.248(Compared to the same expiry data 2.549 previously)
Near-Market P/C Volume Ratio: 1.319
Call Near-Market OI Center:67,582.11(1D -326.89 / 3D -339.36 / 5D -325.63)
Put Near-Market OI Center:61,686.64(1D +23.86 / 3D +94.01 / 5D -37.70)
ATM Average IV:27.45%
Put Skew:+1.39pt
Call Skew:-0.67pt
Total GEX:-55.93 JPY bn / 1%
Gamma Regime:NEGATIVE GAMMA
Zero Gamma:66,904.90
| Strike | Net GEX | Assessment |
|---|---|---|
| 60,000 | -23.50 | Largest Negative GEX |
| 63,000 | -6.73 | Near Put Wall |
| 64,000 | -4.94 | Near current price |
| 65,000 | -4.73 | Negative GEX continues |
| 66,000 | +3.39 | Positive toward Call Wall vicinity |
| 69,000 | +6.21 | Positive GEX |
The current price 64,110 sits in the Negative GEX zone of 64,000–65,000. Negative Gamma is not bearish in itself but tends to amplify price moves after a direction is determined. If 63,000 Put Wall is broken downward, expect expansion downward; if 64,340 is broken to the upside and holds, watch for acceleration upward.
We do not use the SW1/SW2/SW3 table on the bottom right; judgments are based on the actual swing structure visible on the chart and the displayed MAs.
| Timeframe | Judgment | Rationale |
|---|---|---|
| 15 minutes | Rebound upward | From 62,880, lows and highs were climbed to 64,340; as of 20:51 price is adjusting toward 64,110. |
| 1H-equivalent | Transitioning | Recovery after a sharp drop is clear, but hasn’t fully recovered the higher-timeframe downward MA band and previous retracement highs. |
| 4H-equivalent | Downward continuation | Below a large downward MA band, hasn’t recovered past structures above 64,890–65,000. |
In 15 minutes, rebound is favorable, but 1H is transitioning and 4H is downward. Therefore not a clear buying edge; currentlyshort-term rebound in a downward trendis to be treated as.
- 64,750C +754 and 66,000C +886 show large Building on the Call side.
- 63,000P +930 and 61,000P +527 show new formation on Put side.
- 60,000P OI 10,976, 3D +2,078, 5D +4,047 and substantial remaining balance.
- Call OI Center moved downward by about 300 yen across 1D, 3D, 5D.
- Near-Market P/C OI is 2.248 and Put-favoring, but down from 2.549 in the prior data.
Right after expiry roll, Calls are forming above toward 64,750–66,000, while Puts are forming below toward 63,000, 61,000, and 60,000. This suggests not a simple one-direction bet, but building new positions for October expiry both up and down.
However, when combined with a clear downward move in Call center, high Put/Call OI, and Negative Gamma, the risk on the downside is slightly heavier at present than the upside.
The October expiry on the first day shows a Neutral 6/10, but the Score is -3.5, near bearish threshold. Deep Put Building, Call OI Center decline, 66,000 Call Wall Building, 63,000 Put Wall Building, and high P/C Volume are bearish factors. On the other hand, P/C OI decline and Put strike reallocation upward shift offset these.
On the price side, there has been a strong rebound from 62,880 to 64,340, but higher-timeframe structures remain downward. Currently 64,110 sits near 64,000 in the Negative GEX band and is well below 66,905 Zero Gamma. Therefore, do not interpret the short-term rebound as a direct trend reversal.
Option:Neutral 6/10 (bearish tilt)
MTF:Short-term rebound / higher-timeframe downward
Overall Direction:Sell-biased (during a short-term rebound)
Gamma:Negative Gamma / Expansion-type
If 64,340 is clearly broken and price holds at 64,750–65,000, the short-term sell advantage would retreat. Conversely, if 63,790–63,720 is broken, attention shifts to the 63,000 Put Wall and the day’s A-lows at 62,880; breaking below 63,000 would warrant awareness of expanded downside in a Negative Gamma environment.
| Strike | Current Meaning | If OI Increases | If OI Decreases |
|---|---|---|---|
| 64,750C | +754 large new Building | Strengthen nearby Call Zone | Initial formation could have been temporary |
| 66,000C | Call Wall / +886 / Building | Continue Call Wall formation | Wall weakens or unwinding shifts |
| 63,000P | Put Wall / +930 / Building | Strengthen Put concentration near 63,000 | Put Wall formation weakening |
| 61,000P | +527 / High volume | New Put formation on the downside continues | Downward reallocation unwinds |
| 60,000P | OI 10,976 / 5D +4,047 | Strengthen risk band of Deep Put | Unwinding of deep Put begins |
1) Can price break through 64,340 to move toward 64,750?
2) If 64,750–65,000 recovers and holds, the short-term sell advantage retreats
3) If 63,790–63,720 breaks, monitor the 63,000 Put Wall
4) If below 63,000, watch for another test of 62,880 and expansion of range under Negative Gamma
Price structure:TradingView Nikkei 225 Futures 15-minute chart, 2026-09-11 20:51 JST.
GEX is a model estimate and does not directly observe actual dealer hedge flows. Changes in Open Interest alone do not determine buyer or seller direction.
This report is for information purposes and is not intended as investment advice.