

Does the gold bullish candle indicate that gold was bought, or that the dollar was sold? - An MT4 indicator that decomposes the rise of XAUUSD into two forces
The gold chart extended upward.
You wait for a pullback.
When the pullback comes, you buy.
——And it doesn’t come back.
I have done this many times.
It’s that moment when you’re staring at the chart while bearing a loss and thinking, “Why isn’t it returning?”
The cause became clear later.
Gold was not being bought from the start.
What rose was because the dollar was being sold.
When the dollar was bought back, the price returned to its original level.
It was obvious.
My name is lab.aiueo, and I develop MT4/MT5 indicators.
This article is a introduction to GD-Deck, an MT4 indicator that decomposes and displays the price movement of Gold (XAUUSD) into the power of gold and the power of the dollar.“Gold (XAUUSD) price movement decomposed into ‘Power of Gold’ and ‘Power of the Dollar’” .
There are two types of bullish candles for gold
When XAUUSD rises, there are two main reasons.
1. Gold itself was bought
Physical demand, geopolitical risk, central banks’ purchases.
This is a case where demand for gold pushes prices up.
2. Only the dollar was sold
Gold hasn’t moved.
What moved was the dollar, which measures gold.
When the scale shrinks, a longer-looking thing appears at the same length.
What appears on the chart is the same bullish candle for both cases.
As long as you’re looking at candlesticks, you can’t tell the difference between these two
Neither volume, moving averages, nor oscillators can tell you. They all process the same single series, XAUUSD.
All of them are just processing one series, XAUUSD.
However, their meanings are completely different.
The former is demand for gold itself, while the latter is only the dollar side, and if the dollar returns, the price will return to its original level. if the dollar returns, the price will return to its original level.
The same chart shape requires opposite actions to be taken.
A large part of why gold is considered “difficult” lies here, in my opinion.
The way to tell them apart is actually very simple
The answer is「Re-measure using a scale other than dollars」.
When XAUUSD rises,
- If it rises in yen terms, euro terms, and pound terms as well
- If only the dollar-denominated value rises
It makes sense when you think about it.
If gold were truly being bought, it would rise regardless of the currency used to measure it.
That is the whole principle.
No special theory or paid sources are required.
Then why doesn’t anyone do this?
Because there are too many things to do.
Open multiple charts like XAUJPY, XAUEUR, XAUGBP, etc., compute the rate of rise/fall over the same period for each, and place them side by side for comparison.
To make a single entry decision, you’d have to repeat this every time.
Moreover, if you want to view over a different period, you have to redo everything.
Furthermore, many brokers do not offer XAUJPY or XAUEUR..
There are people who simply cannot measure such things.
And gold has its own set of pitfalls.
Cannot calculate lots.
There is no universal definition of “1 pip” for gold.
Contract sizes are 1oz / 10oz / 100oz by broker, and price digits vary between 2 and 3 digits.
An instruction like “SL is 20 pips” changes meaning depending on the broker.
Many gold strategy explanations you see online don’t fit your own account for this reason.
You cannot know the current spread.
Gold spreads widen around major news events.
Without a reference, you cannot judge whether the number you see now is normal or widening.
You don’t know the spread for the time when price moves the most in a given session.
You hear general statements like “moves from London to New York,” but tendencies vary by broker and by period.
In aviation terms, flying without an altimeter, fuel gauge, or airspeed indicator.
Whenever I deal with gold, this concern nagged me, so I compiled the necessary instruments on a single panel.
That is GD-Deck.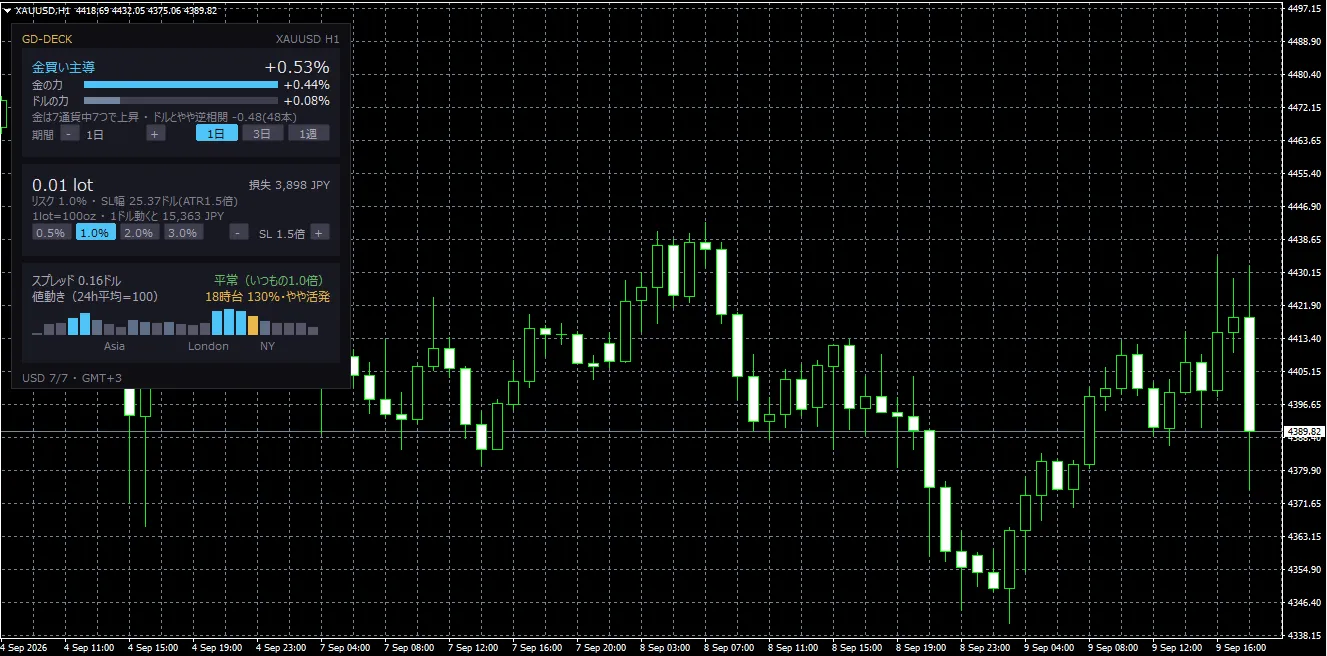
First, what this product does NOT do
Before considering purchase, I want to make one thing clear.
GD-Deck does not issue buy/sell signals.
It does not display win rate or profit factor, nor is it a sales pitch.
the actual measured values from the current chart.Cause analysis, correlations, time-of-day volatility, and normal spread values are all like that.
Why is that? Because performance figures can look convincingly good depending on the time window chosen and the analysis method.
I decided to stop selling tools based on numbers I cannot reproduce myself.
I designed the instrument panel as a tool for measurement and verification.
For those who cannot accept this, I think you don’t need to read further.
From here, I’ll show exactly what is displayed
- A method to separate “Power of Gold” and “Power of the Dollar” not by estimation but by calculation
- If you switch the period from 1 day to 1 week, the main cause can reverse
- Why it’s possible to compute seven-currency value even if XAUJPY is not offered
- What happens the moment correlations with the dollar break down
- How to get the correct lot across any broker when pips are not defined for gold
- Five steps to look at before placing an order and the price
1. The power of gold and the power of the dollar— decomposition by addition
GD-Deck calculates gold’s rise/fall in seven currencies: Yen, Euro, Pound, AUD, NZD, CAD, CHF and takes the median as the
“Power of Gold”. The remainder after subtracting the gold power from XAUUSD’s total change is“Power of the Dollar”
XAUUSD change = Gold power + Dollar powerThis part is crucial, but these two always add up to equal the total change..
This relationship is not an estimation or approximation; it is defined to be so.
You can verify by adding the numbers shown on the panel yourself.
The decomposition results are displayed as horizontal bar charts.
By looking at which bar is longer, you can instantly see which power is mainly driving the price movement.
The main causes are listed in one line as headings.
| Display | Status |
|---|---|
| Gold-buying dominated | Gold’s own demand is driving price movement |
| Dollar weakness dominated | The primary cause of the rise is dollar selling. More about currency than gold demand |
| Gold buying + Dollar weakness | Two forces are similar in strength, both rising |
| Dollar weakness offsetting gold selling | Gold is being sold, but dollar weakness pushes it up to offset it |
| Low activity | Change within the specified period is minimal |
(For the downside, there are also “Gold selling dominated,” “Dollar strength dominated,” “Gold selling + Dollar strength,” and “Dollar strength offsetting Gold buying” as equivalents.)
Personally, the most valuable one I think is「Dollar strength offsetting gold selling」. This indicates a state where price barely moves, but gold is being sold beneath the surface.
The moment dollar strength stops, that selling comes out to the surface.
Just staring at a flat chart won’t reveal this information.
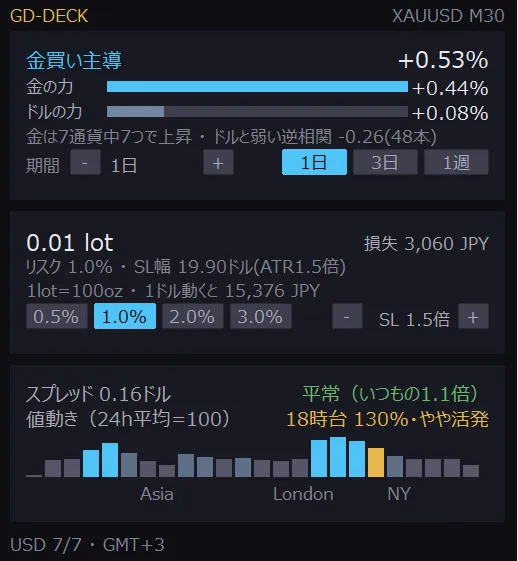
【Panel Zoom
2. It can be calculated even if XAUJPY is not offered by the broker
People think you need assets like XAUJPY when you hear “measured in seven currencies,” but that is not necessary.
Gold’s price in yen is「XAUUSD × USDJPY」.
In other words,as long as the seven dollar-rate pairs (EURUSD / GBPUSD / AUDUSD / NZDUSD / USDCAD / USDCHF / USDJPY) are visible as quotes, you can compute all seven currencies..
No need to prepare additional symbols.
The symbol names such asEURUSD.a or EURUSDm vary by broker, and GD-Deck detects and matches them automatically at start-up. Manual input is not required.
Gold’s symbol itself may vary likeGOLD/Gold/XAUUSD.a/XAUUSDm etc., but it operates based on settlement currency, not the name, so it works regardless of naming conventions.
3. Switching the period changes the main cause
This is the core benefit of the product.
On the panel, you can switch the decomposition period to1 day / 3 days / 1 week 1 day / 3 days / 1 week with fine adjustments using the +/- buttons. No need to open a settings screen.
And even on the same chart, changing the period changes the determination.
Seeing it on a 1-day basis shows “Dollar weakness dominated,” but on a 1-week basis shows “Gold buying dominated.” This happens quite often.
This is because while the short-term movement hides the ongoing gold buying, the longer term reveals it beneath the surface.
Conversely, if “1 day is Gold buying, but 1 week is Dollar weakness” then the big trend is dollar-driven, with only current buying in gold.
When both point in the same direction, the market alignment is strong.
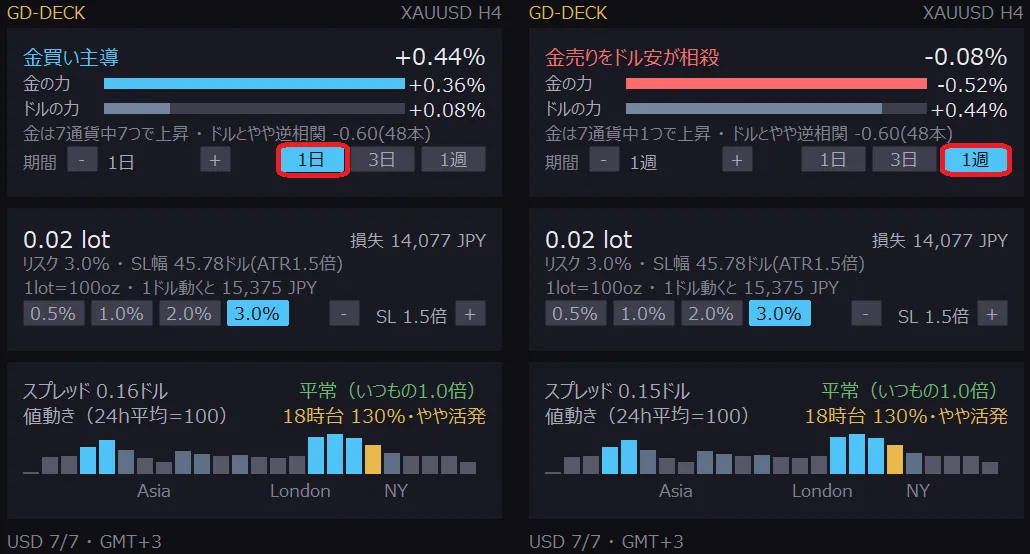
【Period switch comparison (1 day vs 1 week) where the main cause display changes】
Note that the period is specified by actual time rather than bar count, so changing the time frame does not change the length of the period you are viewing. Whether you view M15 or H1, “1 day” remains one day.
4. “Gold rises in 7 currencies”
Together with cause decomposition,
- Close to 7/7 → Broad gold buying is occurring
- Like 2/7 → The rise is largely due to dollar weakness
When read with the heading, you can interpret more precisely. For example, if “Gold rises in 7 currencies out of 7” and “Dollar weakness dominates,” then
Gold is broadly bought, but the dollar is sold even more.
5. Correlation with the dollar — the moment of breakdown marks a market shift
We continuously measure the correlation between gold and dollar strength/weakness, summarizing direction and strength into one word.
| Display | Absolute value | Reading |
|---|---|---|
| Strong inverse correlation with the dollar | 0.70 or above | If you look at the dollar’s direction, you can nearly read the direction |
| Moderate inverse correlation with the dollar | 0.40–0.70 | Generally in sync |
| Weak inverse correlation with the dollar | 0.20–0.40 | Correlation is waning |
| Almost no correlation with the dollar | below 0.20 | Moves not explained by the dollar |
Gold is normally negatively correlated with the dollar. Negative correlation isn’t abnormal.
What to look at is the moment when the usual strong inverse correlation becomes weak or nearly non-existent.It means the price movement previously explained by the dollar can no longer be explained, so gold-driven factors may be starting to move, and dollar-direction-based assumptions become less reliable. This phenomenon tends to occur when the market regime shifts.
This phenomenon tends to occur when the market regime shifts.
Note that correlation does not change with the period button. Cause decomposition looks at what happened in the current period, while correlation is a baseline measure of how much they typically move together, kept under constant sample counts.
6. Gold does not have a 1 pip value
This concerns lot calculation. The reason gold is tricky is that brokers have different specifications.
| Broker-dependent differences | Variations |
|---|---|
| Contract size (weight per lot) | 1oz / 10oz / 100oz |
| Decimal places in price | Two decimals (1811.25) / three decimals (1811.253) |
| Interpretation of 1 pip | $0.1 by some brokers / $0.01 by others |
To avoid this confusion, GD-Deck always displays price moves in
And the calculation base uses “the profit/loss you would have if you hold 1 lot and the gold price moves by $1” as directly obtained from the account.
Contract size and digits are consolidated into this single value. Therefore, any broker yields the correct lot size.
The determined contract size is shown on the panel as1lot=100oz so you can first verify it aligns with your account’s specifications.
Acceptable risk is and the SL width is specified by ATR multiples (adjustable via buttons).
What is displayed is a reasonablelot size and the correspondingpotential loss amount3,000 JPY.
7. Spread monitoring and 24-hour time-of-day volatility
Spread monitoring
| Display | Status |
|---|---|
| Normal | Less than 1.3 times normal spread |
| Slightly wide | 1.3 times or more |
| Expanding | Above the alert multiplier you set (default 2.0x) |
If you see “Expanding” on entry, you will incur an unfavourable cost just by entering. When the set multiplier is exceeded, you will be notified by alert (popup / push notification to smartphone / sound).
Time-of-day volatility
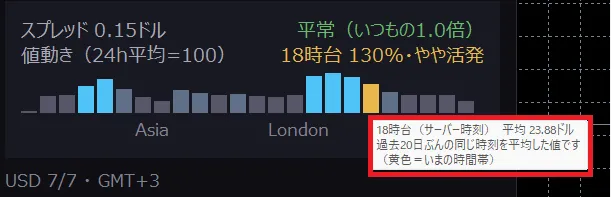
Below the graph are Asia / London / NY labels, so you can read it without worrying about server time.
8. Pre-use confirmation procedure
The sequence I personally use.
- Switch the period to view the main cause
- “◯/7 currencies” view— the closer to 7/7 or 0/7, the more widely gold is being demanded/supplied
- View time-of-day volatility
- View spread
- Check lot size and potential loss
Up to here, everything is completed only with panel button operations. No need to open a parameter screen.
9. Operating environment and customization
| Item | Content |
|---|---|
| Platform | MetaTrader 4 (Build 600 or later) |
| Instrument | Dollar-denominated gold (GOLD / XAUUSD.a / XAUUSDm notation also works) |
| Recommended time frame | M15 or higher (also works on M1/M5) |
| Required history | 7 dollar pairs |
| DLL | Not used |
| External indicators | Not required |
| Manual | A4 PDF containing all 11 chapters |
Indices and crude oil are not referenced at all. Codes vary by broker, and this can cause malfunctions.
Displays can be turned on/off independently for four sections, and background color, text color, bar color, font name, font size, and display position can all be customized. 4K and high-DPI environments are supported, and Windows display scaling (125% / 150% / 175%) is automatically read and magnified with frame, line spacing, and text scaled equally. You can also manually set the magnification from 100% to 250%.
On yen-denominated gold charts (XAUJPY, etc.), the cause decomposition premise does not hold and is shown as “excluded.” Lot calculation, spread, and time-of-day volatility still function correctly.
10. Relationship with other tools
GD-Deck is gold-specific. It does not operate on currency pairs.
There is also a free version.
Price and sales page
GD-Deck is sold on GogoJungle for
https://www.gogojungle.co.jp/tools/indicators/85960
*Prices are as of the time of writing.
Finally
Gold will always misalign somewhere if you touch it as if it were a currency pair.
I don’t understand what exactly makes it rise. The pip base for lots varies by broker. It’s unclear whether spreads are normal.
All of these factors make judging difficult regardless of the technique’s skill.
GD-Deck is not a tool that teaches you how to win.
What you do with them is up to you.
If you have any questions, feel free to ask before or after purchase. I will answer personally.
Disclaimer
This article and the tool do not provide investment advice.
There are no buy/sell signals, no guaranteed profits or win rates.
All displayed information is actual measured values from the current chart, and does not predict future price movements.
Time-of-day volatility and normal spreads are based on your account’s actual values and cannot be compared with others.
Lot calculations are based on contract sizes obtained from brokers.
Please verify the amounts yourself before placing orders.
Forex and precious metals CFDs involve the possibility of losses exceeding deposits.
Final trading decisions are your own responsibility.