
Check the upcoming USD/JPY on the daily chart
2026 Latest Version!!
Here you can watch the interview VTR with GoGoJyan President Hayakawa and me
New product information!!
↓↓↓

As a side note, knowing this method
New Millionaire Trader's Scalping - Volume Plus
FX Trading is not normal - both-sides trading
If you engage in it, your mind will clear about the reversal moments I write about in Investment Navigator every day, and you can focus on trading.
Good morning everyone.
Dear subscribers“Yesterday's article”Keep that in mind as you face the charts!!
By doing so, you will become closer to your true self that you aim for.
First, change your mindset.
Dollar-Yen MT4 daily chart
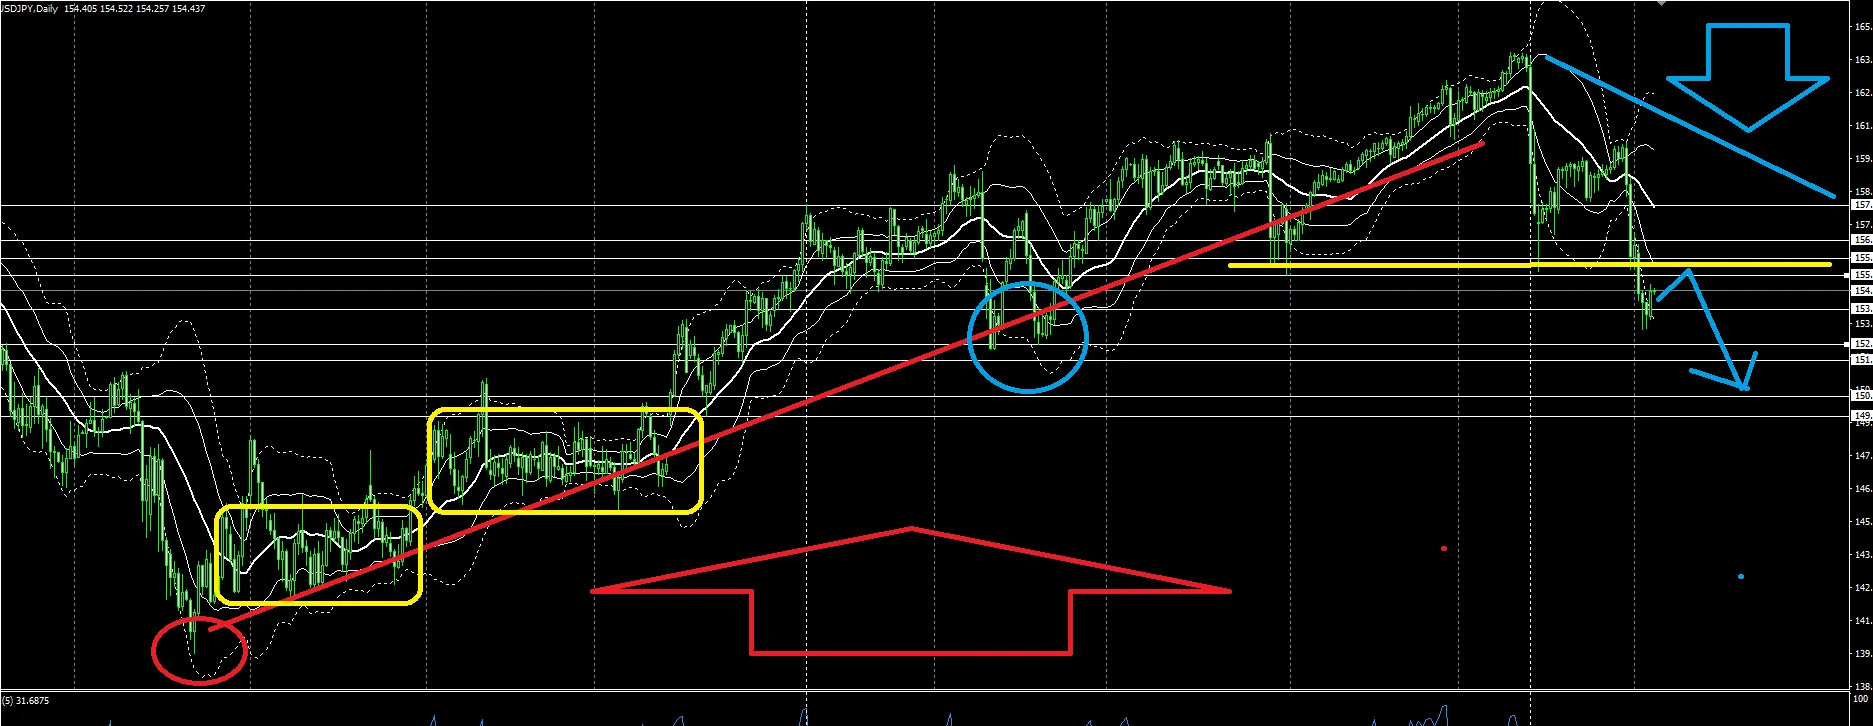
Recently, due to expectations of rate hikes, the yen has been strengthening.
However, buys are coming in from the downside, so volatility and price range are large.
In such scenes, it is a good opportunity, but don't think “I missed it, hurry!!”; instead, recall yesterday's article.
The USD/JPY has been on an upward trend from the red circle until the end of July, but currently due to coordinated intervention by the US and Japan, the yen has strengthened.
From this daily chart, the yellow square zone is a long-range range, so breaking through all at once is quite difficult.
If there is a sudden breakout, it might be due to an intervention or other events.
Once reached here, I think you should test a “buy” for a while.
The white multiple horizontal lines are the “Daily Sell Millionaire Line.”
From about the 158 level, use it as a reference.
As you can see, it has responded well to reversals and breaks.
As of today, whether the recent low blue circle is broken determines whether the downtrend continues?
The most important thing is to pay attention to the “yellow horizontal line.”
This line overlaps with the Millionaire Line, but this line is where
the roles of support and resistance have swapped.
If you look further back, you’ll understand why …
Whether long-term or short-term, look for and be aware of the support-resistance flip line.
The price tends to change around these levels.
On the daily chart, the yellow horizontal line that was support becomes resistance and selling rallies occur?
That's how I see it. (blue arrow down)
The flip between support and resistance, in simple terms, is where many buyers find support, and where many sellers have resistance.
At the time of flip, there is a battle between support and resistance; carefully observe that battle.
Millionaire Trader users, with the Millionaire Trader Chart and Millionaire Line, know about eight out of ten directions now, so the best position in that direction is determined by the Millionaire Line.
If you have a general sense of the background, you won't worry about positions in that moment.
After that, simply wait for that moment.
This sequence of actions will bring you closer to your ideal self.
Whether you trade FX or not, there is no reason not to, but what and how you do it is extremely important.
To help you become proficient without spending enormous time, this Investment Navigator and the product I offer provide such trading content.
Thank you for your continued support today as well.
For traders who desperately want to succeed in trading, who want to earn a living through trading, I recommend this product, which can also be learned through self-study:
Here are FX methods learned from verifying the trade histories of top traders