
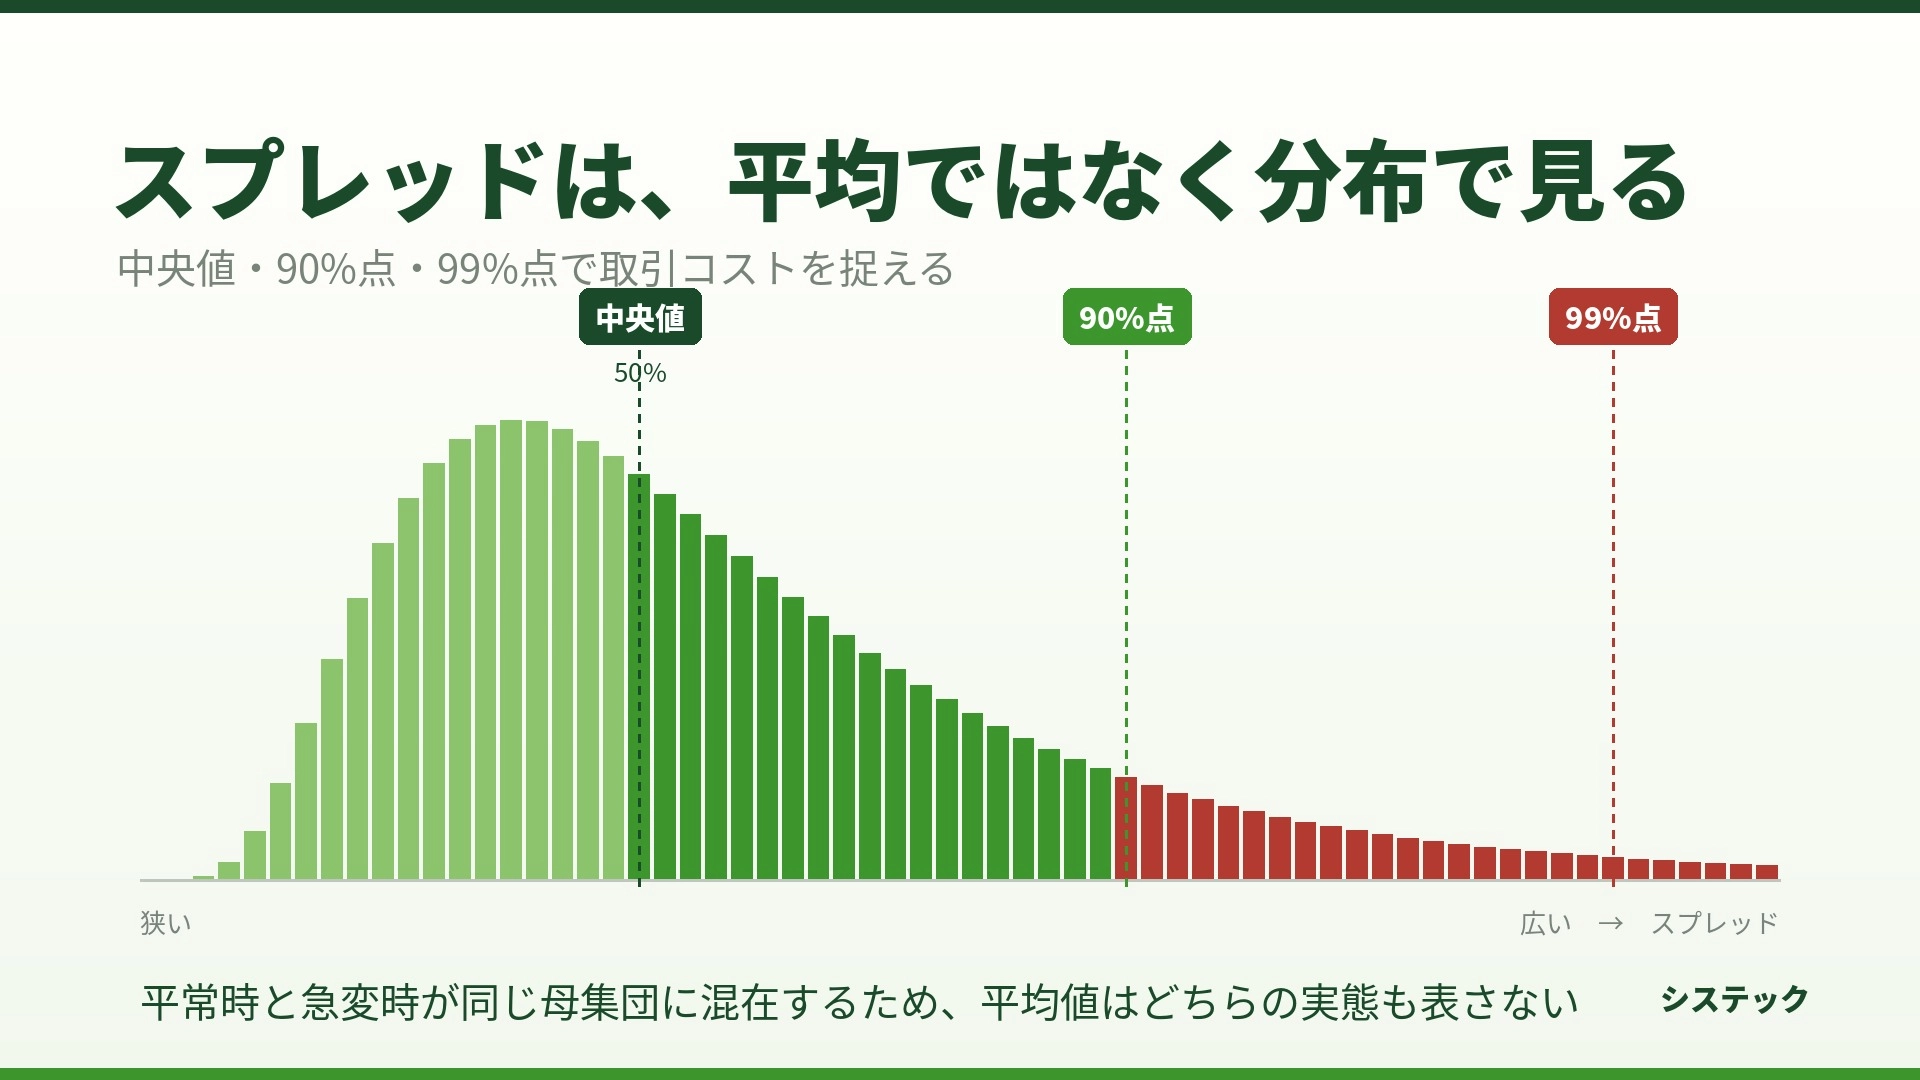
Even by looking at the average spread, you still can’t know the actual cost
When choosing tools to use on MT5, or when selecting a broker, many people compare the spread numbers. However, if that number is an average, it hardly serves as a useful comparison.
The reason is simple: the distribution of spreads deviates significantly from a normal distribution.
Normal times and volatile moments are in the same bag
Spreads are narrow and stable during quiet periods. However, at the moment of indicator releases or during times of thin liquidity, they can expand many times over the normal level. Averaging these two as a single population yields numbers that do not reflect either state.
For example, in a currency pair, suppose out of 10,000 observations, 9,500 are 0.6 points, and the remaining 500 are large moves with an average of 8 points. The simple average is about 1.0 point. This “1.0” is not the reality for either the 9,500 observations nor the 500 volatile observations. It is a number that belongs to neither.
And when you actually trade, which side you are on cannot be determined from the average alone.
The distribution itself changes with the time of day
Another problem is that the distribution of spreads is not constant throughout the day.
The morning in Tokyo time, the early hours in London, the overlap with New York time, and the rollover before/after midnight. Each has different liquidity conditions, so the central value of the spread and the way it widens change.
The daily average smooths out all these differences. For someone who only trades during the day, or someone who carries positions overnight in the early morning, numbers for times that do not affect them are mixed in.
Viewing as a distribution
So what should we look at? One approach is to view it by quantiles.
Median (50th percentile)is the exact middle value when observations are ordered from smallest to largest. Unlike the mean, it is not swayed by a few extreme values. It shows “how much is typical.”
90th percentileis the level that is exceeded only 1 in 10 times. It serves as an indicator of the unfavorable side encountered in everyday trading.
99th percentileis the level that is exceeded only 1 in 100 times. It reflects what can happen during indicator releases or thin liquidity periods. By looking at this number, you reduce occasions where you say something was unexpected.
By presenting these three percentiles by time of day, you can see things that a single average could not reveal. For example, the median hardly changes across the day, while the 99th percentile spikes in certain time windows.
Relation to backtesting
For system traders, this difference directly affects the accuracy of validation.
Many backtests are calculated using fixed spreads or spreads included in historical data. The former is obviously not reflective of reality, and the latter varies in accuracy depending on the broker.
In short-term trading, if your target profit per trade is only a few points, even a 1-point misestimate of the spread can change the meaning of the validation results. Modeling with the median versus modeling with the 90th percentile can reverse the performance of the same logic.
Whether you trust the validation results depends on whether you understand what assumptions were used to calculate them.
If you measure yourself
To obtain percentiles, you need to record actual spreads.
With MT5, for each tick you wouldSymbolInfoInteger(_Symbol, SYMBOL_SPREAD)and accumulate them as a frequency distribution by time of day. Saving all samples would take up a lot of space, so by binning the spread values and counting frequencies you can accurately compute percentiles while keeping memory fixed.
One caution: you must handle the difference between server time and local time. Since you are aggregating by time of day, misclassifying which time zone you are using will shift your conclusions entirely.
Also, the data gains meaning only after enough data are collected. With only a few days, the 99th percentile will be based on only a few dozen samples. It becomes usable only after several weeks to months of continuous recording.
Decide after measuring
What I’ve written so far essentially says: don't rely on published numbers; look at what actually appears in your own account.
Broker-specific methods of calculating spreads and recording them differ. But if you measure using the same standards, you can compare. It’s better to measure first and then decide than to decide beforehand and then measure.
The author has developed a verification tool for MT5. For the time-of-day spread distributions discussed in this article, I have released an indicator that measures and displays percentiles based on actual observations.