
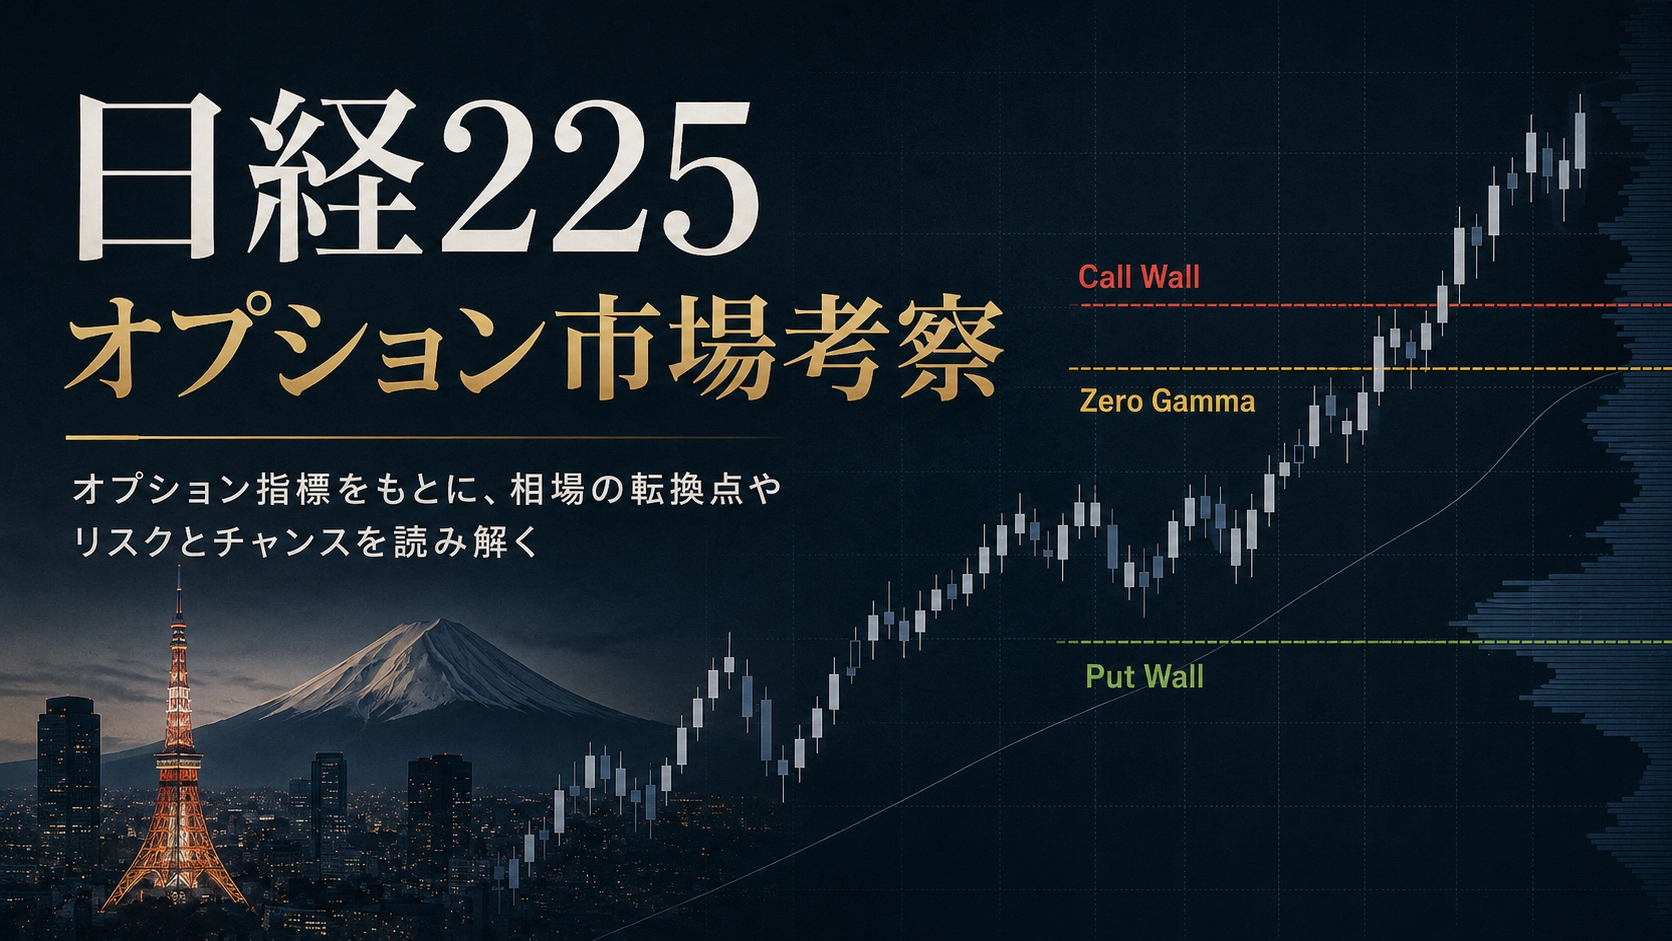
NK225 OPTION MONITOR — DAILY MARKET STRUCTURE 20260909
| Judgment Items | Judgment | Key Points |
|---|---|---|
| Option Direction | Neutral | Option Score +2.0. IV/Skew improved and upward re-pricing underway, but Deep Put Building and both Wall Building offset. |
| 15-minute MTF Price Structure | Bearish | After the drop from 66,780, retraced to 65,790 high, then fell again. Break of 64,810; price below 3 major MAs. |
| Overall Direction | Bearish | Options are Neutral, but breaking below 65,000 Put Wall and 65,303 Zero Gamma clarifies downward price structure. |
| Gamma Environment | Near Zero / Normal | Total GEX -12.87. However, around 64,500–64,000 near current price shows large local Negative GEX. |
Daily Option data alone is Neutral, but as of 20:26 futures havefallen to 64,570, breaking below both 65,000 Put Wall and 65,303 Zero Gamma. The 15-minute chart shows lower highs and lower lows. Presentlybearish. However, 64,500–64,000 resides in Negative GEX territory, so be cautious of not only downside but also potential sharp reversals that could widen price swings.
| Item | Value | Relation |
|---|---|---|
| Nikkei 225 Spot | 65,142.78 | JPX Daily Data Basis |
| Nikkei 225 Futures | 65,260 | Futures value based on JPX daily data |
| As-of 20:26 Futures | 64,570 | About -690 from daily futures value |
| ATM Strike | 65,125 | DTE 2 |
| Call Wall | 67,000 | BUILDING |
| Put Wall | 65,000 | BUILDING, but current price has penetrated below |
| Zero Gamma | 65,302.80 | Current price about 733 below |
| Total GEX | -12.87 | NEAR ZERO |
After creating the daily Option data, futures fell sharply and both 65,000 Put Wall and Zero Gamma 65,303 were breached. Therefore tonight, from the daily time point, the “65,000–65,303 battle” advances one step,confirmation of downside settlementis the focus. GEX is a daily data-based model value, and actual distribution can change with overnight price movements.
| Strike | OI | 1D | 3D | 5D | Volume | Evaluation |
|---|---|---|---|---|---|---|
| 66,500C | 3,177 | -368 | +333 | +374 | 984 | Day unwinds |
| 66,625C | 1,062 | +899 | +900 | +1,058 | 919 | Large-scale Building |
| 67,000C | 3,509 | +135 | +459 | +744 | 1,207 | Call Wall Building |
| 68,000C | 3,650 | +272 | +248 | +252 | 1,060 | Upper Building |
| 68,750C | 572 | +234 | +247 | +253 | 269 | Upper expansion |
The +899 of 66,625C stands out, and Building also expands from 67,000 to 68,750. The daily structure continues to form an upper Call Zone, but since current price is 64,570, the distance is widening, reducing the immediate significance as tonight’s upper price level.
Call Wall is67,000 / BUILDING. Together with the large Building at 66,625C, 66,625–67,000 is the first Call Zone. Further up, 68,000–69,000 also shows upper formation continuing.
However, the current price has fallen to 64,570, so tonight the priority is whether we can recover to around 65,000–65,303. Call Wall is not a fixed resistance; treat it as a reference band upon re-approach.
| Strike | OI | 1D | 3D | 5D | Volume | IV |
|---|---|---|---|---|---|---|
| 65,000P | 4,818 | +409 | +381 | +685 | 1,345 | 30.19% |
| 64,500P | 873 | +198 | +194 | +222 | 341 | 30.80% |
| 64,250P | 335 | +285 | +295 | +293 | 400 | 31.44% |
| 62,000P | 4,042 | -206 | -5 | +478 | 1,168 | 39.59% |
| 61,500P | 1,642 | -416 | +59 | -14 | 402 | 43.78% |
| 60,375P | 2,137 | +114 | +2,118 | +2,118 | 156 | 49.08% |
| 60,000P | 5,746 | -97 | -1,004 | -4,022 | 1,018 | 49.62% |
65,000P is +409 with Put Wall Building, and 64,500P and 64,250P are increasing as nearby puts form downward. Conversely, declines in 61,500P, 62,000P, and 60,000P are notable, and the overall Deep Put rearrangement is clearly shifting between strikes.
Near-Market P/C OI Ratio:1.140(down from 1.185 yesterday)
Near-Market P/C Volume Ratio:1.014
OI-based Put dominance has shrunk from the previous day and volume is nearly balanced. The market’s downside tilt is easing versus yesterday, but the current price drop does not align with that direction. Therefore tonight, prioritize price structure over PCR.
Call Near-Market OI Center:66,752.30(1D +5.51 / 3D +115.77 / 5D +62.10)
Put Near-Market OI Center:63,359.36(1D +38.83 / 3D -23.54 / 5D +154.06)
Call center of gravity is upward in mid-term. Put center is mixed by period, rising at 5D. The overall center of gravity of option positions has not shifted downward as much as price drop, keeping Option Bias Neutral.
ATM Average IV:31.06%(yesterday 32.94%, -1.88pt)
Put Skew:+2.72pt(yesterday +4.41pt, -1.70pt)
Call Skew:+1.69pt(yesterday -2.38pt, +4.08pt)
ATM IV and Put Skew have declined, while Call Skew has risen sharply. The previous strong downward hedging demand has softened, yet the actual price overnight has fallen steeply.Internal option improvements and price structure are diverging— this is the day's main feature.
Total GEX:-12.87 JPY bn / 1%
Gamma Regime:NEAR ZERO
Zero Gamma:65,302.80
| Strike | Net GEX | Evaluation |
|---|---|---|
| 64,000 | -10.41 | Strong Negative GEX |
| 64,500 | -7.61 | Near current price vicinity |
| 65,000 | -3.95 | Put Wall vicinity also negative |
| 66,000 | -6.40 | Local Negative GEX |
| 66,625 | +7.43 | Positive GEX |
| 67,000 | +9.27 | Near Call Wall |
The current price 64,570 is entering the 64,500 Negative GEX zone, and the next 64,000 is also a strong Negative GEX. This does not determine the downtrend, butif downside continues, the range tends to widen. Conversely, if a sharp rebound begins, price range is likely to widen upward as well.
| Timeframe | Judgment | Rationale |
|---|---|---|
| 15 minutes | Downtrend | After 65,790, retrace high lowers; breaks 64,810 to 64,570. 20EMA down. |
| 1H equivalent | Downward / Bearish | Price below 80EMA. Major pullback from 66,780 to 65,790 continuing. |
| 4H equivalent | Structure deteriorating / caution for reversal | Price also below 320EMA. However, the Sep 4 low of 63,710 has not been breached, so a solid long-term downtrend is not confirmed. |
Short-term and mid-term are bearish. The long-term is deteriorating, but until 63,710 is breached, we cannot declare a complete collapse of a larger upward structure. Currently at a point where we confirm whether a large up move will transition into a sustained long-term structural shift.
The September 9 daily Option data are Neutral. Declines in ATM IV and Put Skew, rise in Call Skew, and lower P/C OI ease yesterday’s downside warnings, yet Deep Put Building and the 65,000 Put Wall and 67,000 Call Wall remain, so Option alone cannot determine direction.
However, futures as of 20:26 fell to 64,570 and clearly breached 65,000 Put Wall and 65,303 Zero Gamma. The 15-minute chart shows a retrace from 66,780 down to 65,790, then a break below 64,810. The price is below 20EMA, 80EMA, and 320EMA.
Option:Neutral
MTF:Bearish
Overall Direction:Bearish
Gamma:Near Zero, but current area shows local Negative GEX
Currently, price structure takes precedence over improvement in options. If price settles below 64,500, 64,250→64,000 becomes the next monitoring band. Negative GEX is large at 64,000; if the trend continues, be wary of wider swings. If 63,710 is breached, a further significant deterioration of the 4H-scale structure occurs.
Conversely, if a rebound occurs, first recover 65,000 and then surpass Zero Gamma 65,303 and the nearby high 65,340. Until this is recovered, the rebound remains within the realm of a bearish bias.
| Strike / Level | Current Meaning | If Increases / Recovers | If Decreases / Breaks |
|---|---|---|---|
| 65,000P | Put Wall / +409 / Building | OI increase continues Put concentration near 65,000 | OI decrease weakens the wall. If price settles below, it is not viewed as support |
| 64,250–64,500P | Nearby Put Building | Strengthening of nearby down Put zone | Formation pauses; possible reallocation |
| 66,625C | 1D +899 Large Building | Strengthening of first Call Zone | Beginning of large formation relief |
| 67,000C | Call Wall / Building | Increased importance of upper Call zone | Wall weakening |
① Can we hold 64,500, and if breached, move to 64,250→64,000
② Breaching 64,000 warns of expanded downside under Negative GEX
③ On a rebound, can we recover 65,000→65,303 Zero Gamma→65,340
④ If we break 63,710, this would further strengthen a 4H-scale structure deterioration
Price structure:TradingView Nikkei 225 Futures 15-minute chart, 2026-09-09 20:26 JST.
GEX is a model-estimated value and does not directly observe actual dealer hedge flows. Changes in Open Interest alone do not determine whether buyers or sellers are dominant.
This report is market analysis for information purposes and is not intended as investment advice.