
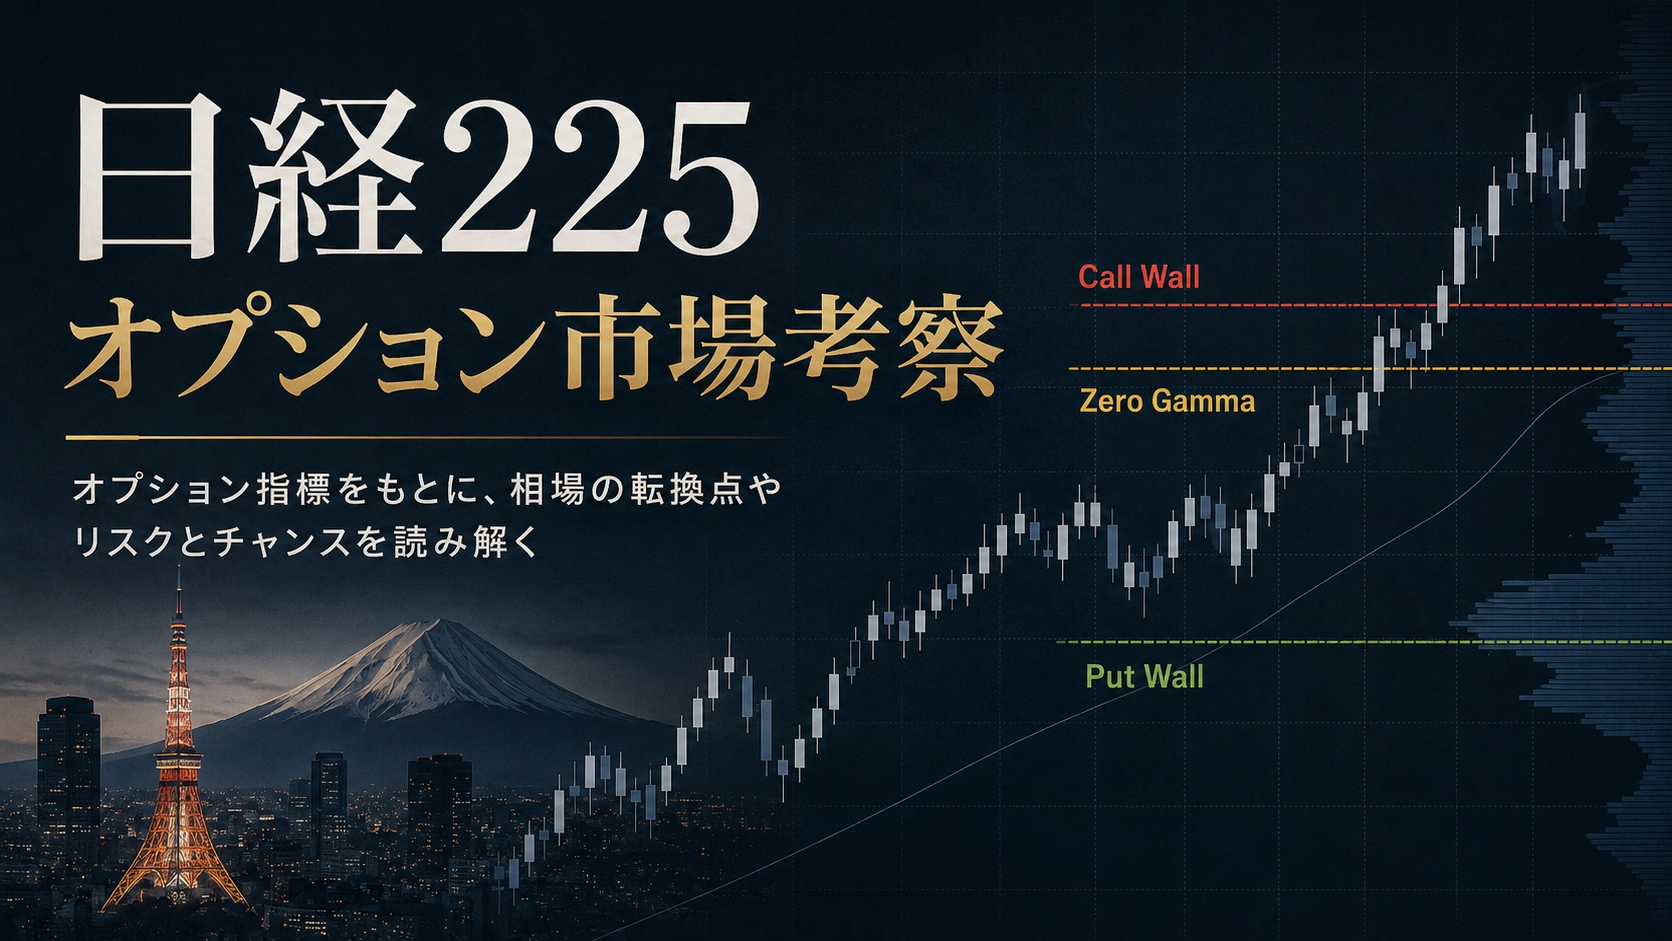
NK225 OPTION MONITOR — DAILY MARKET STRUCTURE 20260908
| Item | Judgment | Key Points |
|---|---|---|
| Option Direction | Neutral | Downside caution intensifies but offset by rising OI centroid and upper strike reallocation. |
| Confidence | 7/10 | Option Score -1.0. |
| MTF Price Structure | Unevaluated | This time created using only option data, without TradingView images. |
| Volatility Environment | Expanding | Total GEX -26.83, NEGATIVE GAMMA. |
Direction from Options alone is Neutral. However, ATM IV surges, Put Skew sharpens, and the Call Wall 66,500 Building adds headwinds to upside. Meanwhile, both Call/Put OI centroid rise, and Near-Market P/C OI Ratio declines, so it’s not a one-sided bearish stance.65,000 Put Wall~65,703 Zero Gammais the first important judgment band.
| Item | Value | Assessment |
|---|---|---|
| Nikkei 225 Spot | 65,269.33 | JPX Daily Data Basis |
| Nikkei 225 Futures | 65,210 | Futures value based on JPX daily data basis |
| ATM | 65,250 | DTE 3 |
| Call Wall | 66,500 | BUILDING |
| Put Wall | 65,000 | STABLE |
| Zero Gamma | 65,703.49 | About 493 points above the futures |
| Total GEX | -26.83 | NEGATIVE GAMMA |
Current price is close to Put Wall 65,000, with Zero Gamma 65,703 above and Call Wall 66,500 awaiting above. Key levels are relatively close to each other.
| Strike | OI | 1D | 3D | 5D | Volume |
|---|---|---|---|---|---|
| 65,000C | 4,737 | -1 | -432 | -651 | 197 |
| 66,000C | 2,082 | +39 | -88 | +286 | 159 |
| 67,000C | 3,374 | +37 | +486 | +802 | 596 |
| 68,000C | 3,378 | -145 | 0 | +100 | 1,096 |
65,000C is being unwound mid-term, while 67,000C continues to rise in 3D/5D. The upside Call center may have shifted toward 66,500–67,000.
Call Wall is66,500 / BUILDING. 67,000C 3D +486, 5D +802 combined,66,500–67,000 Call Zoneis evaluated as the Call zone. Not a fixed resistance; watch whether it decelerates on approach or stays above after breakout.
| Strike | OI | 1D | 3D | Volume | IV |
|---|---|---|---|---|---|
| 65,000P | 4,409 | -56 | +39 | 1,106 | 32.23% |
| 66,000P | 2,611 | +89 | +236 | 299 | 39.95% |
| 60,000P | 5,843 | -842 | -2,620 | — | — |
Near-Market P/C OI Ratio:1.185(from previous day 1.261 down)
Near-Market P/C Volume Ratio:1.204
OI-based Put advantage has diminished versus the prior day. However, volumes slightly favor Put. PCR alone does not determine direction.
Call Near-Market OI Center:66,751.38(1D +103.86 / 3D +132.54 / 5D +90.88)
Put Near-Market OI Center:63,320.52(1D +105.85 / 3D +52.54 / 5D +76.23)
Centroids for Call and Put move higher in 1D, 3D, and 5D. While downside risk factors rise, the overall position center is moving up.
ATM Average IV:32.94%(previous day 28.58%, +4.36 pt)
Put Skew:+4.41pt(previous day -0.23pt, +4.64pt)
Call Skew:-2.38pt(previous day +0.36pt, -2.75pt)
ATM IV and Put Skew rise sharply, while Call Skew falls.Rising downside risk premium is today's most evident bearish factor. However, it does not alone determine direction.
Total GEX:-26.83 JPY bn / 1%
Gamma Regime:NEGATIVE GAMMA
Zero Gamma:65,703.49
Gamma is evaluated as a price-range environment rather than direction, currentlyExpanding. If direction is decided, both upside and downside ranges tend to widen. 65,000 shows Net GEX +3.11, 65,750 -4.65, 66,000 -1.23, so the zone around 65,700–66,000 is where Zero Gamma and negative GEX overlay.
Confirmed Facts:66,500 Call Wall Building, mid-term growth of 67,000C, large unwinding of 60,000P, sharp rise in ATM IV and Put Skew, and rising Call/Put OI Centers.
Possible Structure:On the upside, a Call Zone forms from 66,500–67,000; on the downside, new Put formation progresses alongside existing unwinding. Approaching expiry, this seems to reallocate risk rather than simply betting in one direction.Reallocation of upside and downside risks
September 8 Option market:Direction is Neutral, but risk environment is worseningas ATM IV and Put Skew rise sharply, and Call Wall builds at 66,500. Meanwhile, Call/Put OI centroid rises, Near-Market P/C OI Ratio declines. Additionally, large unwinding continues at 60,000P, not implying a one-way downside buildup.
Option Direction:Neutral
Volatility Environment:Expanding (Negative Gamma)
Most Important Band:65,000 Put Wall ~ 65,703 Zero Gamma
MTF Price Structure:Not reflected this time
If 65,000 holds and 65,703 is recovered and established, room for a rebound toward 66,500 Call Wall expands. Conversely, if 65,000 is clearly broken and settles below, expect broader downside price range under Negative Gamma.
| Strike | Current Meaning | If OI Increases | If OI Decreases |
|---|---|---|---|
| 65,000P | Put Wall / STABLE | Increase in importance of the 65,000 decision band | Put Wall Weakening |
| 66,000P | 1D +89 / 3D +236 | Prospective continuation of Put formation | Put reallocation pauses |
| 66,500C | Call Wall / BUILDING | Call Wall Strengthening | Wall formation slows |
| 67,000C | 3D +486 / 5D +802 | Strengthening of Call Zone 66,500–67,000 | Upward Call formation begins to unwind |
| 60,000P | Large Unwinding | If reformation occurs, downside caution rises again | Continued deep Put unwinding |
① Can we maintain 65,000?
② Can we approach, break through, and establish 65,703 Zero Gamma?
③ When returning to 66,500–67,000 Call Zone, will we stall or break through?NK225_Option_Monitor_Lite_20260908.pdf
GEX is a model estimate and does not directly observe actual dealer hedge flows. Changes in Open Interest alone do not determine whether buyers or sellers are dominating.
This report is for informational purposes and is not intended as trading advice.