
How much should you trust the profit factor of backtesting?
When looking at backtest results, the profit factor (PF) is one of the first numbers you notice. PF 2.0, PF 5.0, and sometimes values like PF 7.8 are seen.
The larger the number, the better it seems. However, how far you can trust that number is not determined by PF alone.
PF grows easily when the denominator is small
PF is the ratio of total profit to total loss.
If total profit is 7.8 million yen and total loss is 1 million yen, PF is 7.8.
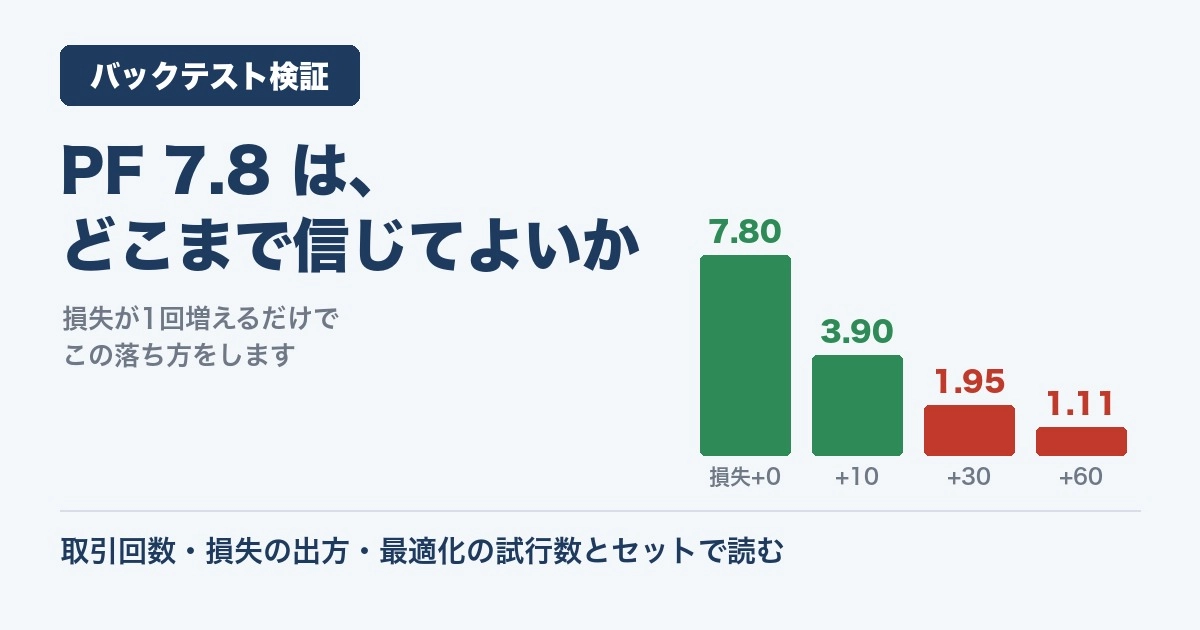
Now suppose an additional loss of 3 million yen, which had not been shown in the table, is added once.
PF = 78 ÷ (10 + 30) =1.95
7.8 has become 1.95. The logic has not changed.PF at the stage where total losses are still small moves a lot with just one loss.
This does not mean PF is a wrong metric. It is a property of a ratio. Therefore, when looking at PF, it is necessary to examine together how much experience the denominator is built on.
Even with the same PF, its meaning changes with the number of trades
PF of 3.0 from 30 trades and PF of 1.6 from 1,000 trades — the latter is more stable as a basis for judgment.
When the number of trades is small, there is still the possibility that you simply have not encountered a large loss yet. Even with a long backtest period, if the number of trades is small, you want to check the actual sample size.
The number of optimization runs also drives PF up
You run backtests dozens to hundreds of times while varying parameters and adopt the setting with the best performance. In EA development, this is a normal procedure.
However, the act of choosing the best one in itself pushes the performance up. If you try many, you will certainly find settings that fit the coincidental quirks of past data.
In practice, for example, trying 89 variations with moving average cross and applying the best-performing settings from the learning period directly to the validation period caused the Sharpe ratio to drop from 1.295 to 0.242. Eighty percent of the performance vanished. This was not due to market conditions changing or the logic being modified. It was simply because we chose the best one.
Six items you should view alongside PF
To interpret PF, here are the minimum pieces of information you should assemble:
- Number of trades — the denominator that determines PF stability
- Total profit and total loss — PF’s numerator and denominator
- Average profit and average loss — to view in relation to win rate
- Maximum loss (per trade) — how far PF can drop from one losing trade
- Maximum drawdown — whether drawdown is calculated including unrealized losses
- Verification period and forward performance — whether the results continue beyond the past data
How many of these items can be confirmed changes how you read PF as a single number. It is not always all of them, butknowing which parts are missing itself becomes a basis for judgment.
Do not negate the numbers; break them down
This is not a warning to avoid high-PF EAs. What you should verify is under what conditions that number was produced.
If the number of trades is sufficient, losses have been experienced a certain number of times, the forward period shows the same trend, and the number of optimization runs is disclosed, PF 2.0 with those conditions is easier to read than PF 7.8 with unclear conditions.
About the author
I have distributed a free PDF at GogoJungle that summarizes the above verification steps into a fillable checklist and a questionnaire template for sellers (6 questions).
- EA Sales Page 5-Minute Checklist [Free](Free, A5, 8 pages)
The procedure to read PF together with number of trades, loss sensitivity, bootstrap, and forward performance is covered systematically in the paid version.
All of these are PDFs I prepared. They do not indicate whether you can purchase a specific EA or product, and the numerical examples in the text are all fictional for explanatory purposes. Please make final investment decisions at your own risk.