
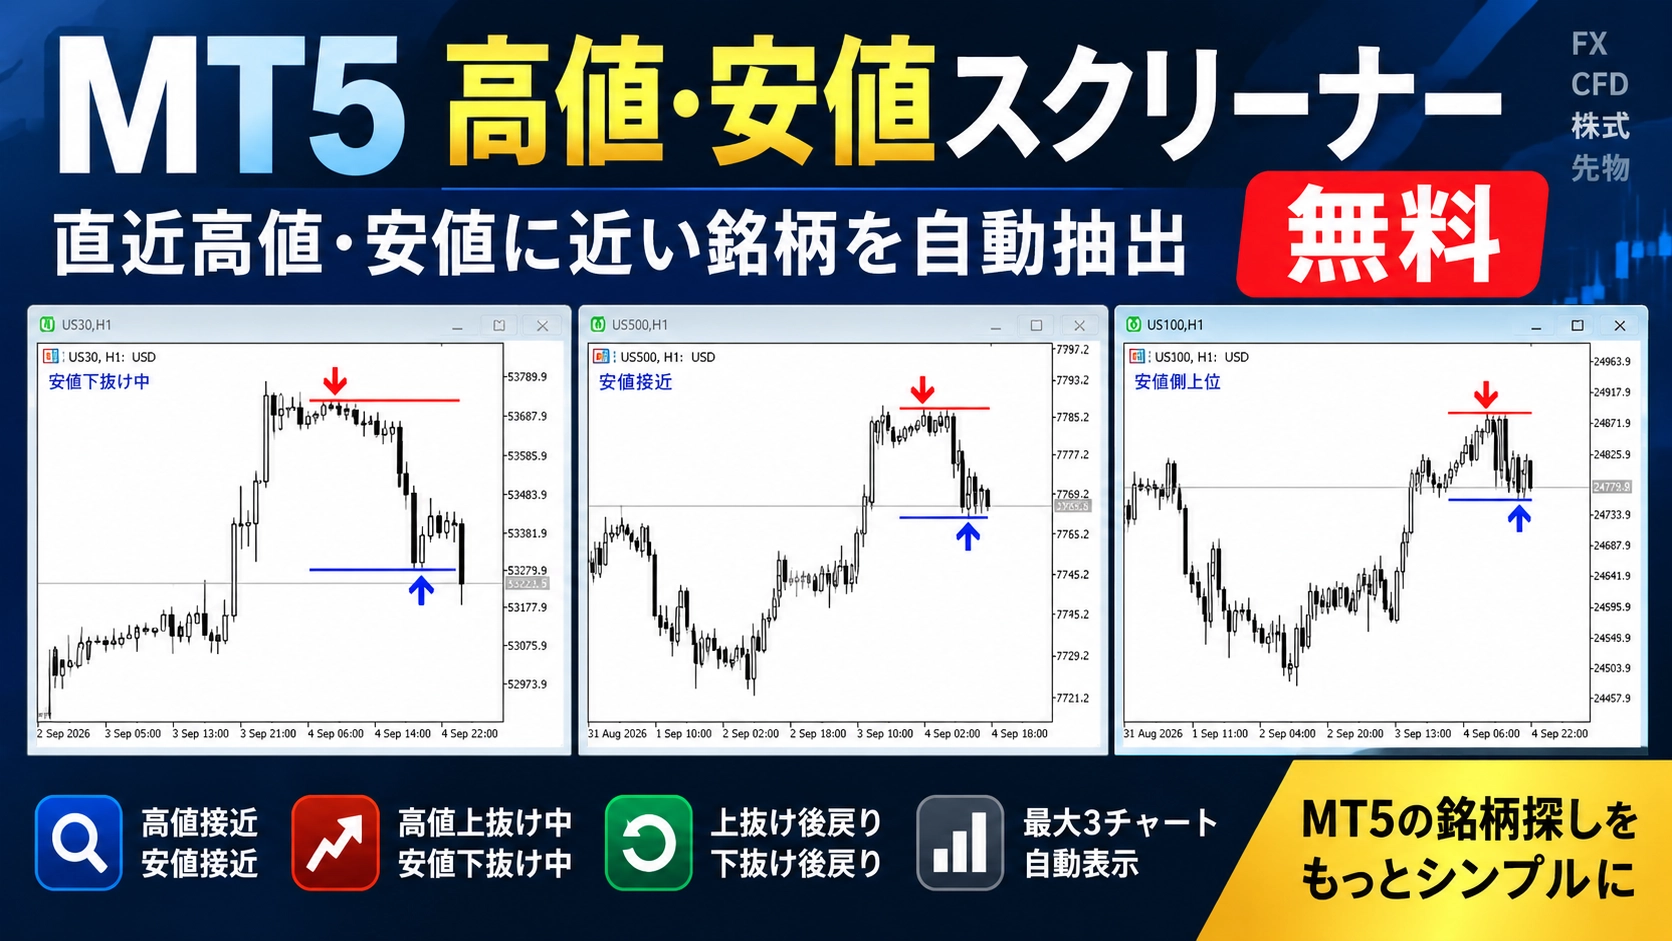
[Free Version Distribution] Automatically extract stocks closest to recent high and low
When viewing multiple symbols in MT5, it’s cumbersome to search for one symbol at a time that is close to recent highs or lows.
Therefore,a cleaner that checks the price quotes lined up and automatically displays up to 3 charts of the symbols you want to view nowhas been created.
This time, the Lite version is published for free.
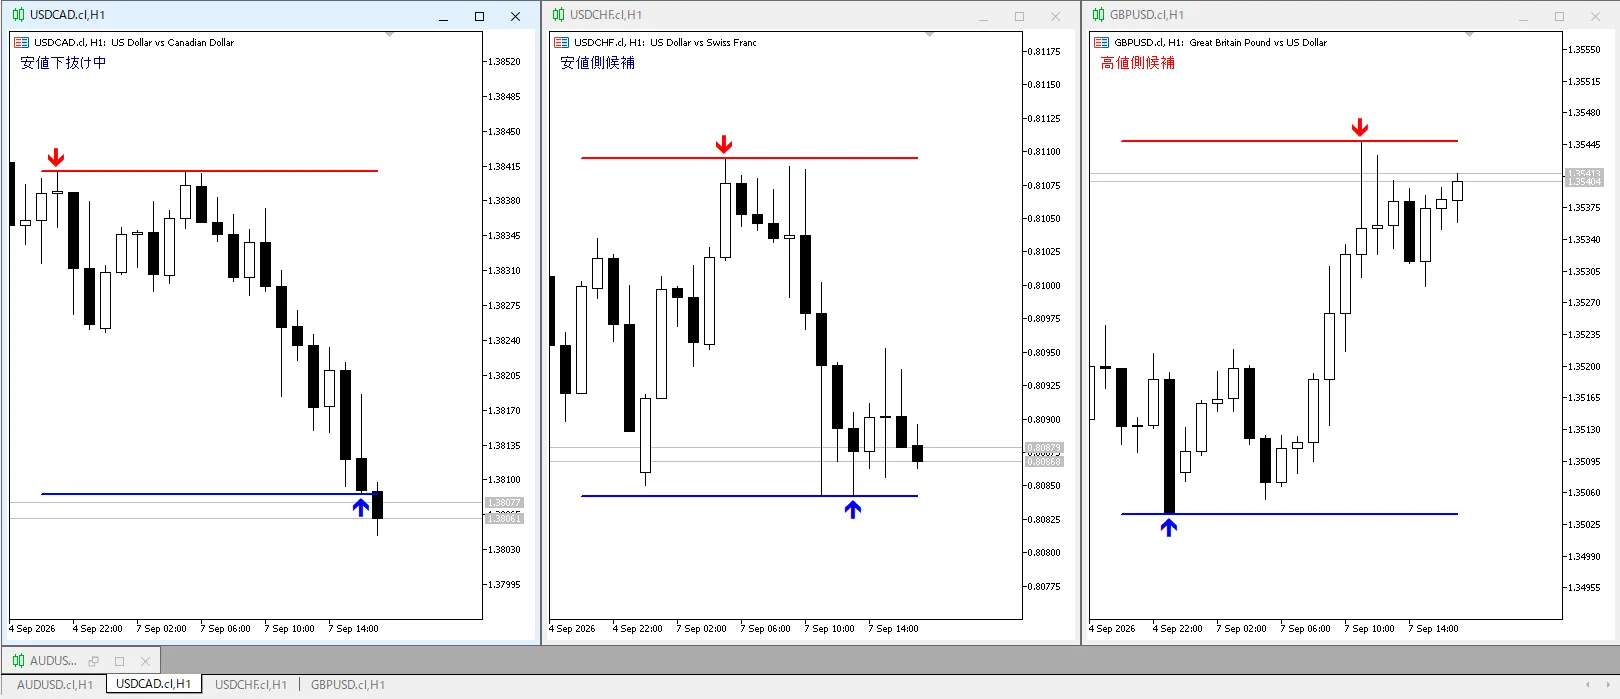
【Three charts displayed after execution】
What kind of symbols we will look for
On the 1-hour chart,we examine the highs and lows from the last 20 confirmed bars and check where the current price is relative to those levelsand see its position.
The display status is
- breaking above highs / breaking below lows in progress
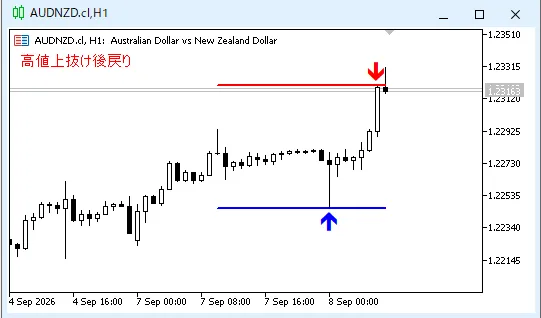
- retracing after breaking above highs / retracing after breaking below lows
- highs approaching / lows approaching
- high-side candidates / low-side candidates
.
Recent highs and lows arebased on the last 20 bars before the currently forming bar.
In the chart,recent high is shown in red,recent low is shown in blue.
Furthermore, an arrow is displayed on the bars that form those highs or lows, and only the current state is shown at the top-left.
Even out differences by ATR per symbol
Different symbols have different price volatility.
Therefore, instead of simple price differences,we compare the distance to highs and lows using ATR.
ATR is a gauge of how much a symbol typically moves.
In the Lite version, the distance from the current price to the most recent high/lowwithin 0.5 ATRis considered “close”.
Actual operation

When executed, it checks the symbols in the quote display collectively.
Priorities are
upward break / downward break → retracement after break → highs/lows approaching → high-side candidates / low-side candidates
and it shows up to 3 symbols with the highest priority.
If you want to check the latest state, run the cleaner again.
Lite version conditions
The Lite version has fixed conditions.
- H1
- last 20 bars
- ATR14
- Close: within 0.5 ATR
- After breaking above/below and retracing: the currently forming bar must break by at least 0.05 ATR and then current price returns inside the baseline
- Maximum of 3 charts displayed
Symbols with spreads that are too large relative to price movement are excluded.
Free Lite version
From here you can download High/Low Screener Lite for free.
Press “Read More” and you won’t be charged.
After logging in, obtain the attached file and try it out.
【Free application & attached file】