The Way of Investment (Part 269)
The Way of Investing (that 269)
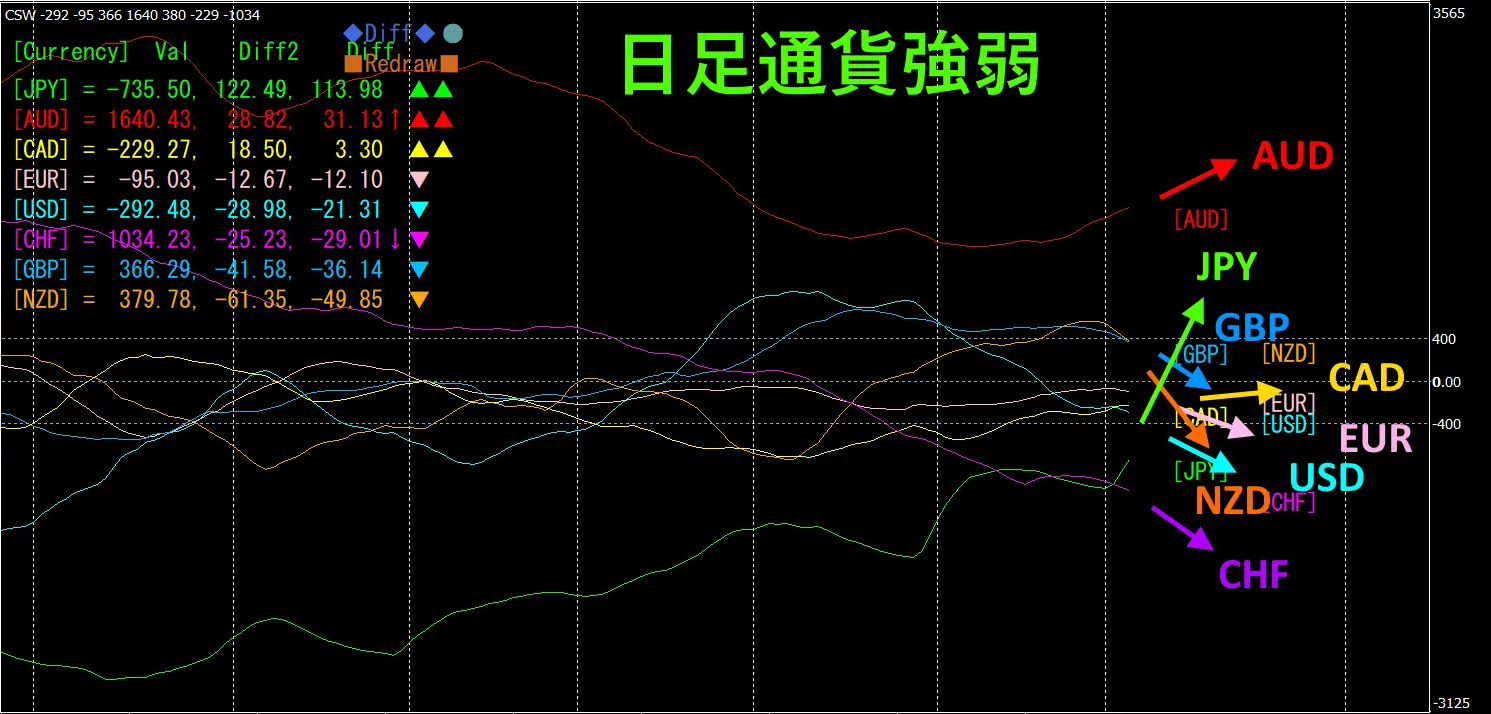
1. First, from the daily charts
Daily currency strength chart, hourly currency strength chart will be examined in order.
JPY, AUD, CAD are rising. NZD, GBP, CHF, USD, EUR are falling. .In the daily chart, JPY shows notable rise.
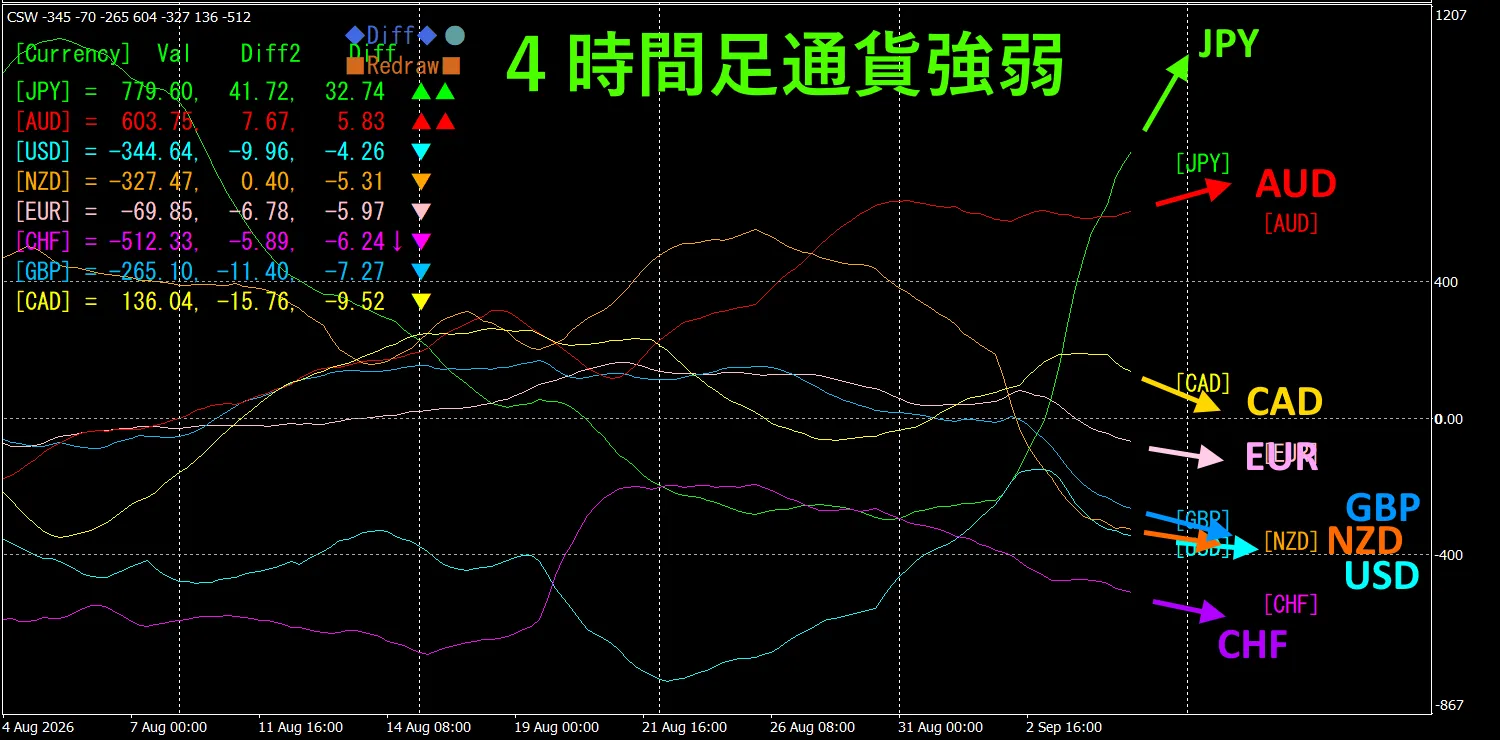
2. 4-hour chart
JPY, AUD are rising. CAD, GBP, CHF, EUR, NZD, USD are falling. On the 4-hour chart as well,JPY remains strong. It stands out.
3. Movements of precious metals, GOLD will rebound but fall again
using the “8CFD Visualization Indicator Any version” to display precious metal trends on the 1-hour chart.
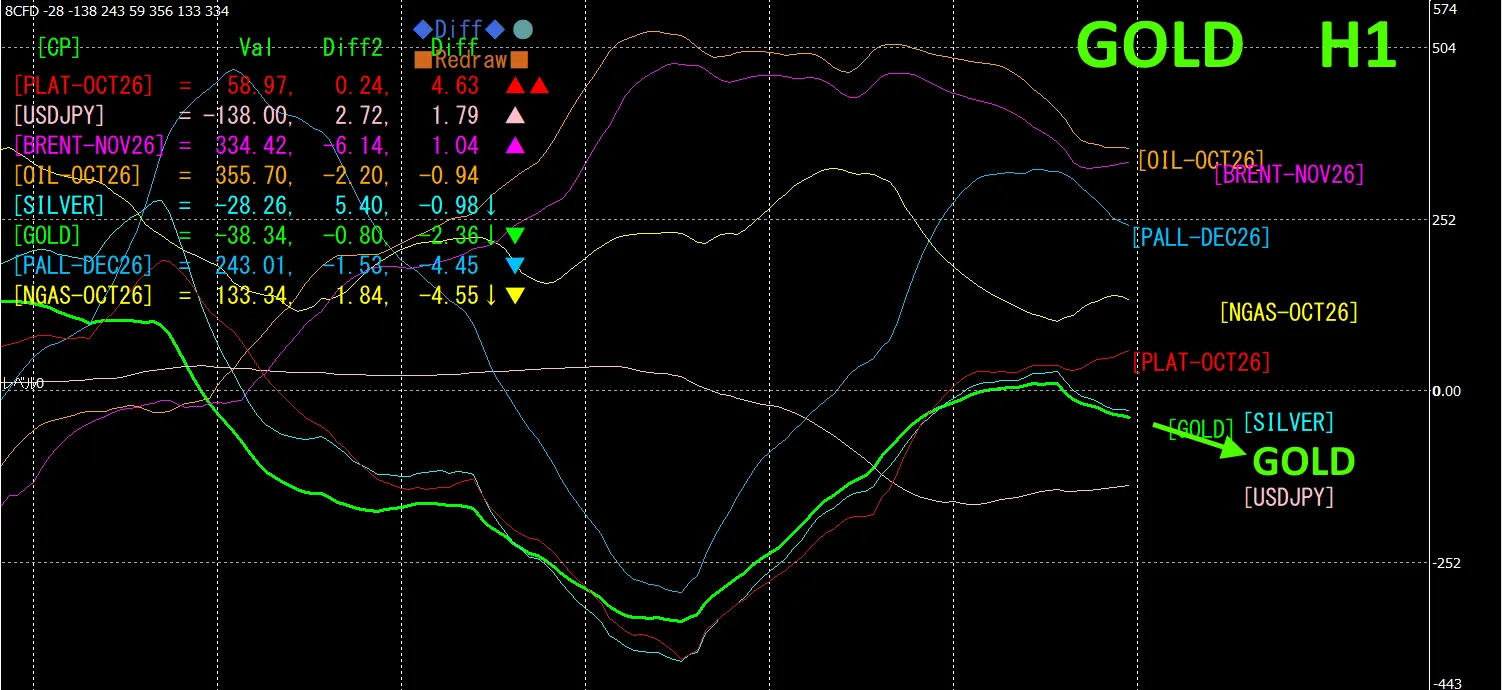
GOLD, which had fallen at a steep angle, will rebound briefly, then head downward again. Given the high crude oil price due to international conditions, GOLD is in an environment where gains are harder.
4 . 【New Project】 Market environment analysis using AI
A new indicator that lists the trend status of 28 currency pairs, a trend-detection indicator “MTR28_TrendMACD” has been developed (not publicly released yet). This indicator generates the source code entirely by AI without a single line written by a human.

Originally, it was created to capture the initial move of trends, but by combining this indicator with the currency strength chart, a plan was made to delegate market analysis to AI with a prompt. As a result, quite useful outputs were obtained, so we will publish it as【New Project】 starting this week.
The screen copy of the “MTR28_TrendMACD” indicator is shown below.
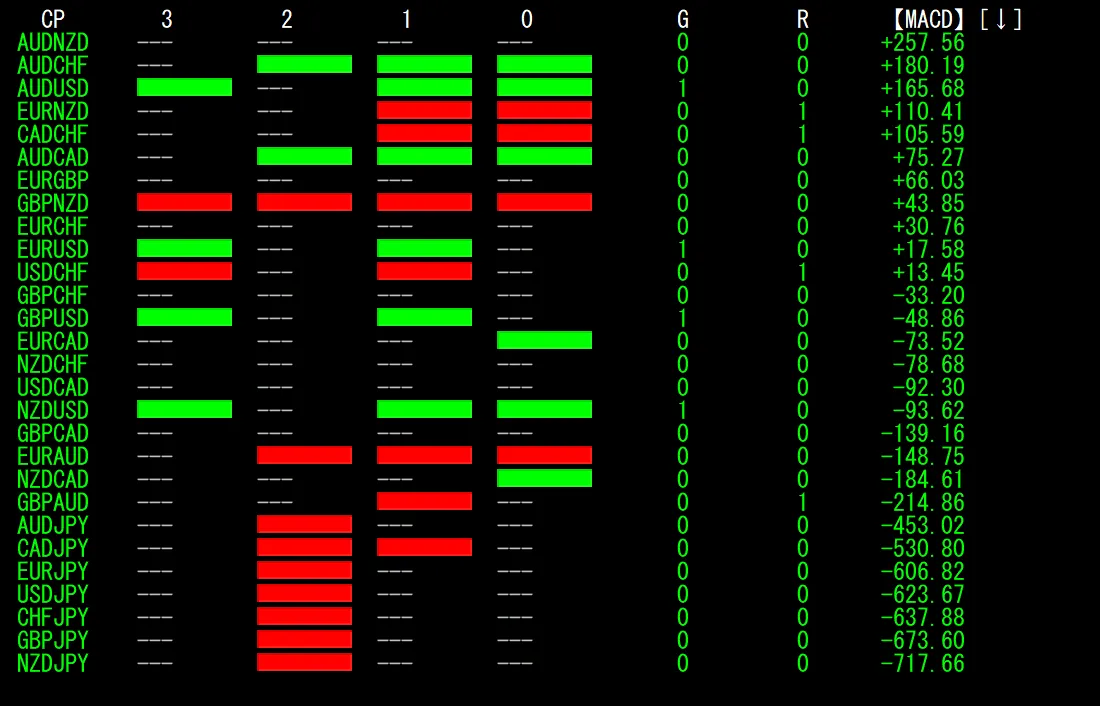
The red and green bars indicate, red is a downtrend, green is an uptrend. The trendless is ——— display. The first column is the currency pair name, 3,2,1,0 represent the Time[3],Time[2],Time[1],Time[0] trend status. The letters G and R indicate currencies with trend initiation or reversal, shown as 1 and 0. In the G column, a currency pair with a rising trend is indicated as 1, in the R column, a currency pair with a falling trend is indicated as 1.
The rightmost column shows standardized MACD values, these numbers indicate how far the rate deviates from the moving average.
The overall flow is as follows.
(1) The AI automatically selects eight currency pairs to focus on from the trend-detection indicator “MTR28_TrendMACD”.
↓
(2) The AI reads the currency strength chart, combines it with the data from (1), performs environment analysis, and assigns a score from 0-100.
↓
(3) The results are output as text.
It will be a fairly lengthy report, but, below is the text output by AI.