Usage of "visualization indicators" (Part 267)
“Visualization Indicator” Utilization(Part267)
1. Further evolving the “28Currency Pairs List Indicator” to develop it into an indicator
“8CPVisualization Indicator”toGBPJPYdraw
The “8CPVisualization Indicator”hasOceaniaversion, Londonversion, NewYorkversion, and AnyCPversions available.This time, the Londonversion was used.
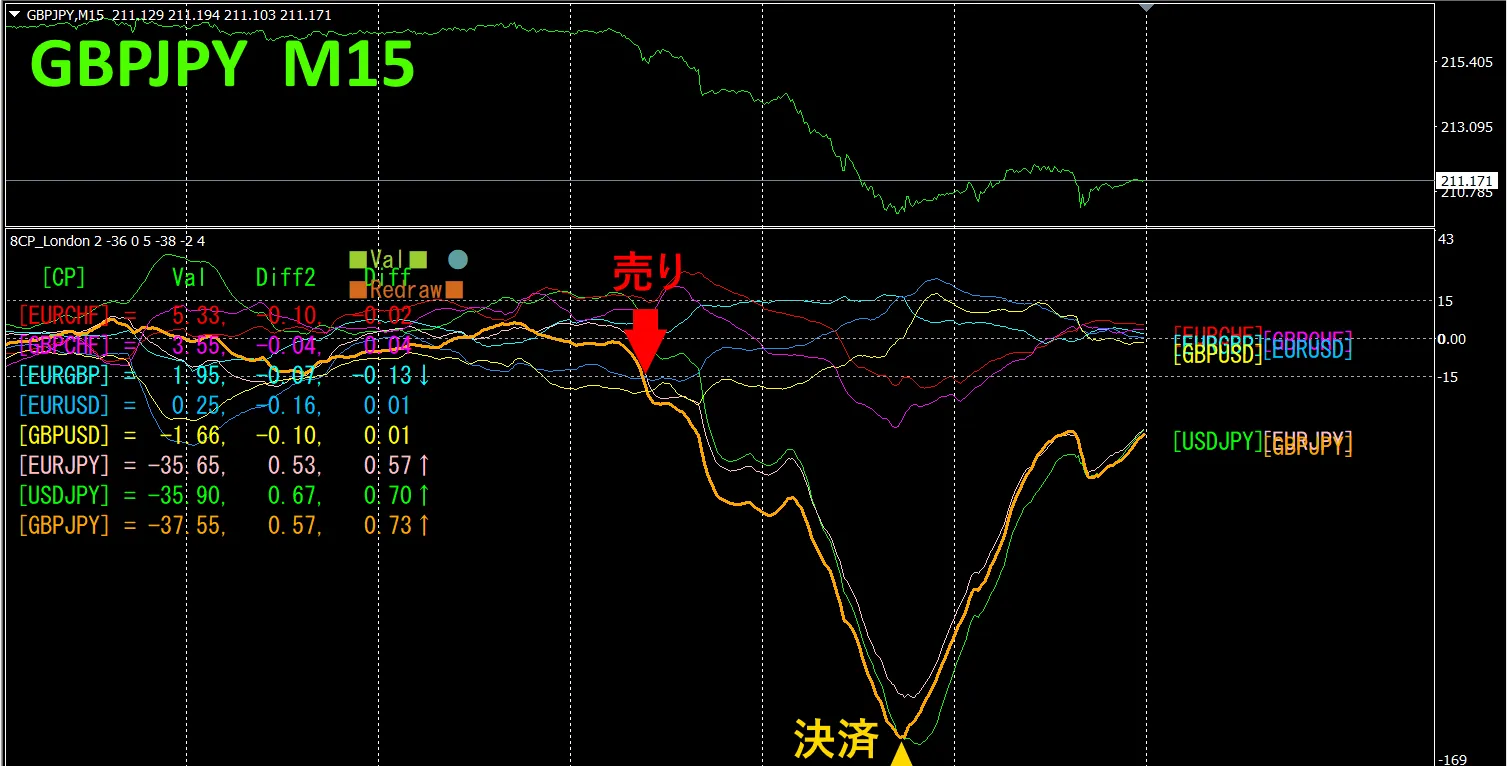
The upper half,GBPJPYis a15-minute chart.The lower halfis by the “8CPVisualization Indicator”output,the thick orange linegraphcorresponds toGBPJPY
On Wednesday, the GBPJPYgraph,broke below the other group of graphs,and fell sharply,so a sell position was opened.It rebounded from the bottom on Thursday, so it was closed.About530pipsof profit was obtained.
Currency strength graph
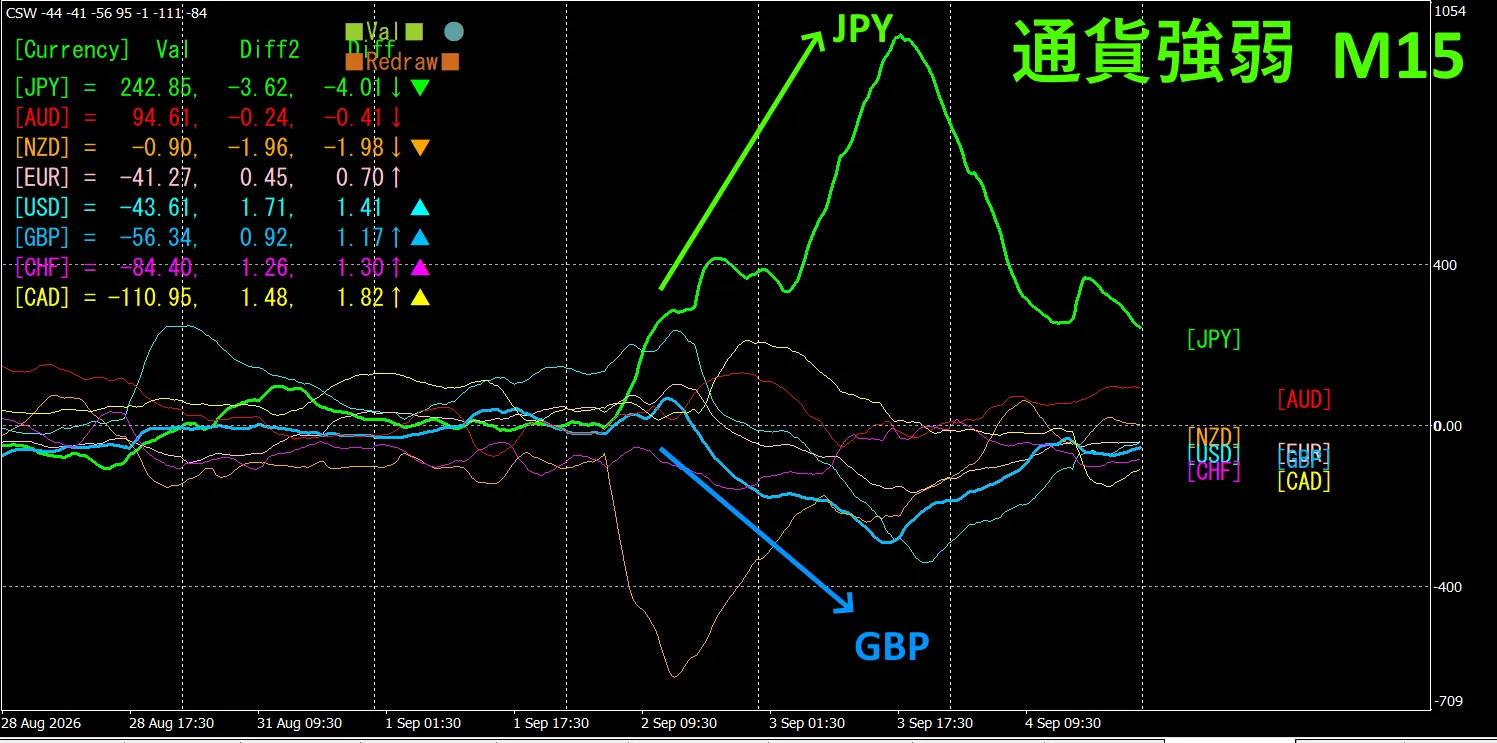
Looking at the15-minute currency strength graphJPYandGBPare,in an inverse correlation.JPYandGBPOnly in the sections where they diverge and spreadwe trade. JPY > GBPso,during divergenceGBPJPYshould be traded shortand that’s fine.Inverse correlationrelationshipbeing present,we target only those points for trades.
In FX,if youpick the pair currently expanding the most,and that is in an inverse correlation,the results will naturally follow.
“Aim for currency strength inverse correlation!”isan iron ruleof FX.
Using “TrendLine-EX”,you can automate entries and exits on diagonal trendline breaks.You can leave it as is,makingtradingeasy and effortless. “TrendLine-EX”is,a semi-automated EA that can auto-sell on trendline breaks downward,and auto-close on trendline breaks upwardEA.
2. Try using the Best SelectIndicator
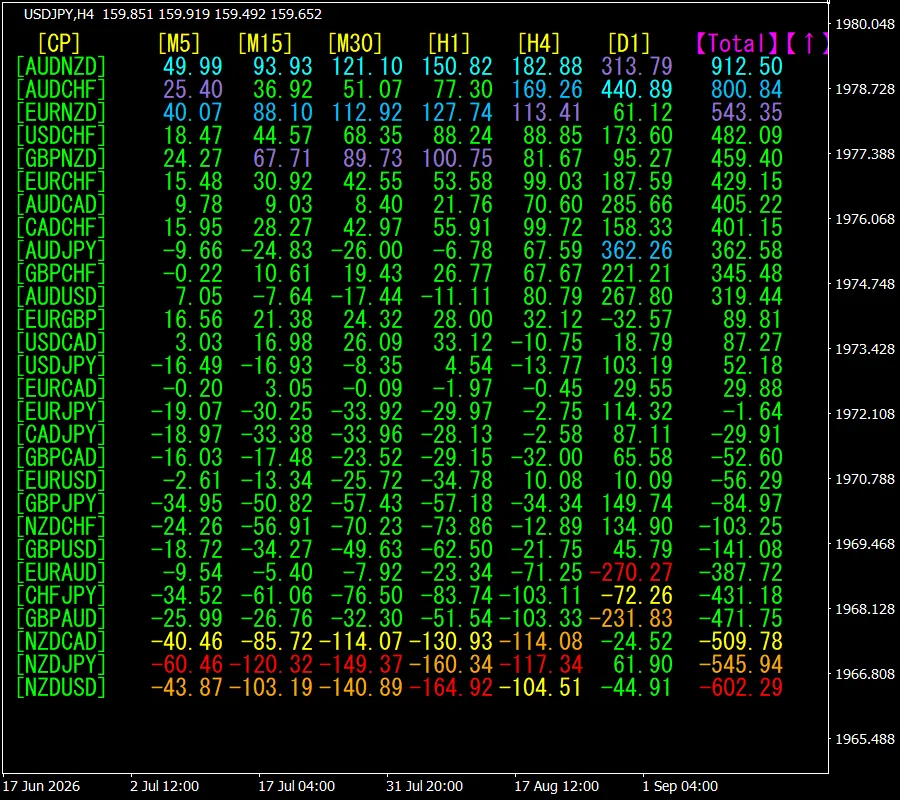
Thefigure below is a screenshot at 2026 September2nd 21:43(JST) .
[Total]is sorted indescending orderof the values.At the topAUDNZDis,for all timeframesshown inblue-ish. The Totalvalueis912.50and,a positivenumber.AUDNZDis,suggestedto be in an uptrend.
Now,let’s look attheAUDNZD chart.
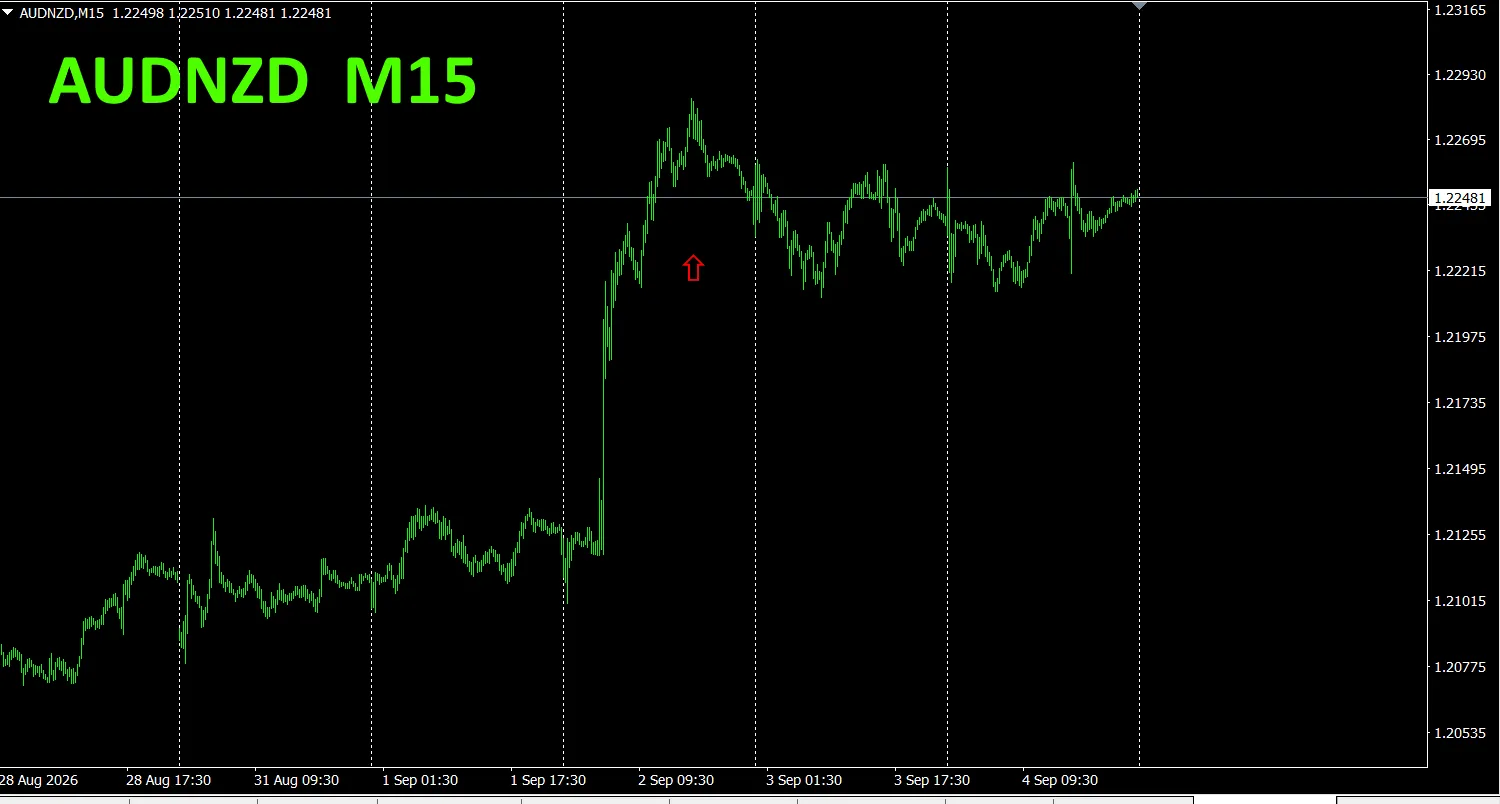
The red arrow indicates where the screenshot was taken.It capturesthe portion extending upward within the uptrend.
“28Currency PairsBest SelectIndicator”can,among the 28currency pairs,easily find which currency has the strongest trend.Also,“28Currency PairsDivergence ComparisonIndicator”will,among the 28currency pairs,tell youthe pair with the greatest divergence.From all pairs,which pair to trade,.
“28Currency PairsBest SelectIndicator”

https://www.gogojungle.co.jp/tools/indicators/35128
3. From 2021,MaytrackingEURJPY—what happened to the move?
Sincethe year2021May, we have beentracking EURJPY.
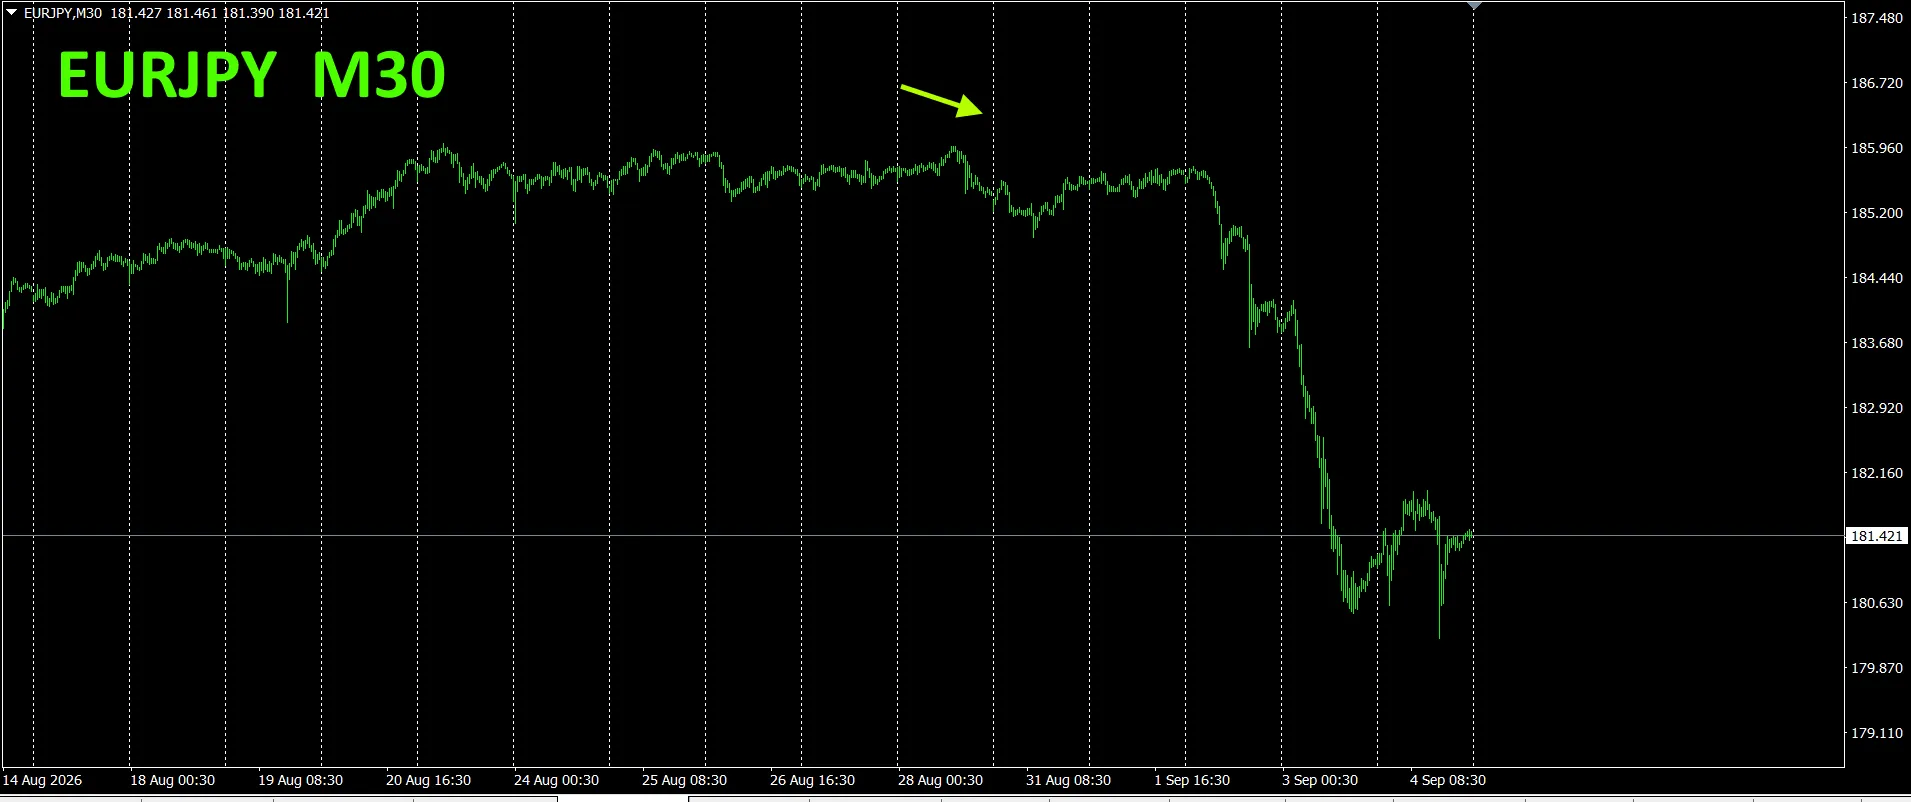
To see the overall flow,about3weeks of recent data are drawn on a 30-minute chart.
Previously,we wrote as follows.
Pinkis EUR,greenis JPY.The EURvector is,pointing downward,JPYis pointing upward. From thecurrency strength chart, EURJPYis,expected to drift downward going forward
More than just drifting,it fell significantly.As the currencyJPYstrengthened, leading to yen appreciation, EURJPYwas likely significantly affected.
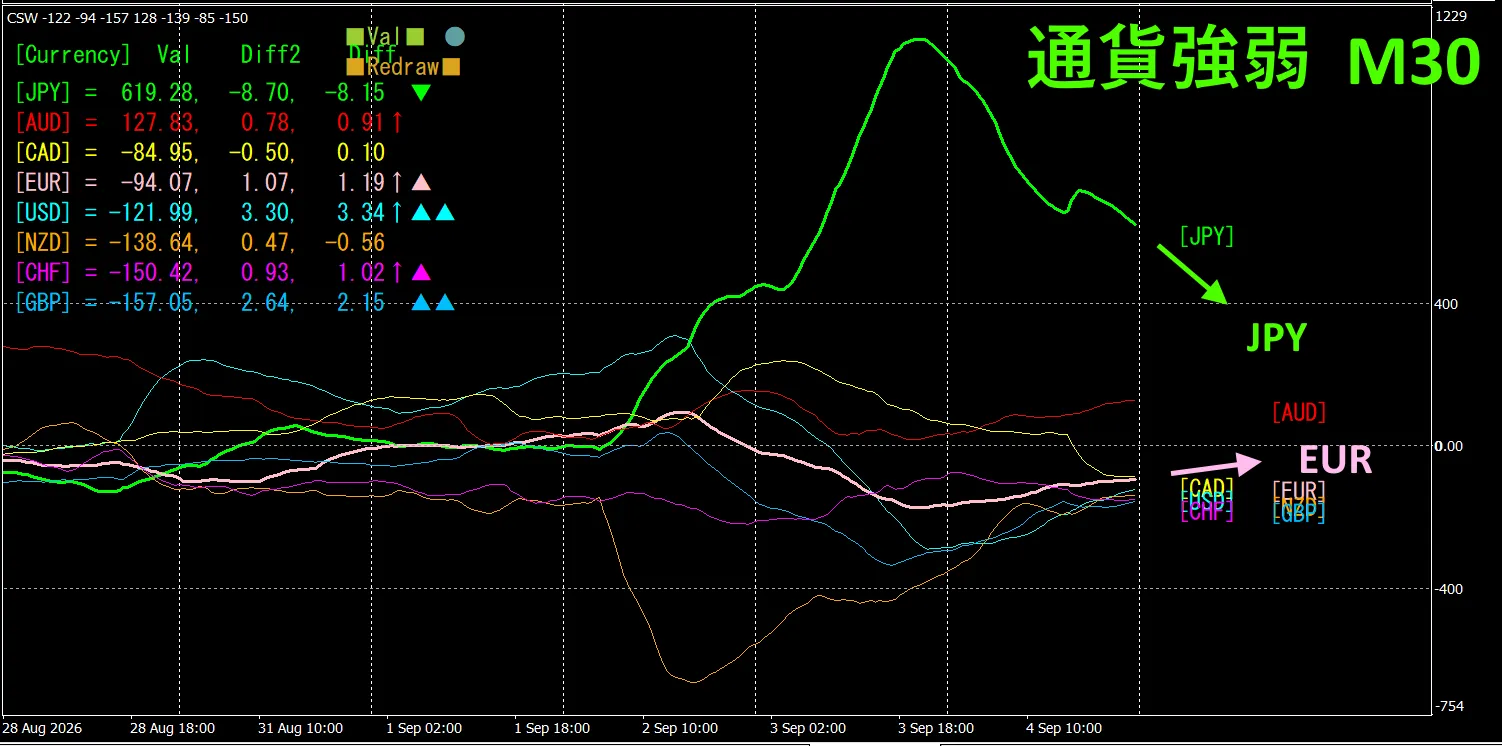
This is the30-minute currency strength chart.
Pinkis EUR,greenis JPY.The EURvector,heads slightly upward from horizontal,and the previously strongJPYturned downward.From the currency strength chart, EURJPYis,expected to rise going forward.
4. Tried a new indicator: Dual_MACD_Trend_Indicator
For the new indicator “Dual_MACD_Trend_Indicator,” see below.
MT4version:https://www.gogojungle.co.jp/tools/indicators/62199
MT5version:https://www.gogojungle.co.jp/tools/indicators/62202
This indicator clearly shows the trend direction using colors.If the color bar isLimeit’s buy, Redit’s sell,making it easy to understand and use even for beginners.If the bar is green, it’s an uptrend,if red, a downtrend,and if there is no color, there is no trend.Because it’s color-displayed,you can grasp the trend state at a glance.
I tried introducing this indicatorto GBPJPYon the1-hour timeframe.
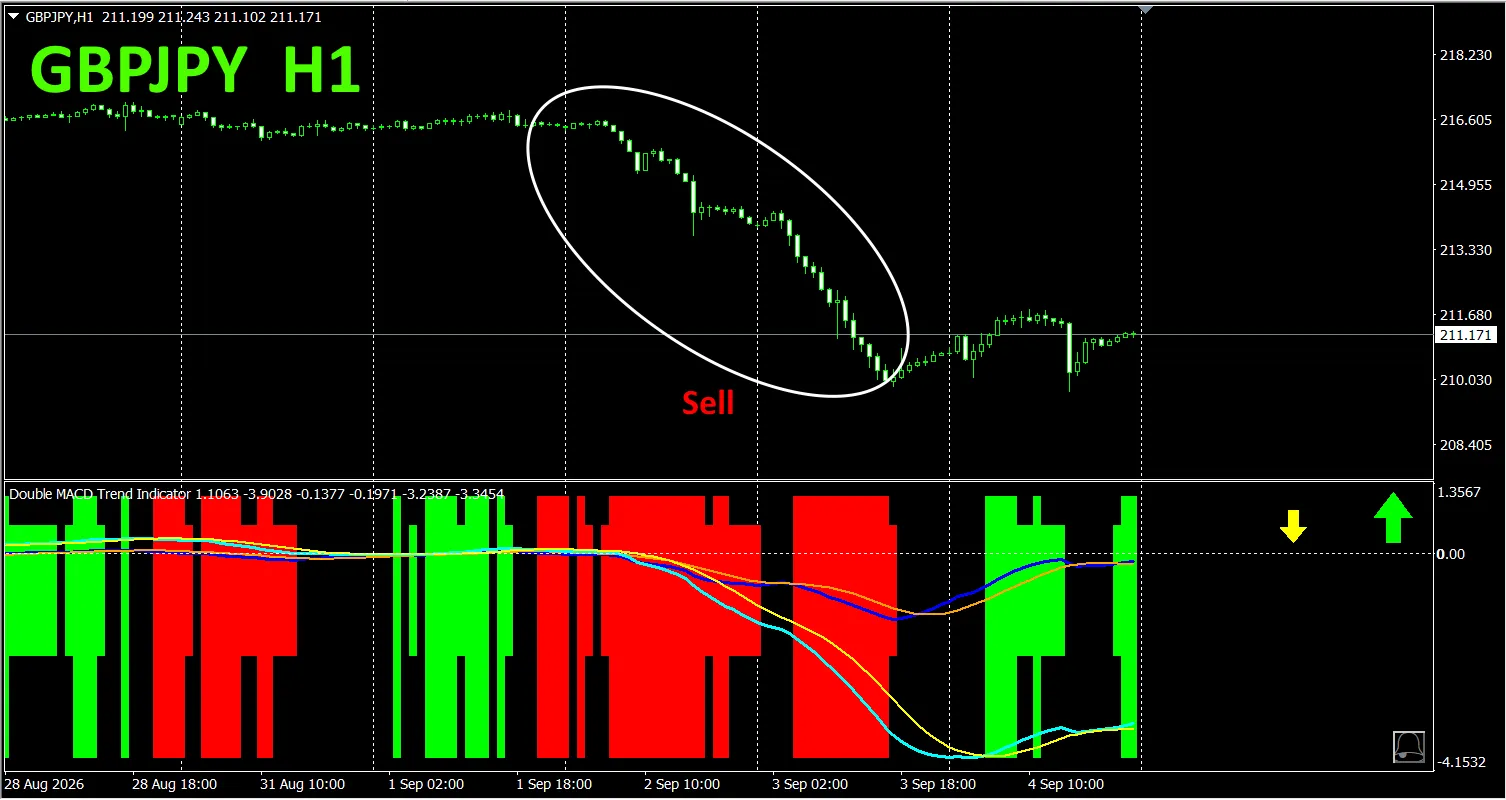
The red sell zones and,green buy zones,are clearly separated,making trading easy at a glance.In the figure above,focus on the sections where price swings up and down with a certain slope,and sell in the areas colored red that are circled with white ovals.
With “Dual_MACD_Trend_Indicator”,the simple rule isbuy in green zones,sell in red zones,and do not trade otherwise.
“Dual_MACD_Trend_Indicator”removes,any confusion about trade direction.
Note,“Dual_MACD_Trend_Indicator”has been upgraded,with 2-stage bar display,and improved to show trend directions of the top2higher timeframeswith arrows.
5. “Trend_Color_MA_MTF”has beennewlyreleased
From the product page
“Trend_Color_MA_Dual_MTF”wasdeveloped to transform your trading.This tool is not just a moving average.It visualizes trend direction“withcolor”,and the moment opportunity arrives“withsound”and“notification”alerts you,serving as your dedicated assistant.
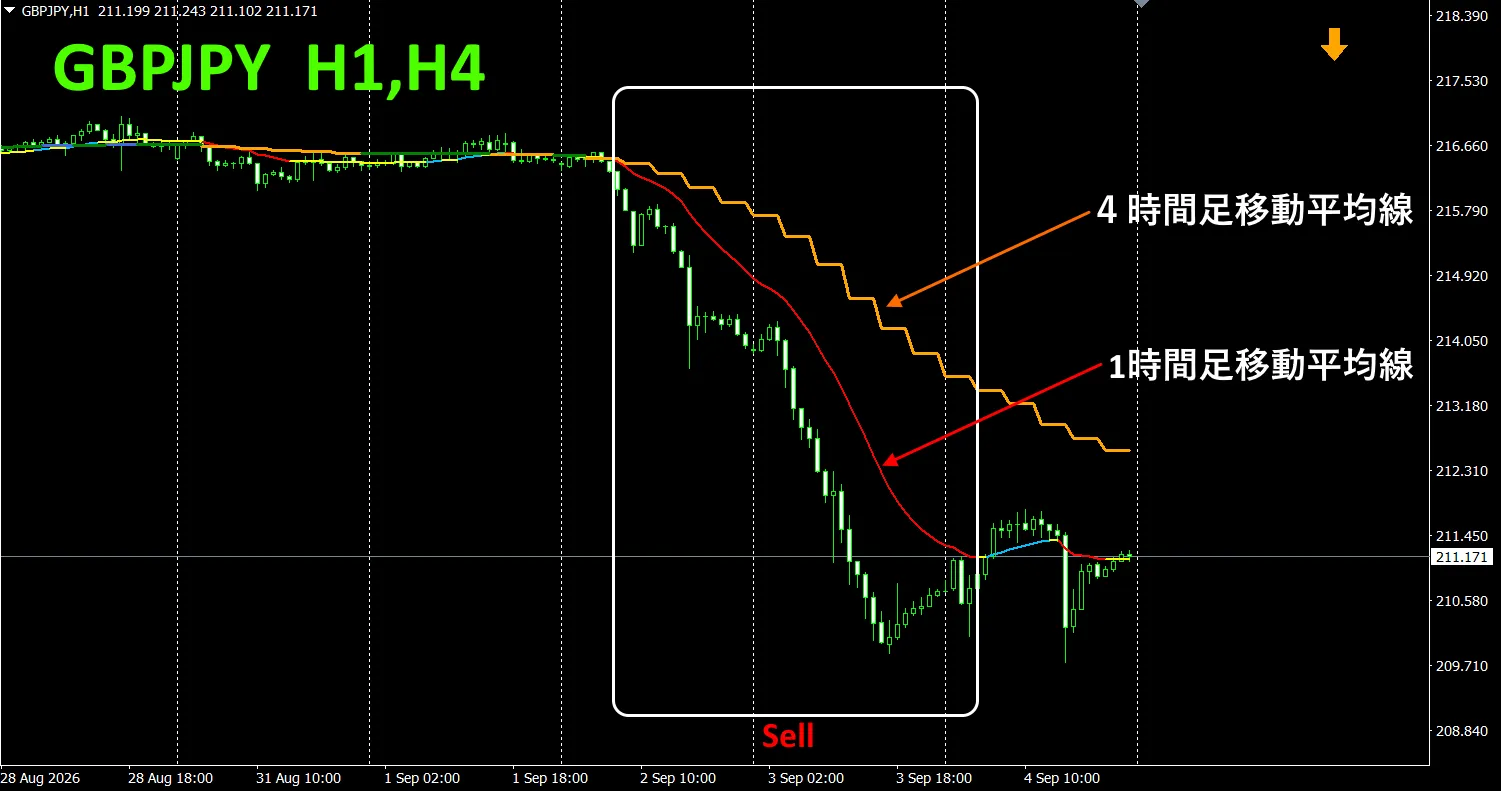
As one example,on the GBPJPY1-hour chart, the4-hour moving average was displayed simultaneously.
The choppy, step-like line isthe 4-hour moving average. The 1-hour moving averageand the 4-hour moving average,are shown in blue tones during rises,and in red tones during declines,so you can instantly distinguish,the current chart’s trend direction,and the higher timeframe trend directionby color
When the higher timeframe and current timeframe colors align,trade short if in red tones,and long if in blue tones.
For a short setup,the 1-hourMAredand falling, the 4-hourMAisorangeand falling—sell at that point.
In the figure above,focus on the area enclosed by the white rectangle and trade short.
For details,please see the following link.
https://www.gogojungle.co.jp/tools/indicators/75985
“8CFDVisualization IndicatorAnyVersion”
https://www.gogojungle.co.jp/tools/indicators/32288
“Toretore Indicator”
https://www.gogojungle.co.jp/tools/indicators/50115
“TrendLine-EX”
https://www.gogojungle.co.jp/tools/indicators/42257
“8CCurrency Strength Visualization Indicator”is,please refer to the following page.

MT4version https://www.gogojungle.co.jp/tools/indicators/39150
MT5version https://www.gogojungle.co.jp/tools/indicators/39159
[My listed products]