Can a space line of nothingness become a guideline for price movement??? Future Prediction Edition
(In the empty space, does the line drawn by a certain rule become a guide for price movement? This is Part 2. Last time it was the pound-yen, but
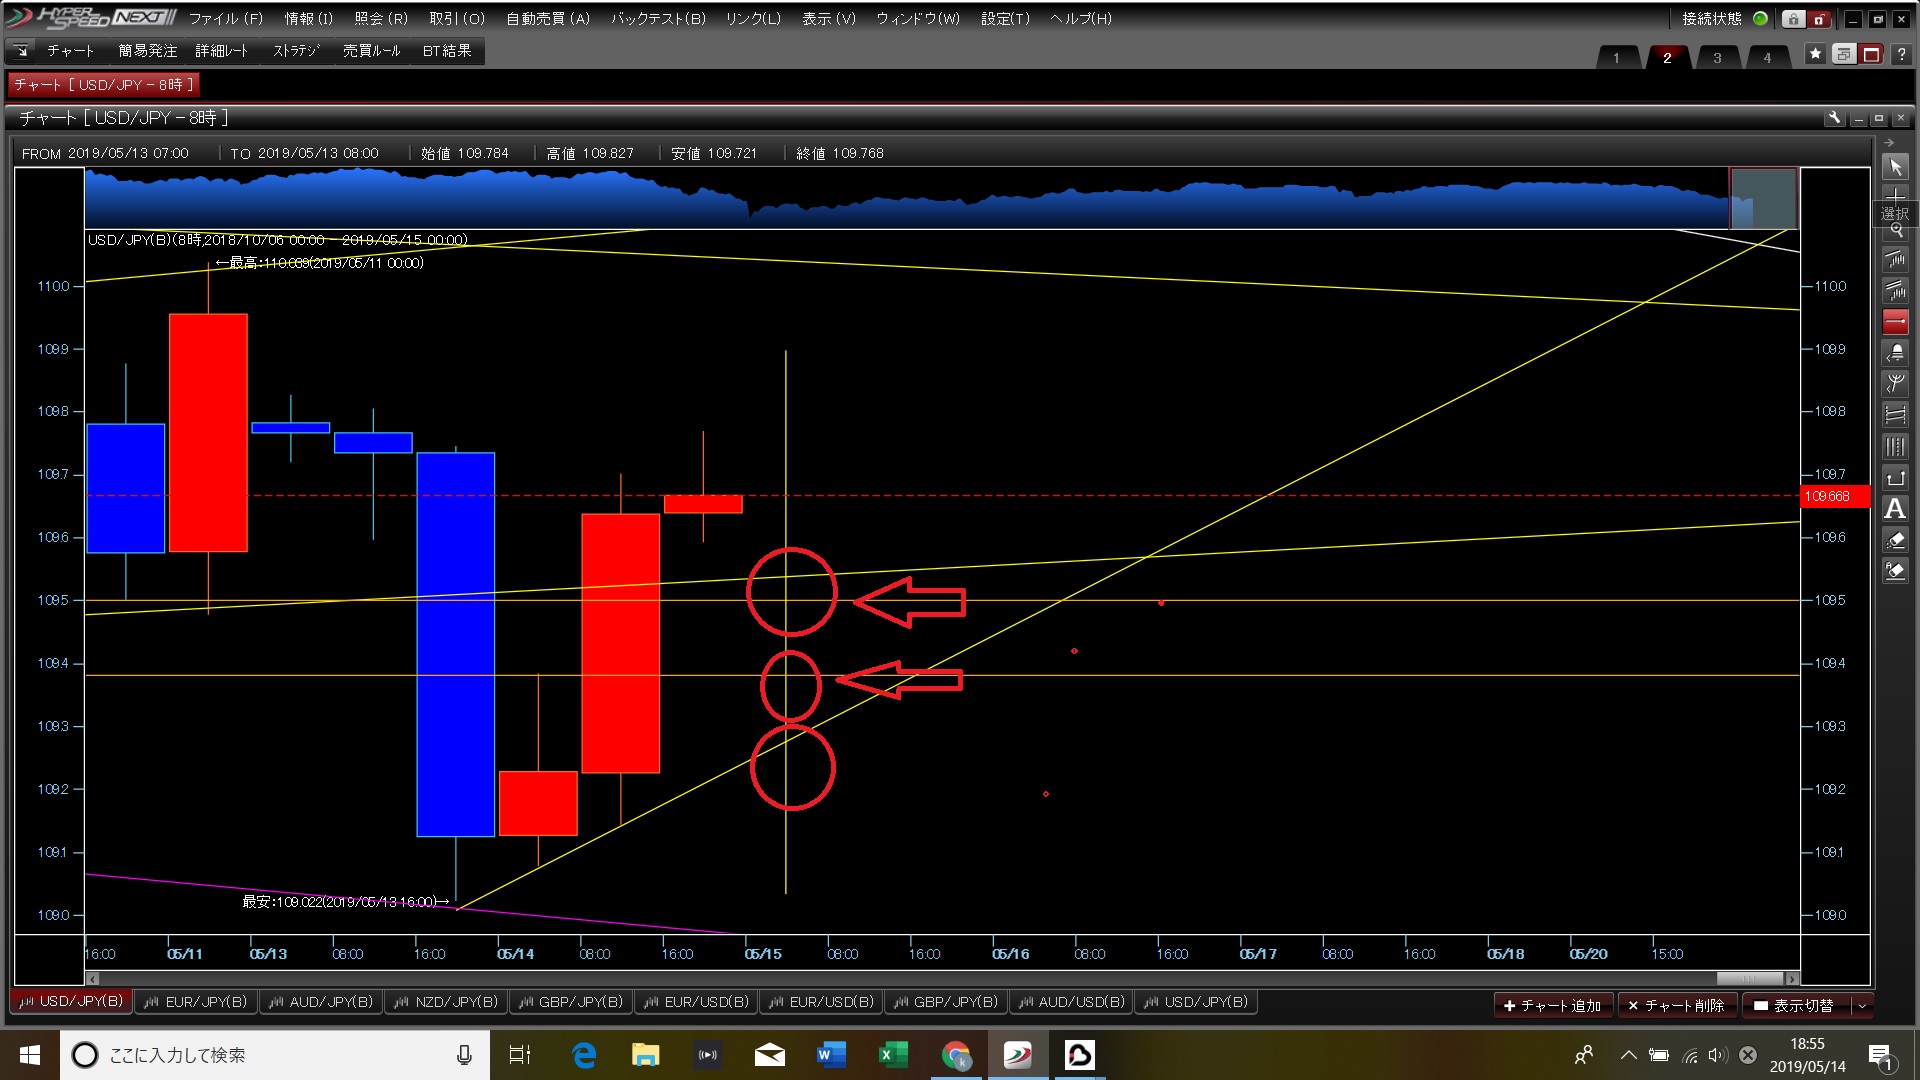
this time it is the dollar-yen. Here is the image right away. This drawing method is taught only in private lessons. Even if you don’t go today, you’ll go soon.
There are two candidates. The final red circle is only indicating a trend line.
In other words, it’s the place to judge a pullback. It is probably spot on, or there will be only a tiny margin of error.
Because it’s a horizontal line, you might think it’s based on the legs, but it’s simply masking with a horizontal line.
With this, our group forecasts a 90% win rate in advance.
As I wrote the other day, it caught the eye of the president of FXON and Y-san, and I’m truly grateful for all the support.