
4-day US employment statistics trade options
2026 Latest Version!!
You can watch the interview VTR with Go Go Jan President Hayakawa and me here
Announcement of new products!!
↓↓↓

For a side note, knowing this method
New Trillionaire Scalping: Volume Plus
FX trading is not ordinary with the hedged position
If you approach it, my daily article in Investment Navigator about reversal moments will clear your mind and help you trade more focused.
Hello everyone.
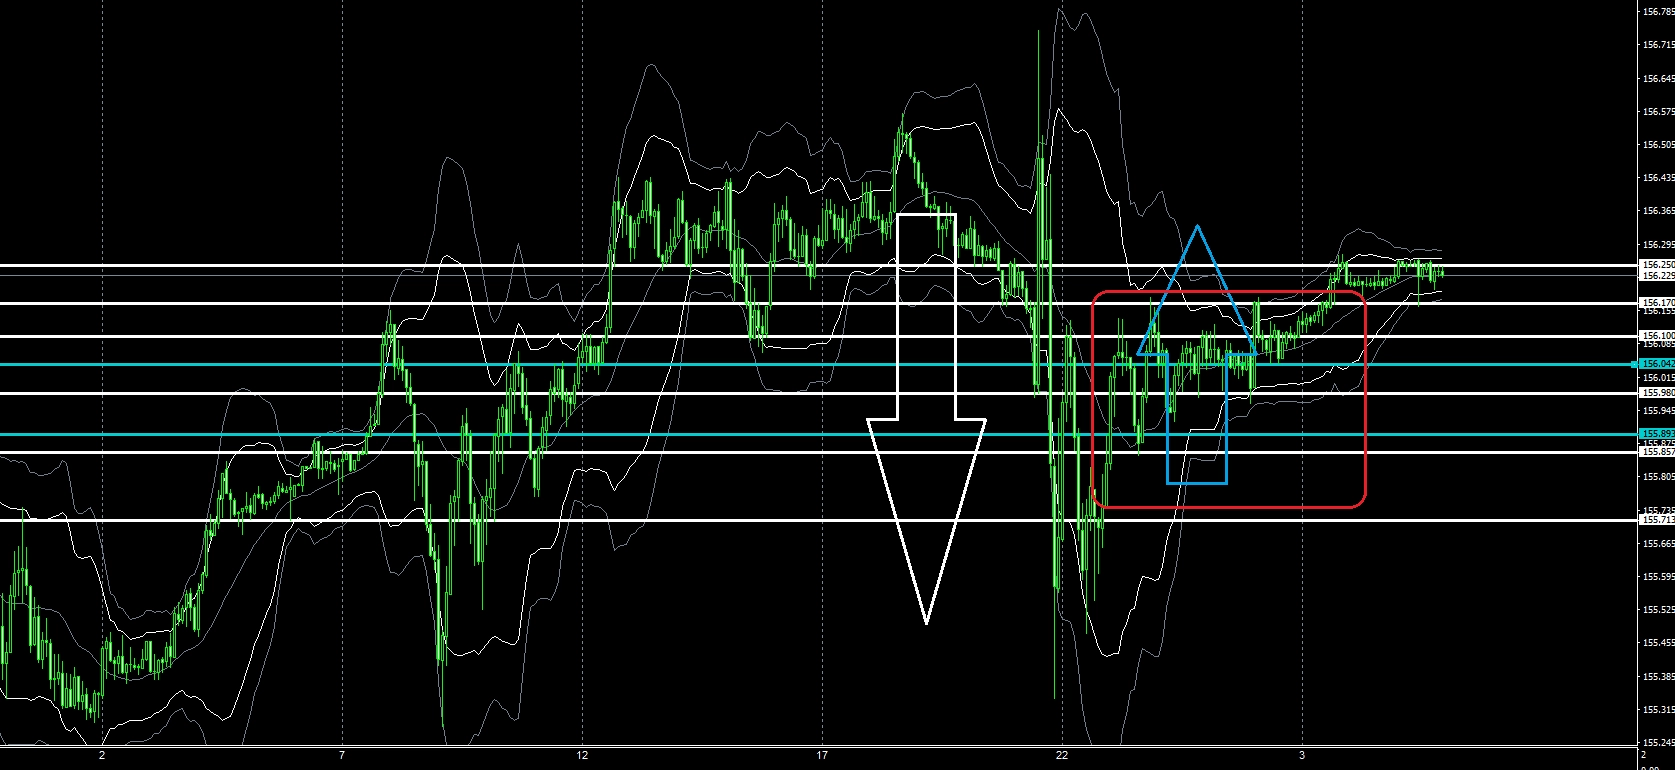
Last night's US employment data showed a clearly erratic swing in the USD/JPY.
USD/JPY 5-minute chart
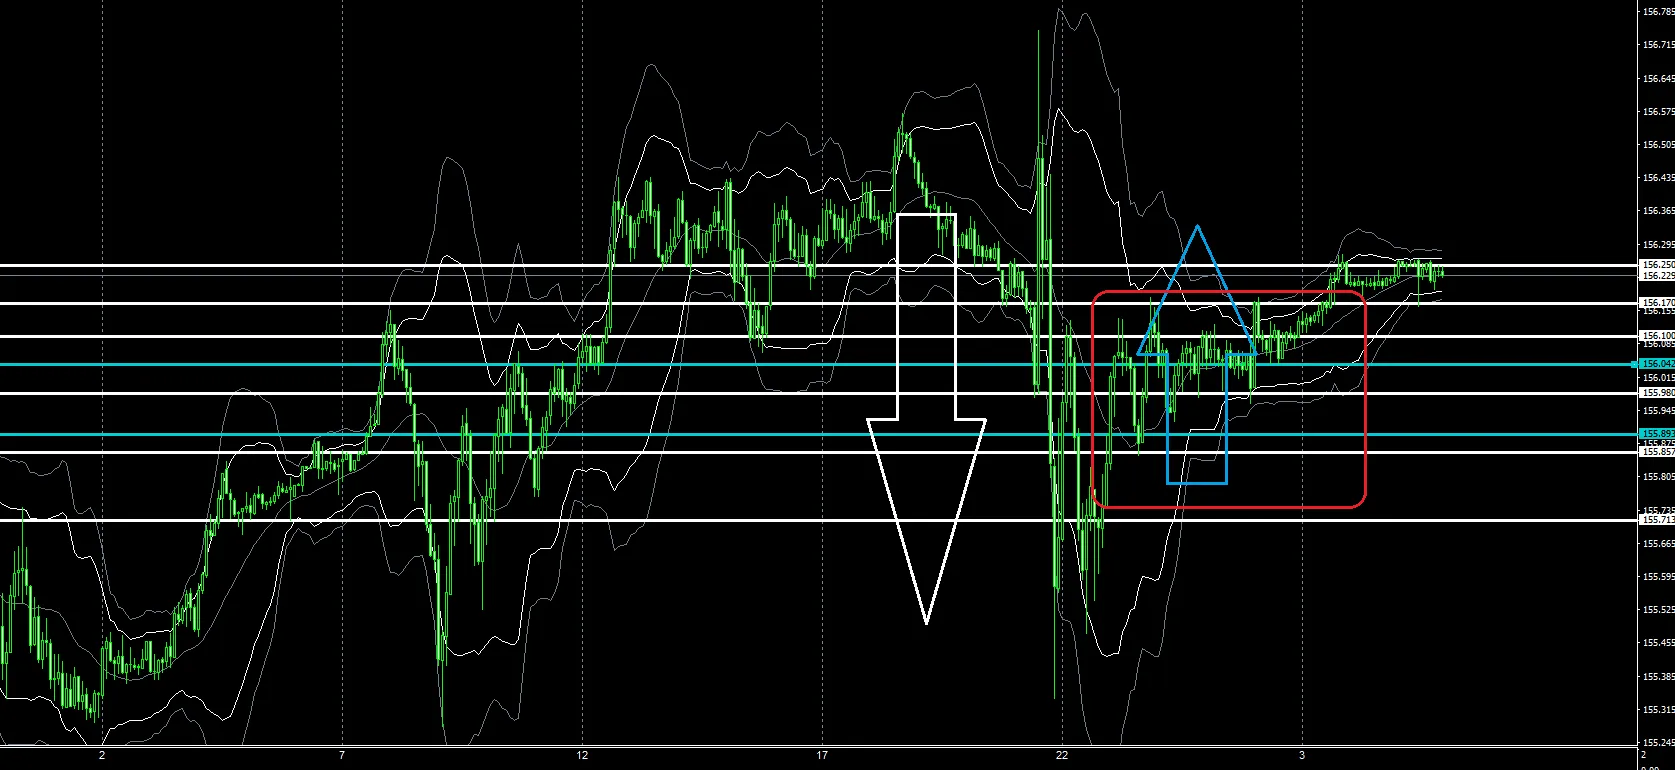
White horizontal line = Billionaire Trader 5-minute line
Blue horizontal line = Billionaire Trader 1-minute chart
Before the employment data, draw the Billionaire Trader lines on the 1-hour, 15-minute, and 5-minute charts up and down, and announce a strategy to take breakout entries on the side that moves more clearly on the shorter time frame.
If possible, it is easier to trade when the big volatility settles with a calm rise or decline on the 1-minute Billionaire Trader line.
If possible, long positions are easier to take.
From past movements after US economic indicators, I assume about 40% S and 60% L positions.
In the case of the dollar, when it is rapidly sold, it tends to rebound rapidly.
Remembering these dollar-dollar tendencies is essential for successful trading.
When I look at charts in real time, selling on the 5-minute chart takes too long, making it hard to take positions.
So a strategy of shorting on a 1-minute chart with a 5-minute Billionaire Trader S-line break is also possible.
Set the stop loss at the next higher Billionaire Trader line, for example.
Or take S positions with an “unusual hedged position” as well.
In this case the volatility is large, so there should be no failure with hedging.
Yesterday's case is good for S strategy as well, but
“If after coordinated intervention the price falls to a low, buy position” would be better to decide in advance.
This is the image of the article I wrote this morning.
If it rises instead of falling here, then no-trade means there was no buying strategy.
Not taking a position means no win or loss, so you can have a clean weekend.
Rather than trying to predict which way it will go and trade accordingly,
・If it goes up, do this
・If it goes down, do this
This is what you should decide before the data release.
Even if you enter positions based on intuition or momentum when the data moves, if it goes well that's good, but the damage from failures is large.
It will stay in your memory and negatively affect future trades.
In particular, economic indicators have disclosed release times, so you can prepare in advance.
I think advance preparation is important.
Once prepared, what's next? Methods?
Continues, so I believe a complete set of techniques is necessary.
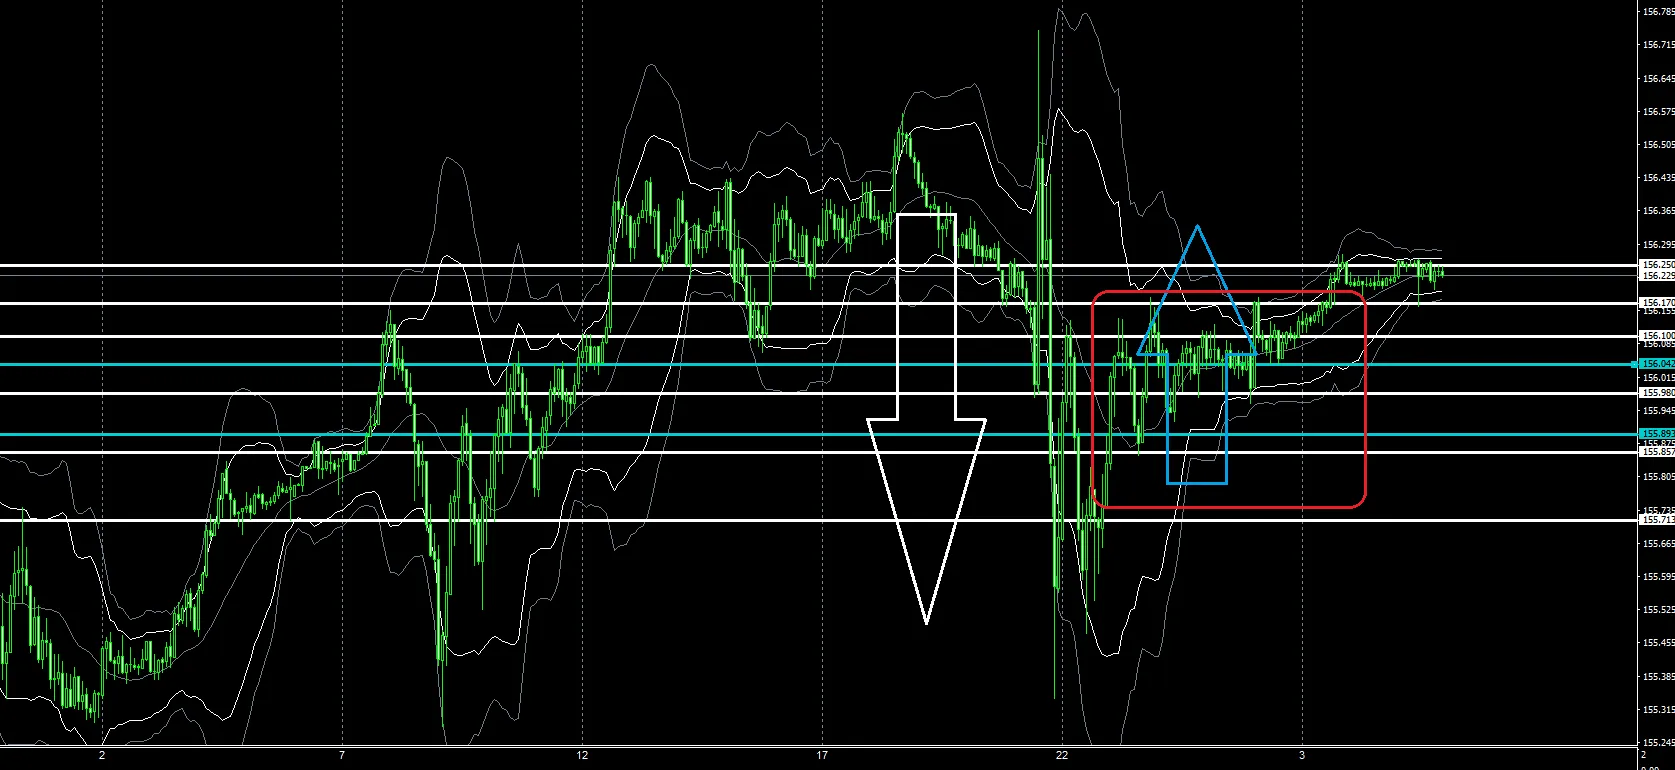
Around 11 PM, the 1-minute Billionaire Trader chart turned to a buy.
Red square zone.
Even on the 1-minute or 5-minute chart, starting long from the blue Billionaire Trader line could have led to a good trade.
As movements calmed, one could have waited without rushing, then targeted a pullback or breakout.
I like and am good at buying on pullbacks using Billionaire Trader lines.
Breakout lines are waiting above and below, so when it pulls back to touch the lower Billionaire Trader line, take a position, then take profits on the touch of the upper Billionaire Trader line or on a breakout.
Breakouts and pullbacks seem to go hand in hand.
If a long breakout leads to a higher price or stall and stop loss, then calmly look for a pullback using the lower Billionaire Trader line.
Billionaire Trader users, focus on pullbacks and watch the Billionaire Trader lines.
I believe you can enter positions at the perfect timing.
Anyway, for traders who want to succeed in trading and make a living, this is my recommended product—also something you can learn independently—these trading techniques are below: