

2026/9/5 Dollar/Yen, Gold, SP500, and Nikkei 225 environment

For verification, we provide a weekly video of USDJPY price movements.
USDJPY
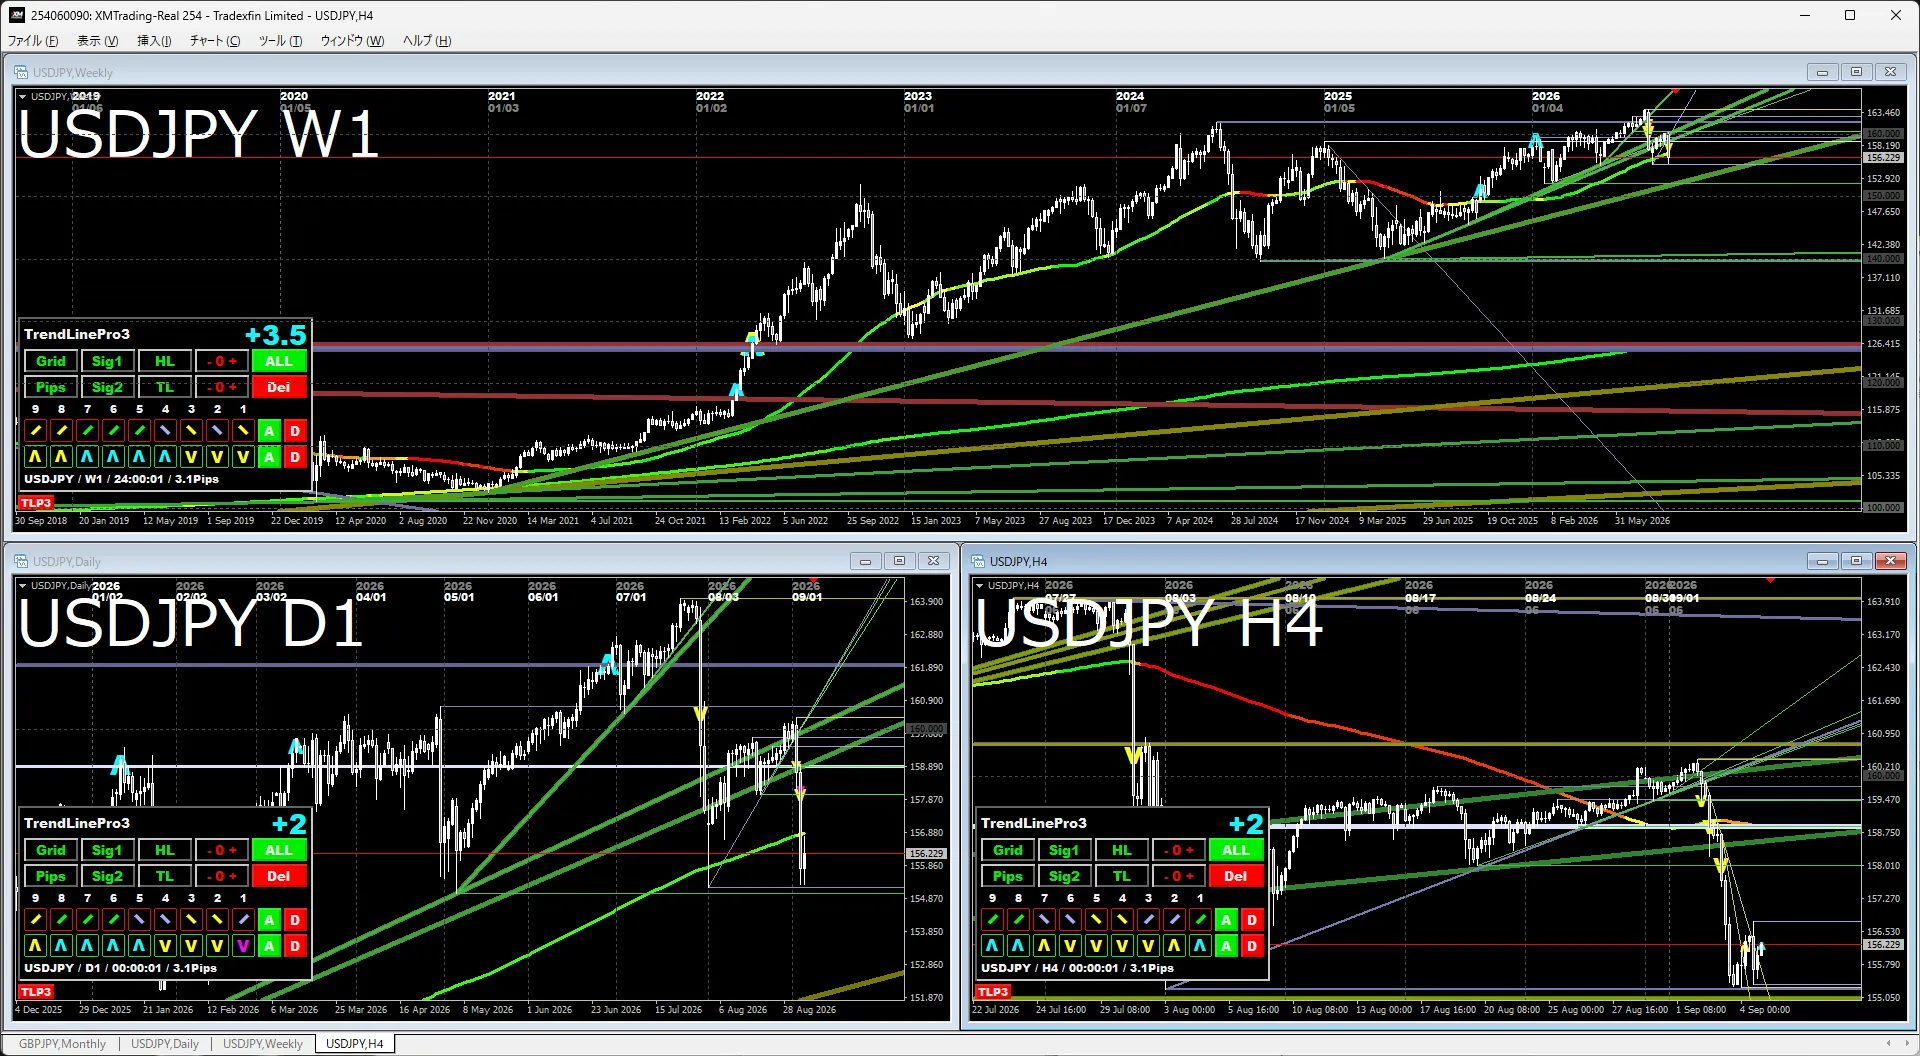
Daily / 4-hourIt is testing a new support level again, maintaining a borderline upward trend. I do not think they will push through this level with intervention, so whether it breaks lower or holds will be up to the market's judgment.
Gold
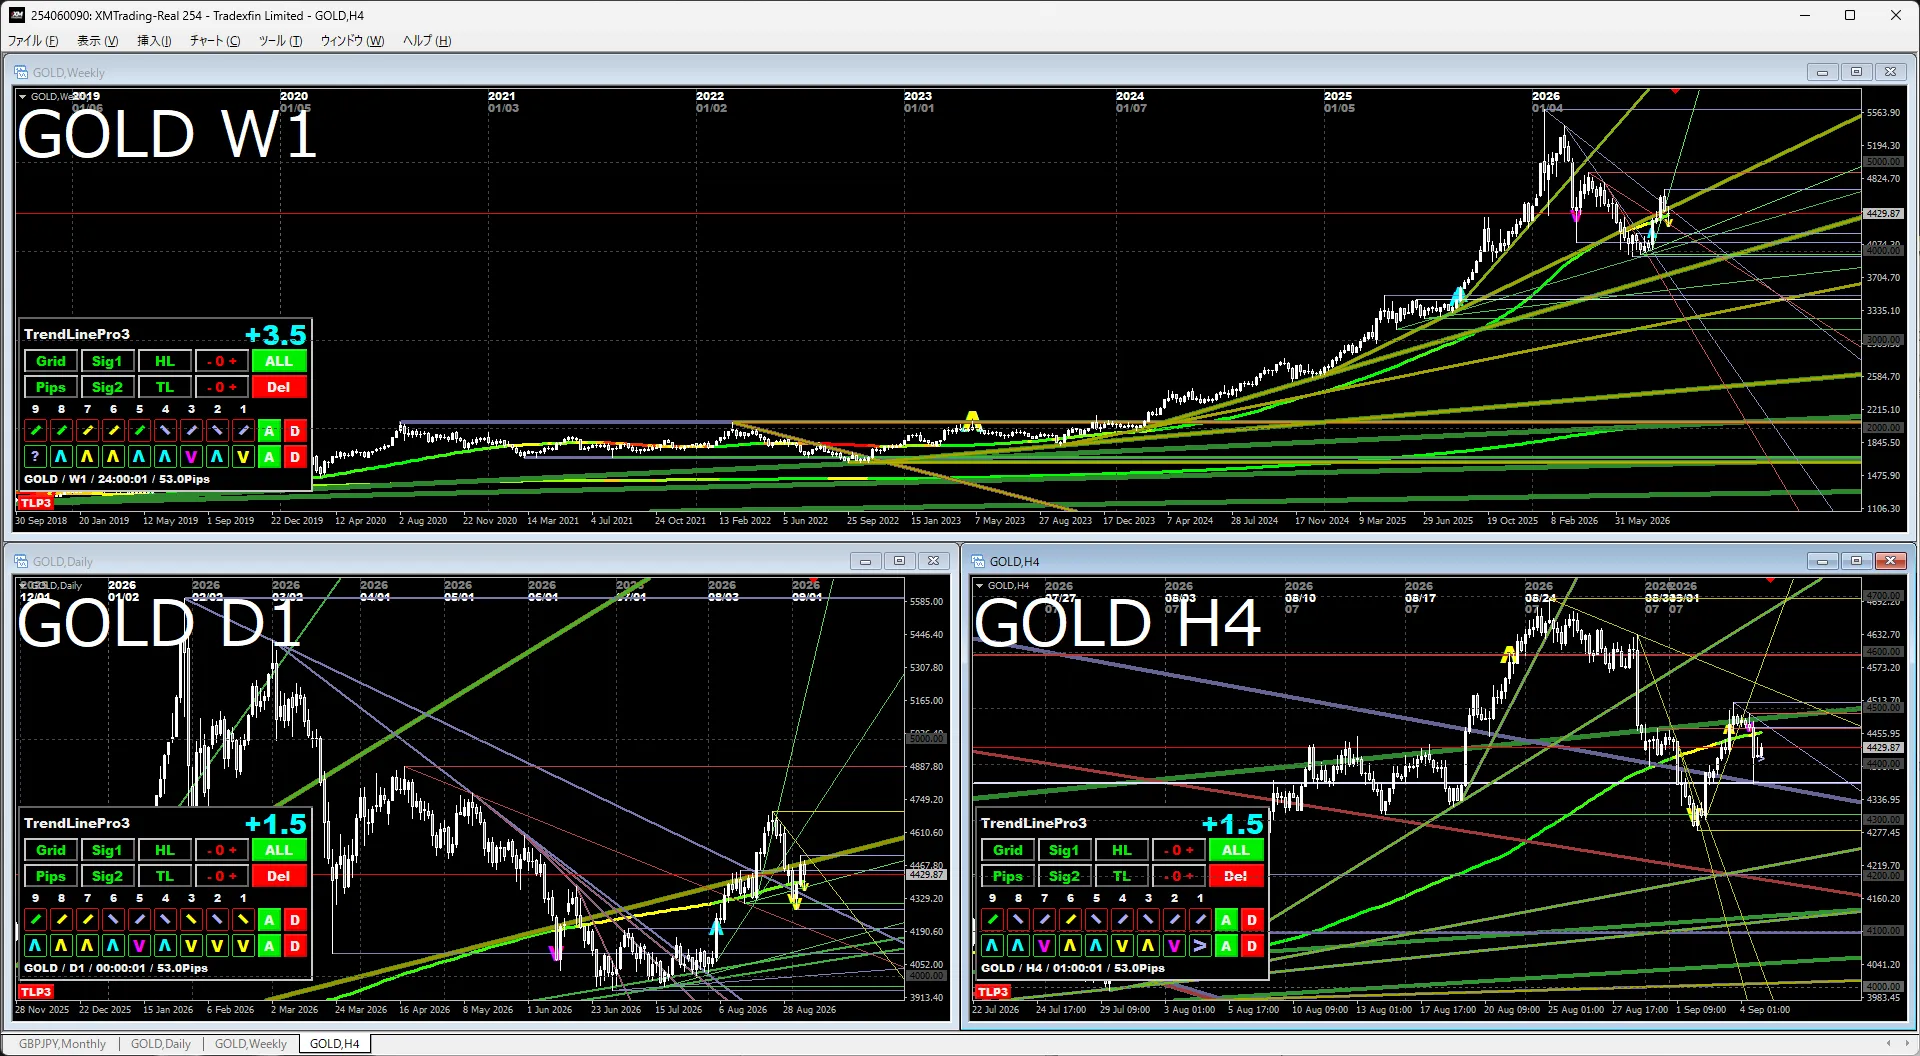
Daily / 4-hourRecent high and low on the 4-hour chart have become noticeable levels, making it easy to anticipate which direction it will break. In the near term, there is still no clear sense of direction.
S&P 500
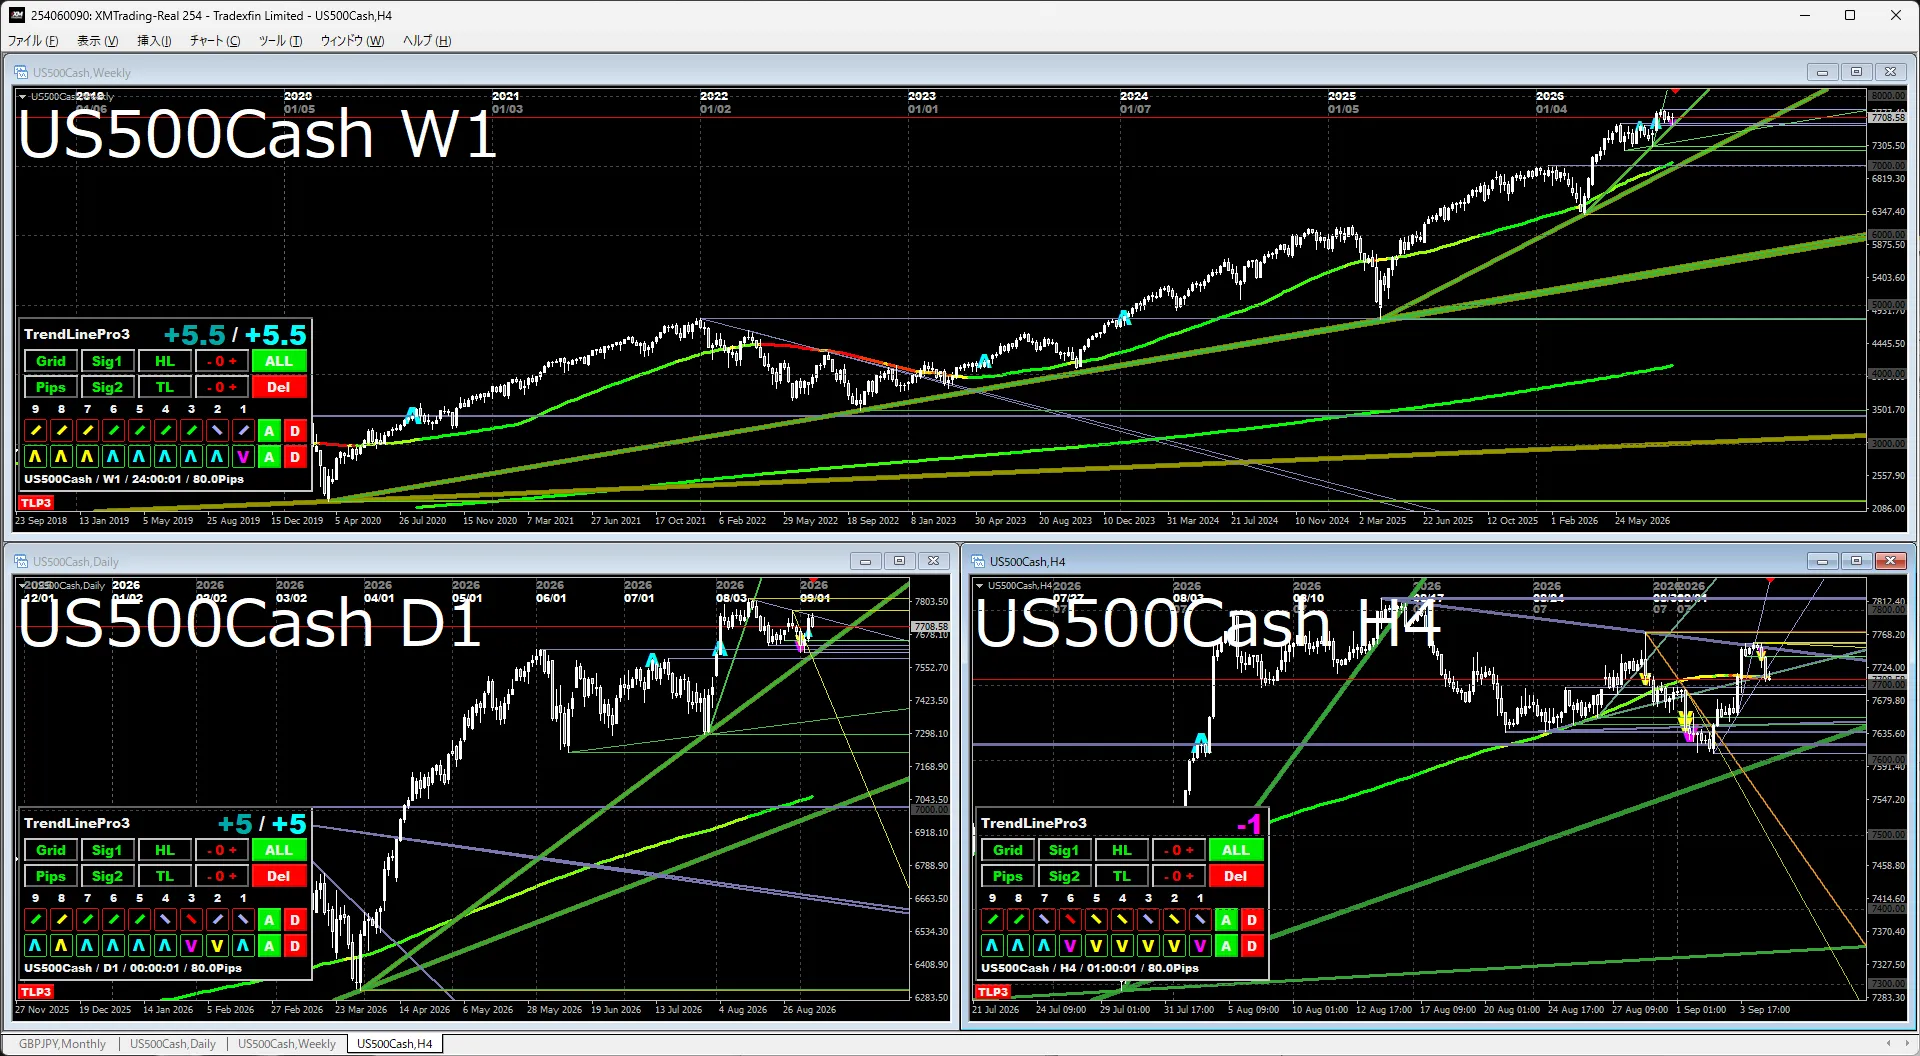
Daily / 4-hourIf it does not rise to new highs soon, it may test the downside. If it breaks the daily uptrend line, caution is warranted.
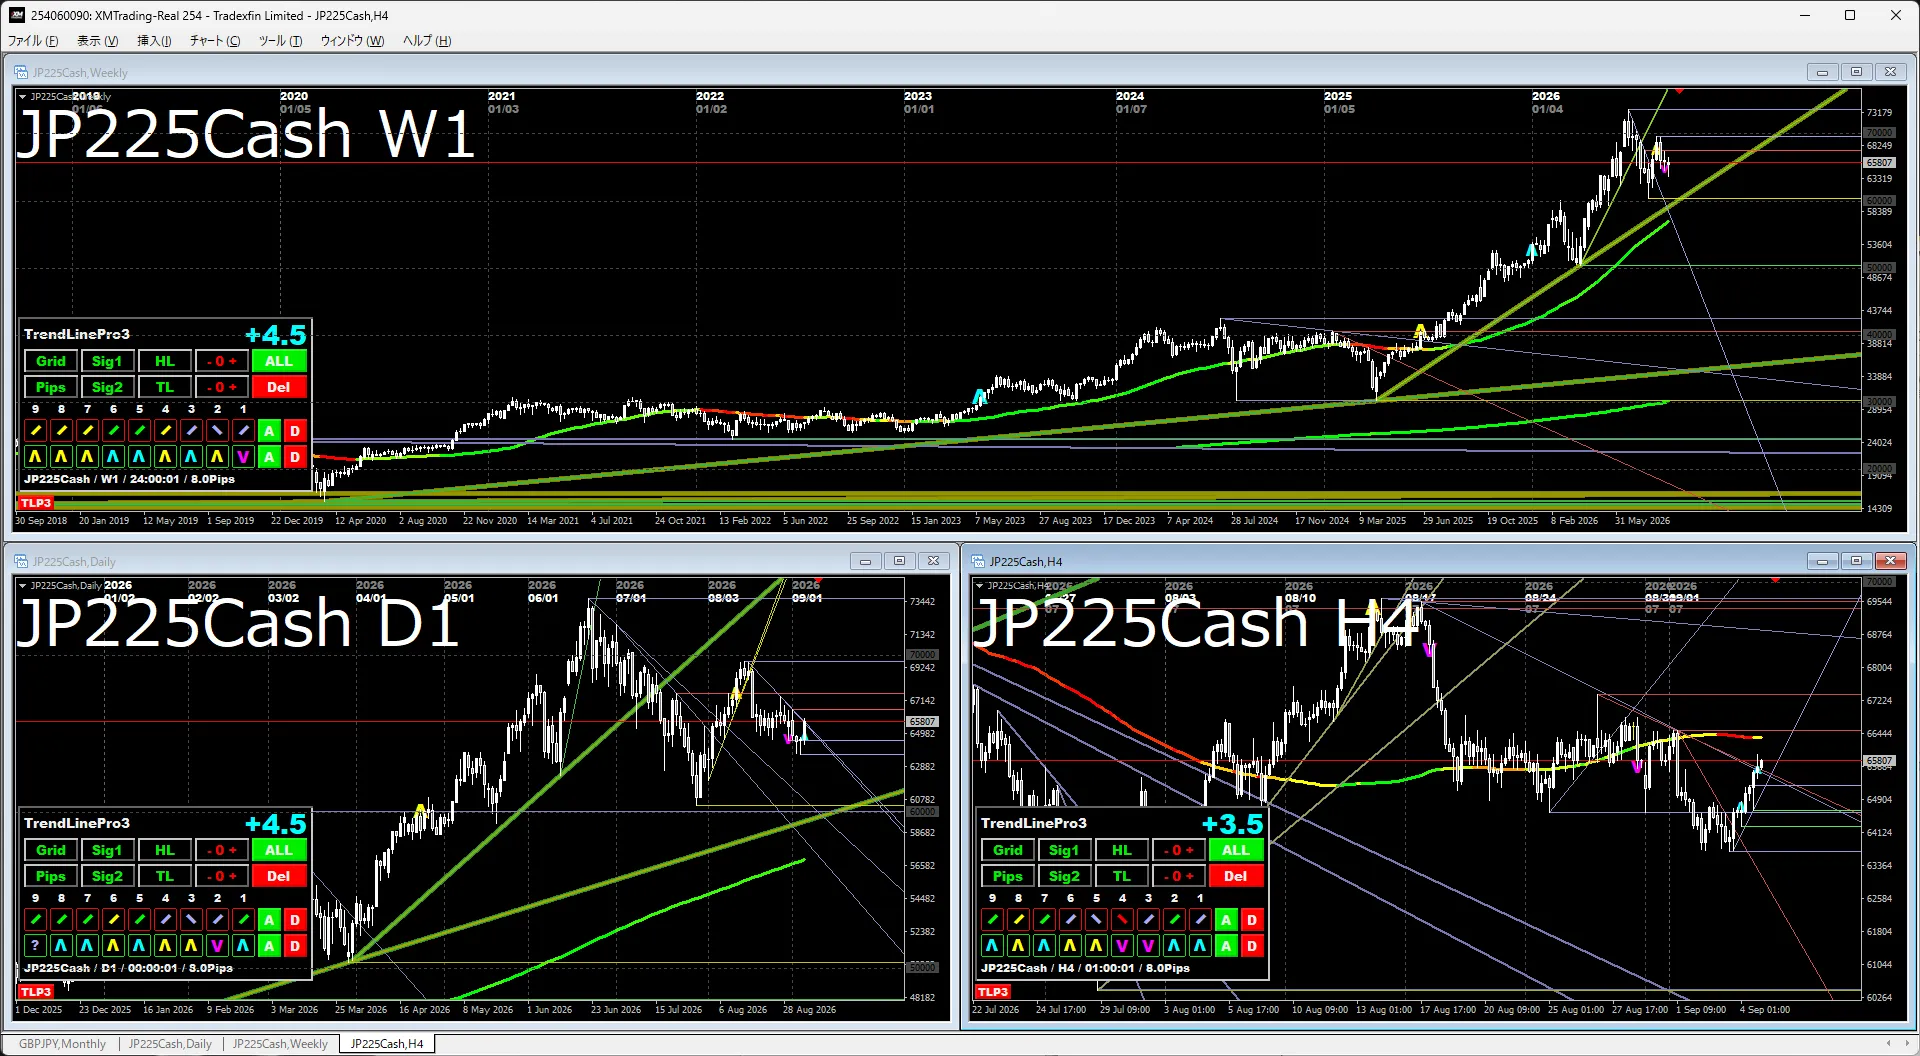
Daily / 4-hourIt seems likely to target the daily high, but there is currently no clear direction in the near term. Since it has broken above the trendline, buying may be warranted or at least be cautious.
The attached image shows the indicators used below.
If you are interested, please take a look.