
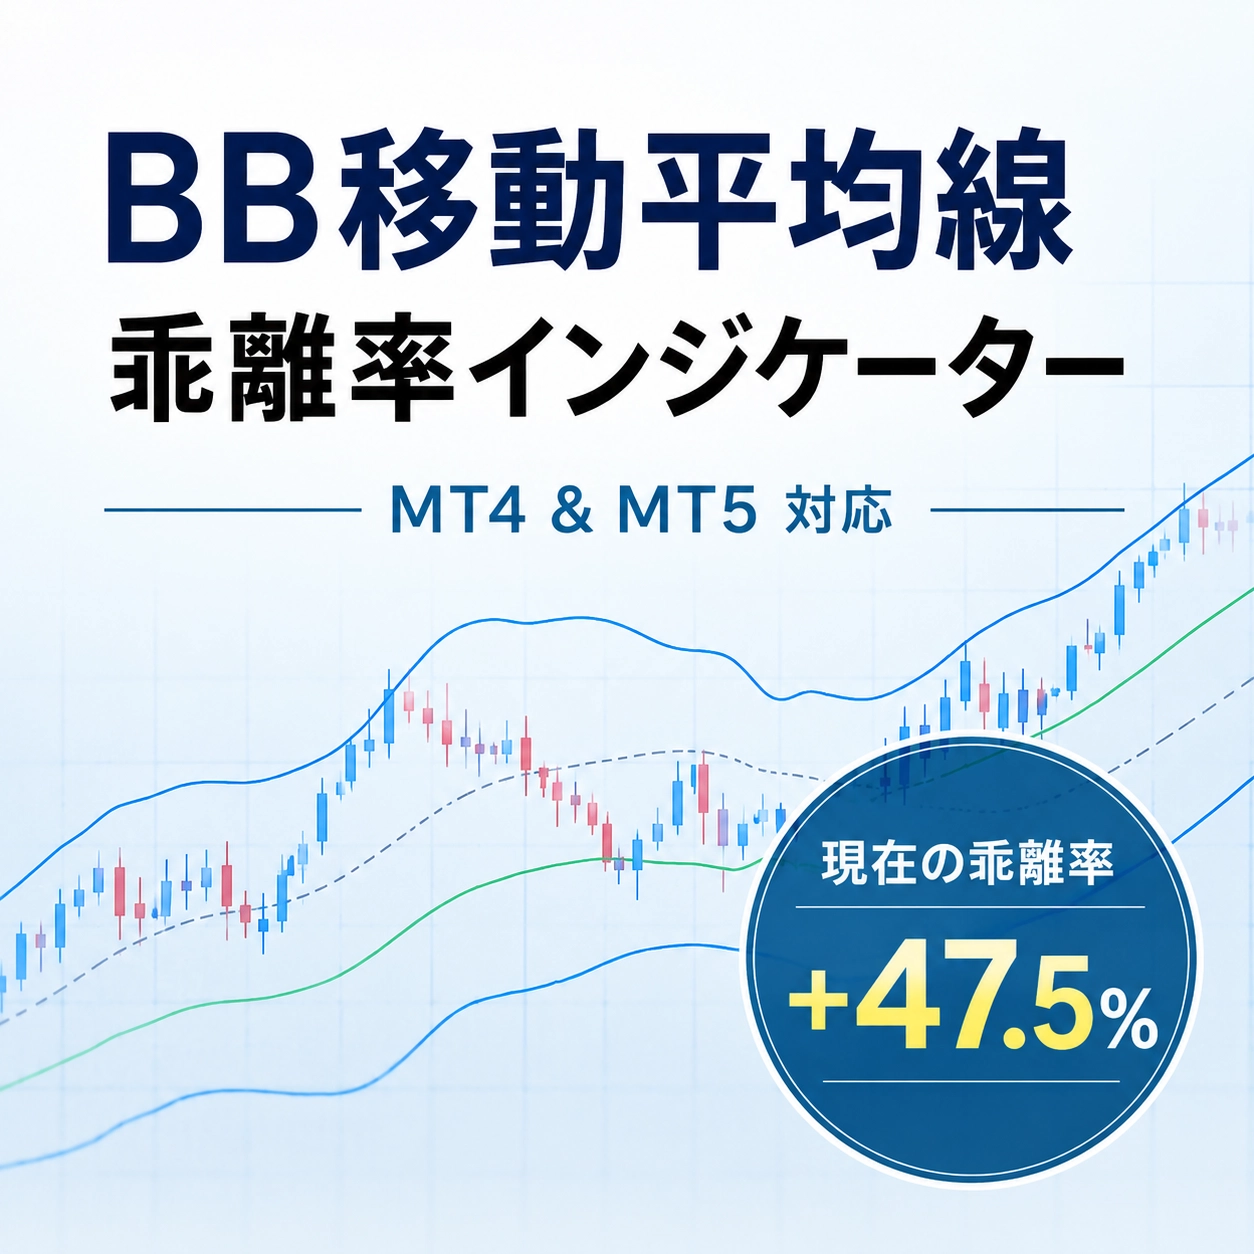
BB Moving Average Deviation Rate Indicator
This makes it discernible.
Divergence Indicator
to judge more intuitively via this indicator.
While watching the chart,
“It might be returning soon.”
“But is it really deviating that much right now?”
Have you ever wondered about these things?
On the chart you can see the distance between price and the moving average. However, relying on eye judgment alone tends to become“a hunch”.
That’s where thedivergence ratecomes in.
But normal “MA divergence” is surprisingly hard to read.
With typical divergence, you can see how many percent the current price is away from the moving average.
For example,
is displayed.
You understand the number. The problem is,
Or small?
Is 1% too far?
What percentage should you use as a standard in the current market?
That’s the issue.
The magnitude of price movement varies by currency pair, instrument, time frame, and current volatility.
So I thought,“Can’t I judge divergence more intuitively?”.
BB Moving Average
Divergence Indicator
This indicatorquantifies the distance between price and the average using Bollinger Bands.
It doesn’t just show “how many percent price deviates,” but, considering current market conditions, makes it easier to confirm how far price deviates from the average in a more intuitive way.
The display is very simple.
If the current price deviates upward from the average,
If it deviates downward from the average,
This is how it’s displayed.
While looking at the chart, you don’t need to estimate each time, “how many pips away from the moving average.”
You can verify the current divergence status numerically right away.
This indicator is not just to mechanically decide, “buy because it’s at ○%,” or “sell because it’s at ○%.”
It’s a tool to understand how far the current price deviates from the average,
and to use that information as part of discretionary judgment and backtesting materials.
There is meaning in the information that the price has deviated from the average.
In the market, after the price moves far away from the average price, it often returns toward the mean (mean reversion).Mean reversioncan occur.
Of course,deviation does not guarantee price will return.
In strong trends, prices may continue moving far away or diverge further.
I believe this use is important.
Not just the “current” situation. Past divergence can be checked as well.
In this indicator, in the sub-window,the divergence rate history from past to presentis displayed as a line.
This allows, for example, to understand,
✓ In my entries, what percent divergence was common?
✓ Is there a difference in divergence between winning and losing trades?
✓ In similar past divergence states, how did price move afterward?
and other checks on the chart.
What I particularly want you to use is “verification.”
In discretionary trading,
Such judgments can be made.
But then you cannot verify afterward.
So,
Then,you can move your subjective buy/sell decisions toward verifiable rules.
For example, here are some possible uses.
Check large divergences numerically and combine with other technicals and price action to decide.
When price is extending strongly in the trend direction, check how far it currently deviates from the average.
In a trend, observe the relative position of price and the moving average and the contraction/expansion of divergence.
Investigate moments when a specific divergence rate was reached and verify subsequent price movement.
Replace vague judgments like “quite far away” with explicit conditions such as “○% or more.”
Recommended for these people.
Both MT4 and MT5 users can use it.
to “divergence of +○%.”
The chart has a lot of information that you can understand just by looking.
However, without a solid basis, it’s difficult to compare or verify.
That’s whyturning intuition into numbers.
By measuring the distance between the current price and the average as a number, you add new perspectives to discretionary judgments and past verifications.
This indicator is especially recommended for those who found ordinary MA divergence hard to read.
※Indicator display is information to assist investment decisions.
※There is risk of loss due to price fluctuations in FX, CFDs, etc. The final investment decision is your responsibility.