

The USD/JPY could be traded yesterday with the new product, right?
2026 Latest Version!!
Here you can watch the interview VTR with GoGoJIAN President Hayakawa and me
This is information about our new product!!
↓↓↓

I have monitored and verified for over ten years, including preparation and review, and decoded the methods used by extremely skilled FX traders.
It's not exaggeration to call it a decoding; it simply means “these are the methods being used.”
What is said to be a “method” is not something rare, secret, or unknown to the world.
If such a thing existed, the person who releases it would be ???.
Even if the methods can be adjusted from various angles when searched as a product, what I deliberately chose for this product is that you can verify it based on the content disclosed on Toreai (Toreai system).
As I have monitored and verified what can be confirmed for years, I arrived at this “method.”
If you aim to achieve this result, it would require a lot of time and effort, so by buying this product you will instantly understand the “how-to” and the “method.”
You can find Major League Baseball star Ohtani’s swing videos anywhere, so you can roughly tell from here how he swings downwards.
But in reality, depending on the pitch type and other factors, whether you consider the top as a reference cannot be understood unless you ask the pitcher or someone who can explain it.
What I can confidently tell you is that this is the trading method used by current FX super traders.
As a side note, knowing this method...
New Millionaire Trader Scalping: Volume Plus
FX trading: non-traditional hedging
If you tackle it, my articles in Investment News about reversal moments will clear your head and help you focus on trading.
Yesterday’s USD/JPY movement was about 100 pips.
It seemed to move quite a bit, I think.
USD/JPY 1 hour and 5-minute chart
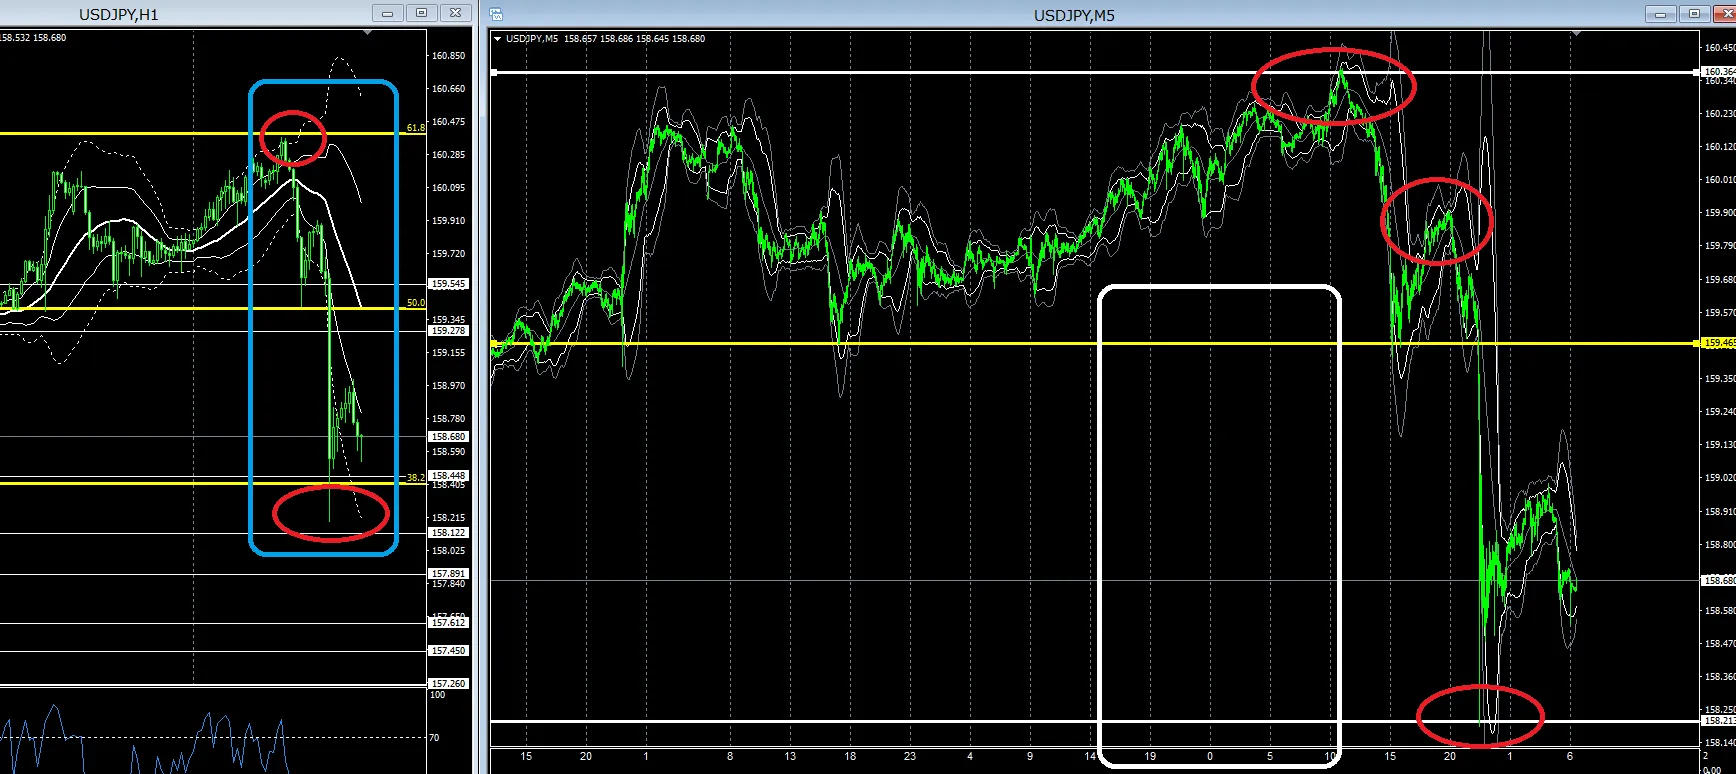 The movement started from the reversal moment that I always write about in my articles.
It is quite important to imagine the red circle as a trading point.
Sell high, buy low—that is the basics of FX trading, right?
Selling high, thinking to sell at high points, leads to breaking the 5-minute white □ zone with the Billionaire Trader charts and lines.
First, the key is how to judge the red circle scene; the judgment method of reversal moments I always write about in Investment News,
and this time, by learning the method of using the 4-hour chart that “Super Traders” look at as a new product, you can simply set stop loss, take a position, and trade effectively.
As for the market, it was said that Bank of Japan Governor Ueda was summoned to the United States...
Japan should raise rates!!
Or so they say...
Whether yesterday’s decline was the result, I do not know.
As a trader, what matters is that the chart moves, so the reasons do not matter.
If it fluctuates wildly or creates a trend, trading becomes easier, so I hope the USD/JPY swings a lot.
Even today, assuming a price range of about 1 yen, by the end of the Tokyo session, around what range will the price be when you’re home in the evening?
Please first check that.
How far will it recover today?
To around the 159 mid-area of the 50% line?
If it continues to fall, will it break yesterday’s low?
We will be mindful of that as we search for the reversal point moving inward.
Thank you for your continued support today as well.
For traders who absolutely want to succeed in trading, who want to make a living from trading, the recommended product is this—also a self-study capable trading technique: below it is the proof: