
This is the FX method discovered by verifying the trade histories of the "Holy Grail" super traders
2026 Latest Version!!
You can watch the interview VTR with GoGoJyan President Hayakawa and me here
Announcement of new products!!
↓↓↓
I have spent more than a decade—from preparation and review to monitoring and verification—decoding the techniques used by ultra-skilled FX traders.
It's not grandiose to call it a decryption; it's simply understandings of "this is the technique being used."
What is called a technique is not something special, hidden, or unknown to the world; all such things already exist.
If such a thing existed, the person who claims it would be a ???
The methods I can present as products are adjustable from various angles if you search for them, and you might be able to view them as techniques; however, the reason I made them into products is that they are content that you can verify based on what is disclosed on Treasure Trader (Tréai).
After monitoring and testing what can be verified for many years, I arrived at this technique.
If you want to achieve this result, it will take a lot of time and effort, so by purchasing this product you will instantly understand “how to do it” and the “technique.”
You can find swing videos of MLB superstar Ohtani anywhere, so you can roughly tell from here how he swings down like this.
But in reality, depending on the pitch type, where the top is used as a reference can only be understood by asking the person or by someone who can explain it.
What I can tell you confidently is that this is the trading method currently used by FX super traders.
As a sidenote, knowing this method
New Millionaire Trader's Scalping, Volume Plus
FX Trading Not Your Average Hedging
If you tackle this, you’ll clear your head about the reversal moments I cover daily in Investor Navi and you’ll be able to trade with focus.
Yesterday's USD/JPY price range was about 60 pips.
Overall, it felt like it moved quite well for a Monday.
The movement followed what I described in yesterday’s article.
I write daily forecasts for USD/JPY on Investor Navi, but I am not writing carelessly.
I forecast based on the new product methods and the Millionaire Trader chart that has just been released.
Even readers who love Investor Navi can build original methods just from Investor Navi articles, you know.
I believe time is important, so to shorten the time and effort for you to verify and obtain results, I sell my methods and those systemized products. I hope you can regard me as an outsourcing partner.
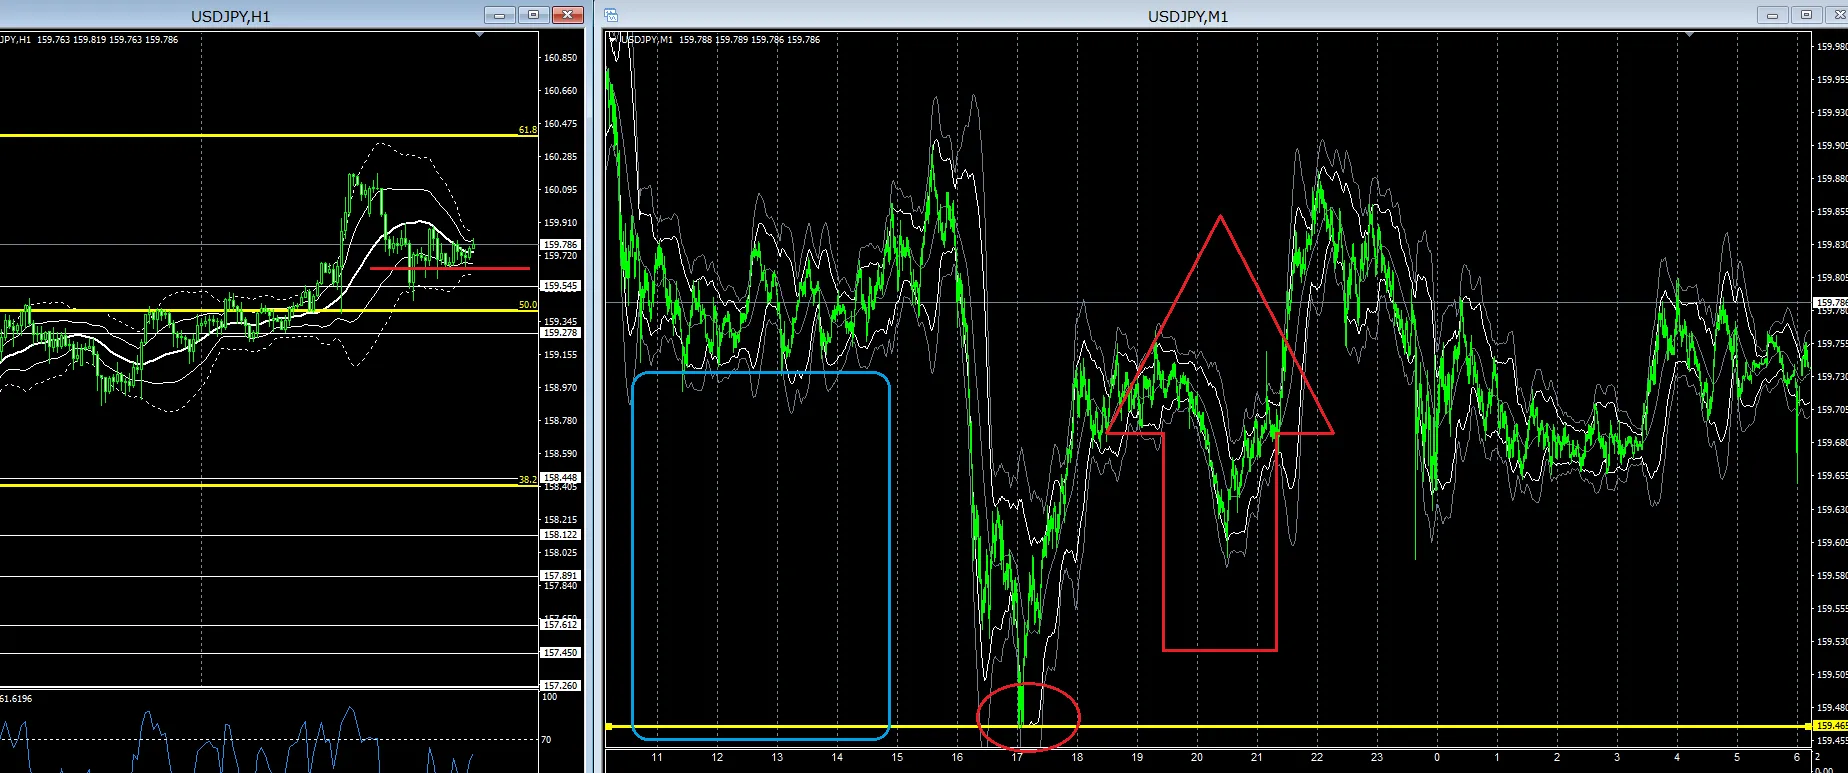
As I wrote yesterday, it has entered the blue □ zone on the 1-minute chart.
The V-shaped reversal to the red circle is as you can see.
If you focus on the hourly red horizontal line, you can imagine why that is the case.
Today’s development is likely to hinge on the continuing Fibonacci 50% zone.
If yesterday’s decline was a temporary dip, the trend should turn upward from here.
Technically, the B-band is constricting, so this may continue for a while, and eventually widen in one direction.
As I always write, first forecast the turning point on the 1-hour chart, and then chase it with Millionaire Trader’s chart.
For those returning home, the key points are the Tokyo high/low and the most recent highs and lows.
Thank you again for today.