
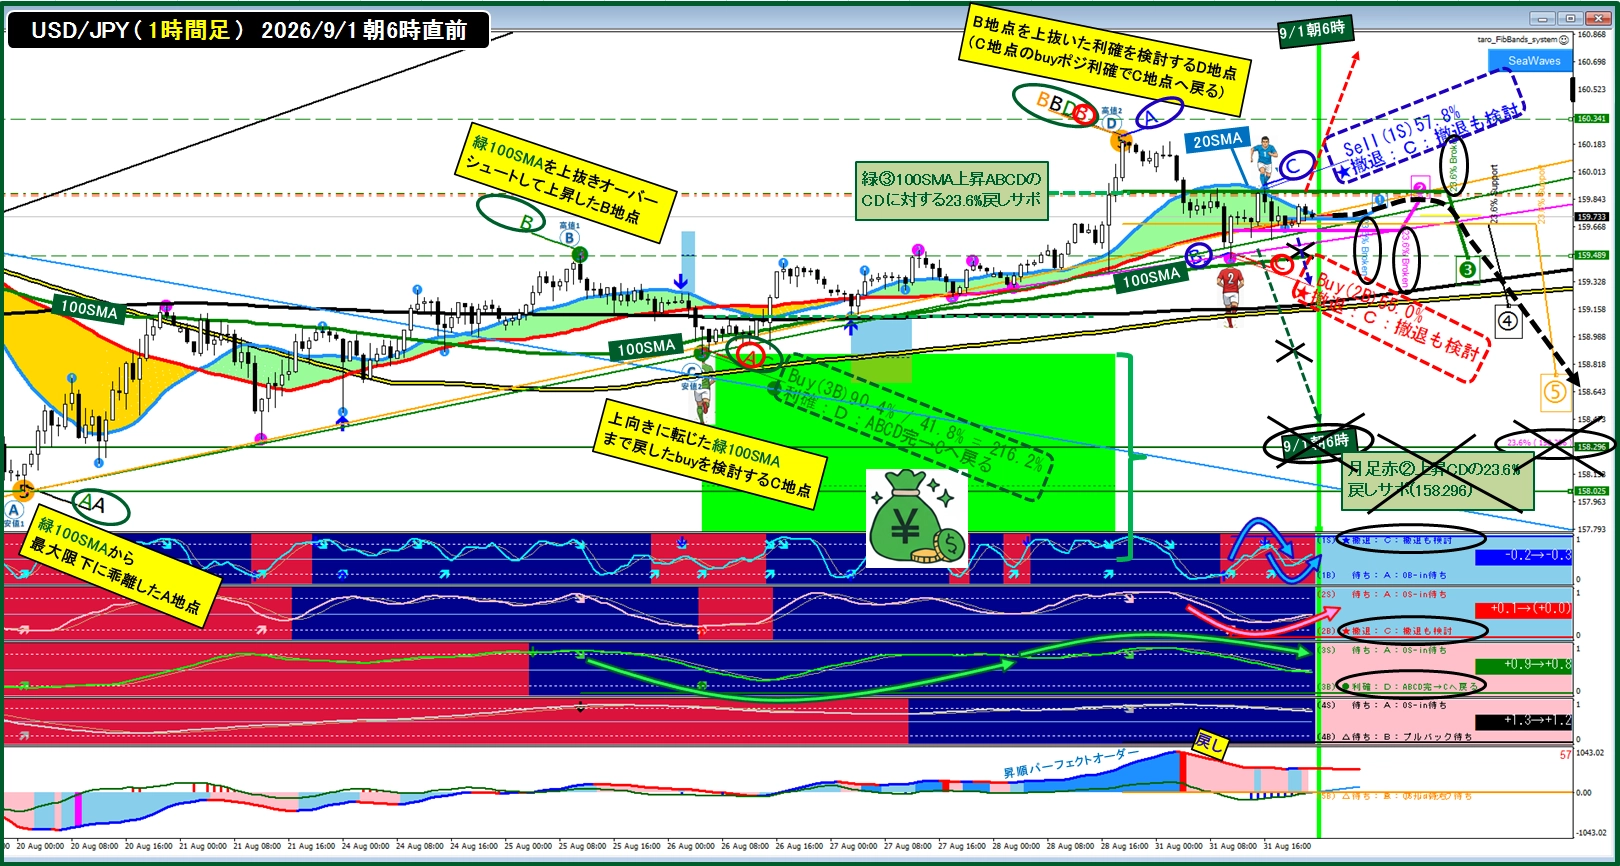
As of the morning of 9/1 (monthly close at 23.6% retracement and unable to stay above the short-term MA, then moved up)
The chart below is just before 6:00 a.m. on 9/1, USD/JPY (1-hour chart).
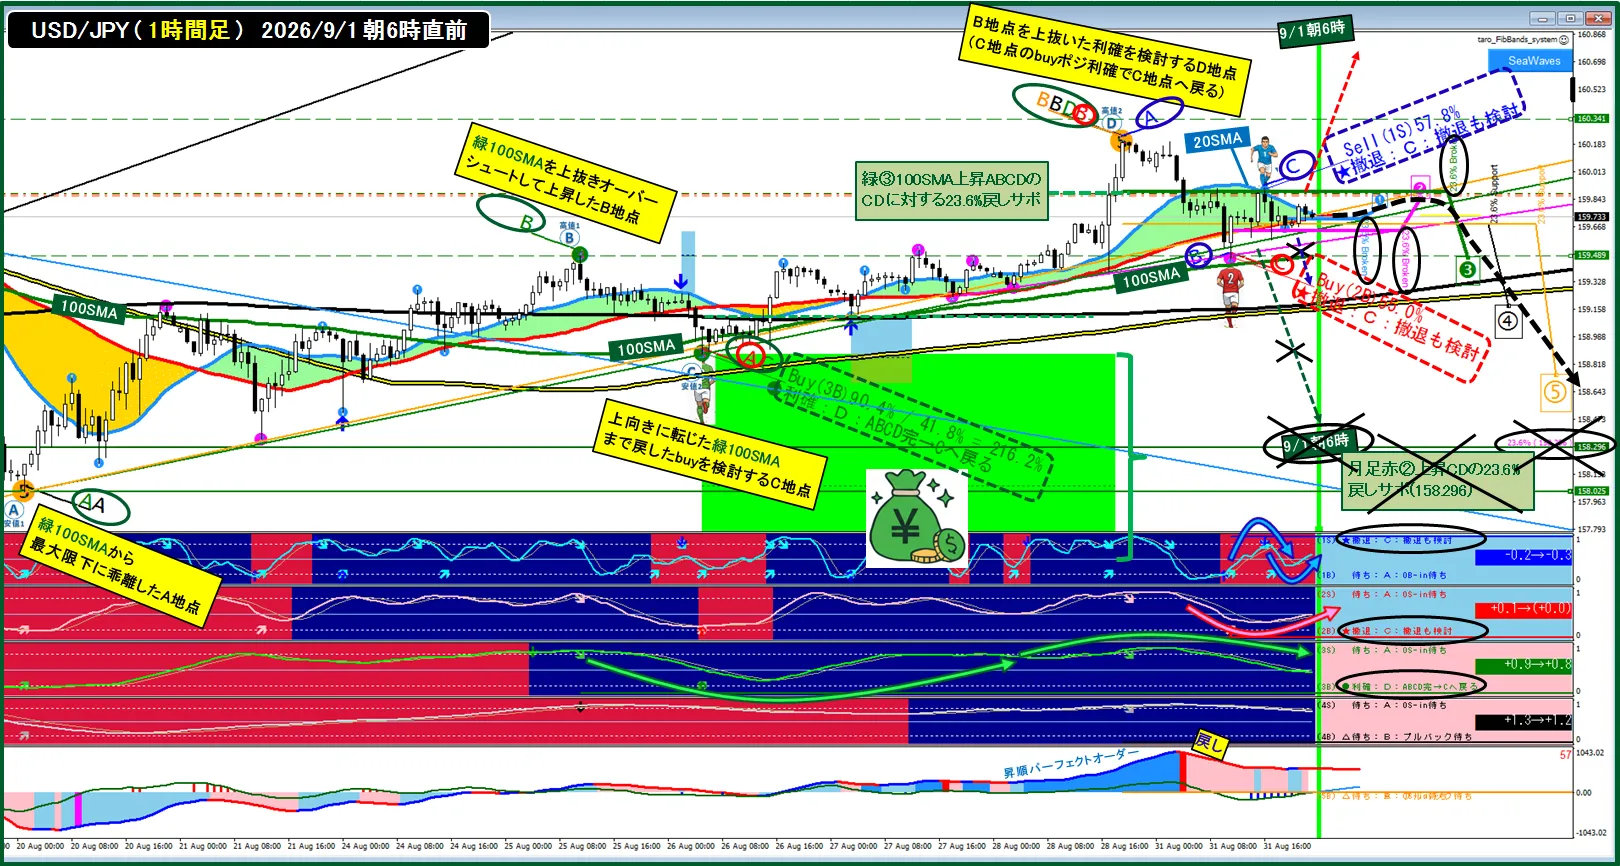
●Profit-taking at Point C of the long position on the blue ① 20SMA rising ABCD on the 4-hour chart, which led to a move down from D to C, and expanding the view to the 1-hour chart’s green ③ 100SMA rising ABCD to trade.
●Break below the 23.6% retracement of the green ③ 100SMA rising ABCD’s CD, then two touches from the bottom at support/resistance turns, and on the blue ① 20SMA falling ABCD, turning downward at the overlay of the blue 20SMA and the green CD 23.6% retracement,, I prayed to see it break below 158.296 by the morning of 9/1, but at the red ② 50SMA rising ABCD’s C point, price was supported by the red 50SMA and the green ③ rising ABCD’s upward trendline and could not break below, so in the end the monthly close confirmed on the morning of 9/1 did not break below the 23.6% retracement of the red ② rising CD (158.296) and closed higher, making the monthly close once again break upward after having briefly crossed below the 23.6% retracement, the short-term 5SMA, and +1σ, and confirming a movement different from the move prior to the Lehman Brothers crisis, which is certain now (^^
●On the right, the targets labeled blue ① to yellow ⑤ are drawn in advance as potential points of aim, and if you trace them in the order blue ① → red ② → green ③ → black ④ → yellow ⑤, you may, as shown by the black dotted arrows, fail to clear the green ③ 100SMA rising CD’s 23.6% retracement and press below red 50SMA, green 100SMA, black 200SMA, and yellow 400SMA, potentially reaching the green ③ rising ABCD’s point C.From this perspective, if price continues to fall without making a new high from here, the monthly short-term 5SMA and the 23.6% retracement would be broken above once to form a high, then fall again,which would make it clear that the highs are being lowered, and therefore, in hindsight, breaking below might be viewed as favorable compared to keeping below the 23.6% retracement or short-term MAs and +1σ earlier
(^^●Conversely, if the monthly chart forms within the green ③ rising ABCD the red ② rising ABCD inside its CD, and the blue ① rising ABCD inside red ② rising ABCD’s CD,, it is questionable since blue ① hasn’t touched the 20SMA, but there is also a possibility that short-term MAs and the 23.6% retracement are crossed and the price aims to make a new high before then, without touching the 38.2% retracement,
which could be considered● as another scenario.Look at the chart on the 1-hour chart with an upward bias, not the monthly level,
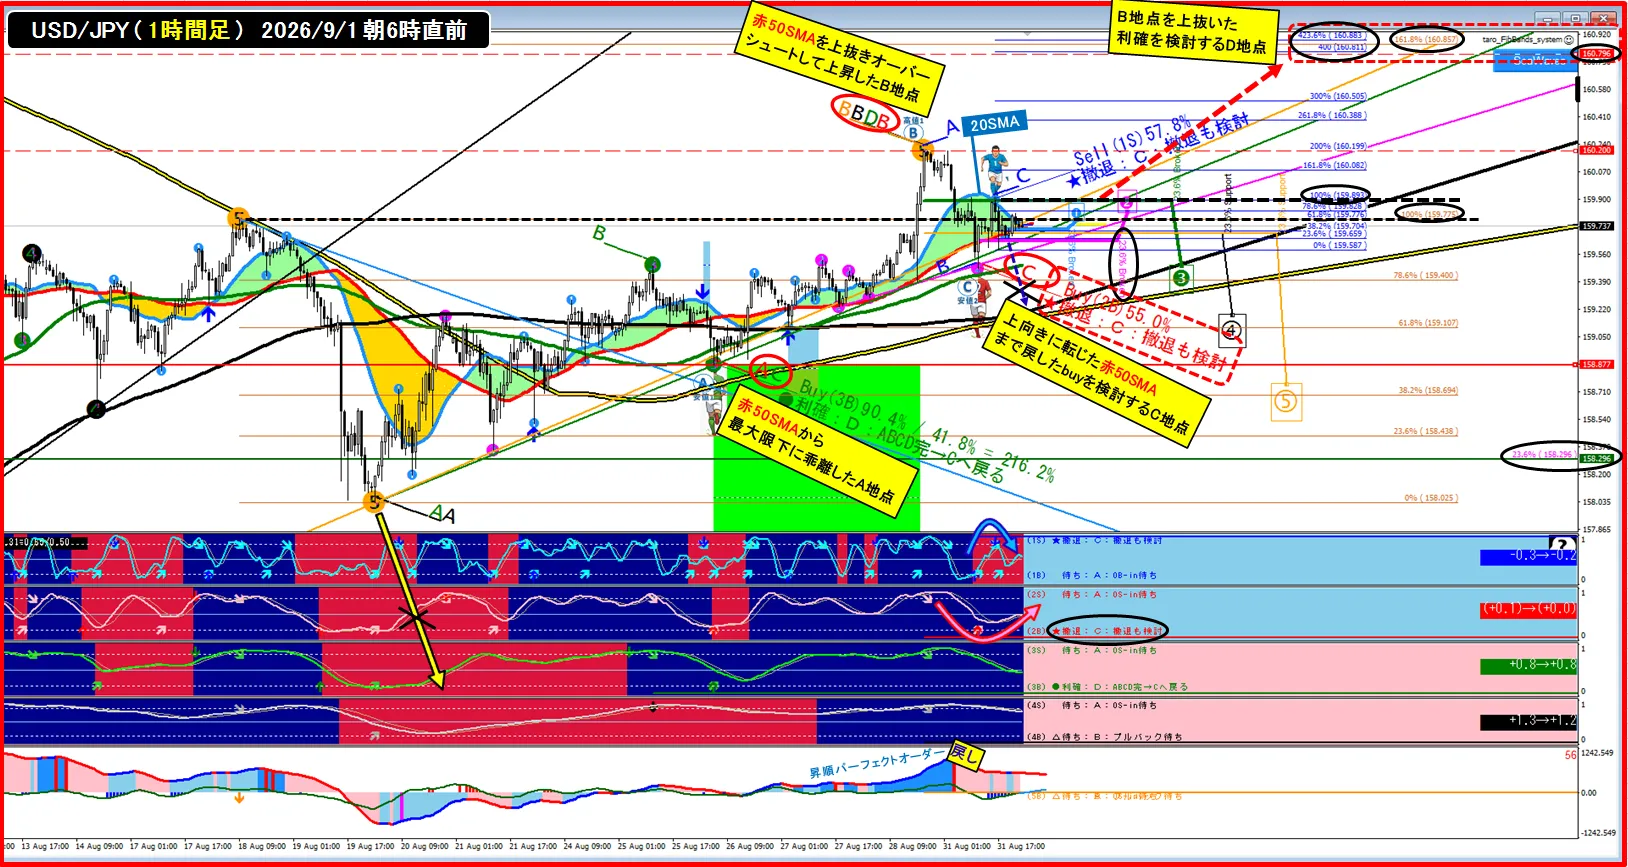
●Yellow ⑤ attempted a reverse V-shaped decline from the 400SMA but failed to make a new low and instead made a new high; afterward, Yellow ⑤ attempted to form a Blue ① downward ABCD from below, but also failed to make a new low; if the high around Blue ① near 159.893 (100%) is penetrated, it is expected to rise up to around 160.5 (300%),, however, the 161.8% of Yellow ⑤ and the FE100% line (160.796) of the Red ② rising ABCD’s AB=CD align near the 400% around 160.811, which weighs down from Blue ①;, thus, if price breaks above, there is a possibility of rising up toward that vicinity.It is anticipated that if it breaks above, it could rise near that area.This is why I think there is a potential for upside to continue if breached..
<Finally>
Either way, it has been confirmed that the movement is different from the chart when the Lehman shock hit a year earlier (>_<)/
I will simply proceed with the price action as usual(^^