“Repost” Today's Macro Correlations [2026-03-15] Has Bitcoin changed? From "Digital Gold" to "OS for Capital Mobility”
March 2026.
As spring arrives, the financial markets are being marked by a “quiet rupture.”
For investors in the early 2020s, BTC was viewed as an asset that possessed the same properties as Gold while offering higher volatility as an alternative.
Yet the scene before us today overturns that premise at its core.
Gold moves little, Bitcoin leaps.
Geopolitical risks rise, yet gold loses its monopoly as a safe asset.
This phenomenon is not merely a short-term price gap.
The map of macro correlations we know is being rewritten,a historic moment when the “gravity of capital” changes.
We will dissect the true nature of this transformation.
Chapter 1: Burning Middle East, Silent Gold, and the “Dollar Cage”
1.1 The Strait of Hormuz tensions and the energy paradox
Currently, Middle East tensions have entered a phase far beyond the 2024 level. The US-Israel alliance’s pressure on Iran over nuclear development has escalated to the brink of real force.
Typically, oil and gold react first in such situations. Indeed, crude oil (WTI) has surged to around $110 per barrel. Yet a strange phenomenon is occurring here. Gold prices are “not moving.”
1.2 Why has gold ceased to be a “safe” asset?
In 2026, the main reason gold is trapped in a range is the“weaponization of the dollar”being carried out to completion.
The US dollar now carries an unprecedented shield of “high yields and high liquidity.” In times of crisis, investors flock to the dollar (T-Bills) offering yields above 5% rather than to gold that yields no interest.
The old equation “Geopolitical risk equals gold buying,” a formula dating from the 19th century, has been overwritten by the dollar in the face of 2026’s digital financial infrastructure.
Chapter 2: Peering into the Abyss of the Credit Market — The Warning of Credit Spreads
What investors should watch most is not flashy charts, but the quietly expanding “credit spread.”
2.1 The “eerie equilibrium” of 3.17%
The current high-yield credit spread stands at 3.17%.
This means more than just a number.
Consider the following matrix.
| Level (%) | Market environment implied | Interpretation as of March 2026 |
| 2.5 or below | Happy optimistic market | A relic of the past. |
| 3.0–3.5 | Red zone of caution | Current position. Investors are on the trigger with their fingers on the trigger. |
| 4.0 and above | Beginning of credit tightening | Corporate liquidity is visibly impaired. |
| 5.0 and above | Repeat of financial crisis | Explosive systemic risk. |
This 3.17% figure shows a market that recognizes something may be breaking, yet remains in a “crazy equilibrium” with a bullish posture. Why does the spread widen so much while stock prices do not crash?
2.2 The “dual structure” of liquidity
The answer lies in the dual structure of liquidity. Traditional bank lending tightens (credit crunch) while private credit (non-public bond markets) still harbors vast pools of capital. This “invisible cash” helps avert a surface-level collapse.
Chapter 3: The VIX Speaks of the Normalization of Fear
The stock market fear index “VIX” has fallen from 35 in early March to 27. However, interpreting this as a spread of reassurance would be premature.
In 2026, investors are increasingly treating volatility itself as part of an asset class.
As long as VIX remains above 20 for more than half a year, the market has lost its capacity for panic and instead has built resilience to trade amid higher volatility. Is this market maturity, or a numbness-driven outcome? The next crash will prove it.
Chapter 4: The Qualities of Bitcoin — From “Digital Gold” to an OS for Capital Movement
Now, to the core of this article: Bitcoin.
There are three structural changes behind Bitcoin’s return to the $70,000s.
4.1 Michael Saylor and the “Reflex Loop”
MicroStrategy’s holdings surpass 700,000 BTC (about 3.3% of the issuance cap), decisively changing Bitcoin’s nature.
Their cycle of “equity issuance → BTC purchase” is a form of a kind of financial alchemy.
Issue more of one’s own stock at an inflated price.
Use the proceeds to buy up scarce BTC.
As BTC’s price rises, the company’s balance sheet strengthens, driving the stock price higher.
With the higher stock price, conduct an even larger equity issue.
This loop is no longer an investment. It is the invention of a new form of enterprise using the Bitcoin protocol. Thus, BTC has gained its own gravity, detached from macroeconomic waves.
4.2 The true value as a “capital movement asset”
As geopolitical risks rise, the wealthy and institutions realize the physical constraint that “gold is hard to move across borders.”
Carrying tens of billions in gold out of a war zone is nearly impossible, but with BTC a single private key can move instantly.
In 2026, the reason BTC’s correlation with GOLD has broken down is that gold represents “static wealth,” while BTC represents “moving wealth.” a division of roles has become clear.
Chapter 5: [Special Analysis] A Mathematical Consideration of Correlation
Here, let’s introduce a somewhat technical perspective.
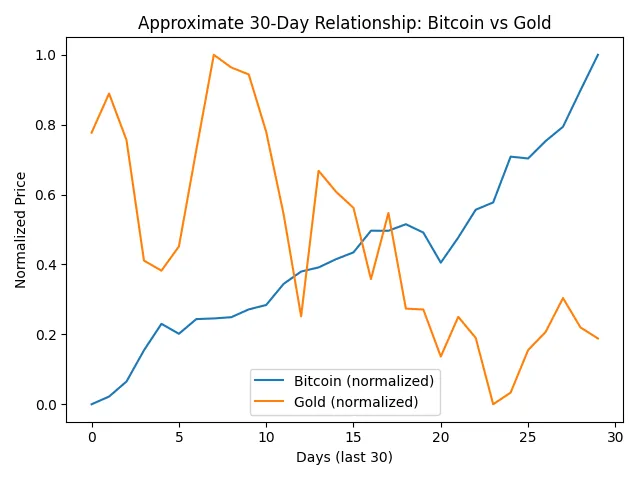
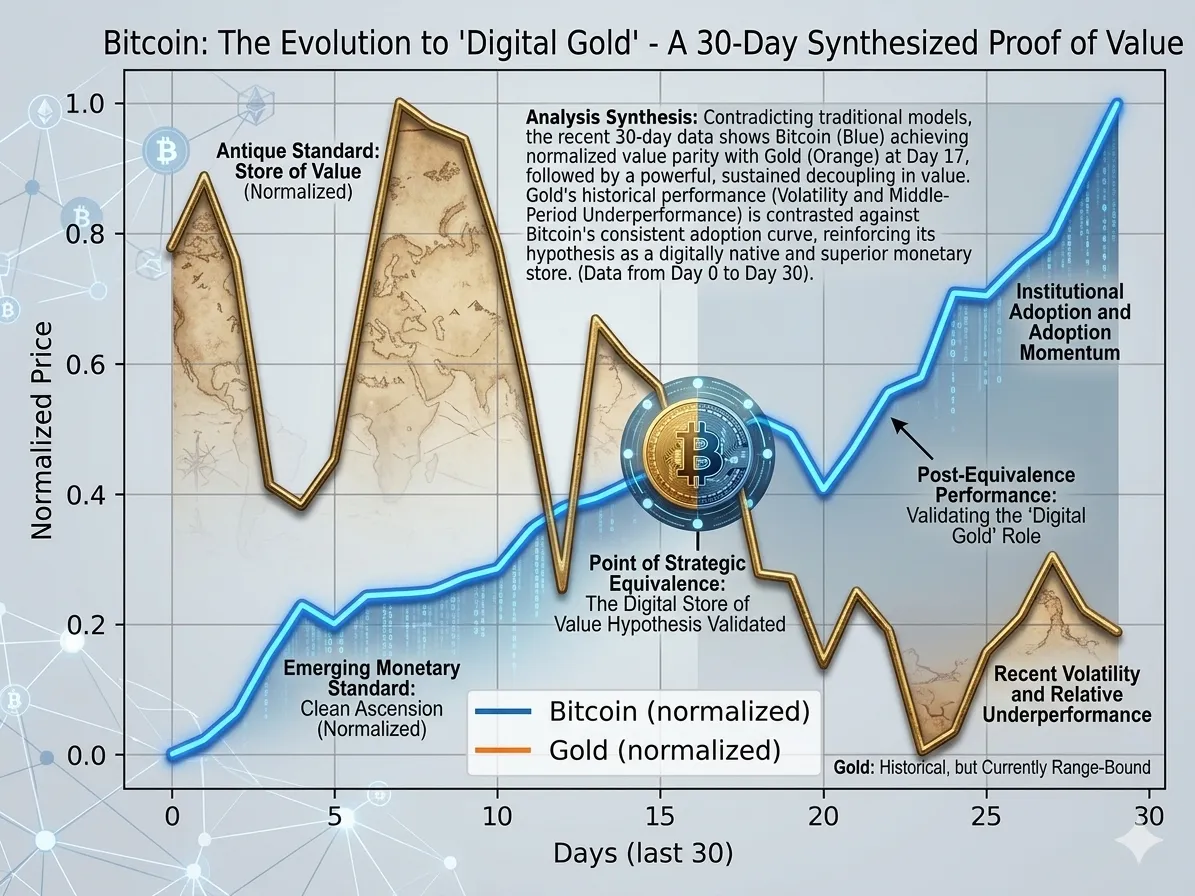
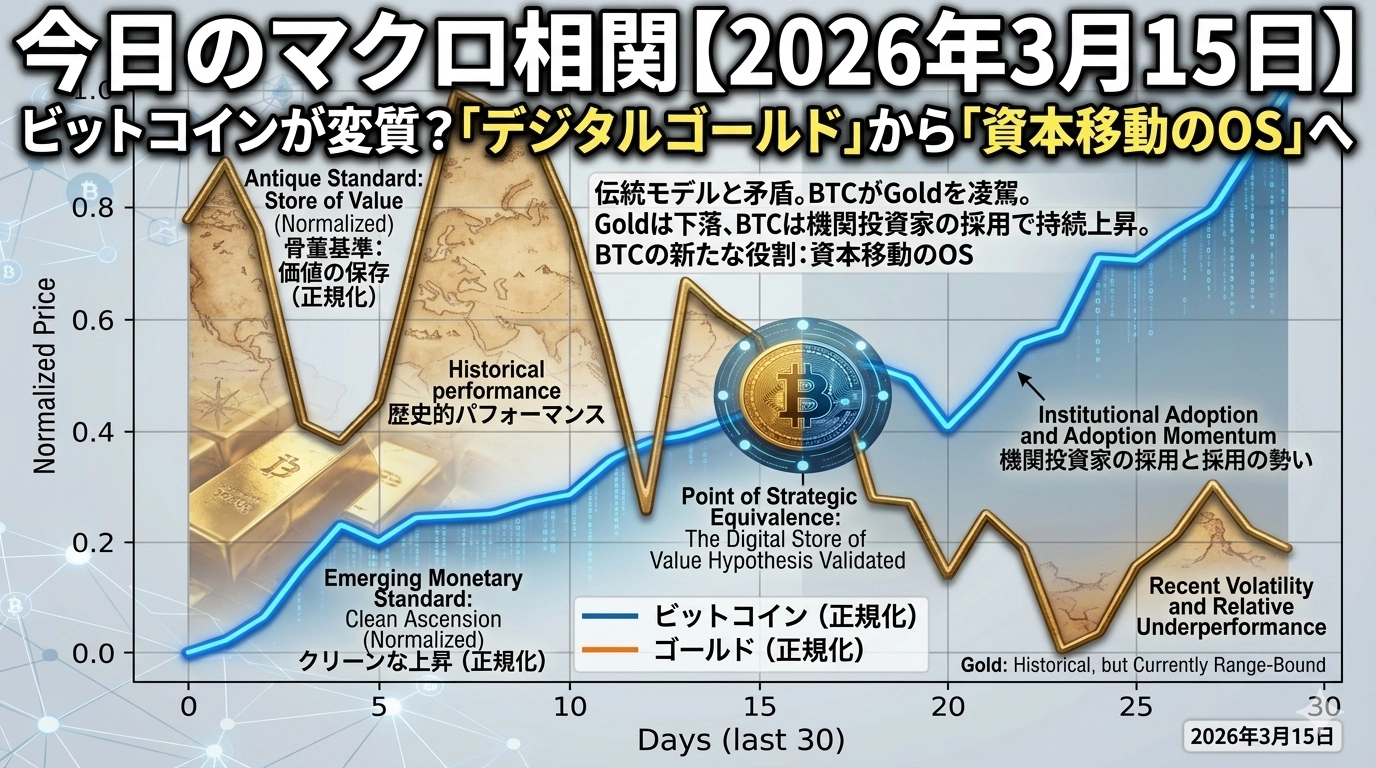
BTC and GOLD’s correlation, which once exceeded 0.5, has fallen to around 0.15.
As shown, over the last 30 days BTC has risen faster than GOLD.
Chapter 6: The Path of the Stock Market — “Rebound” or “Precipitous Cliff”
The current stock market feels like dancing on a thin sheet of ice.
Bullish catalysts:Productivity gains from the AI revolution, ample dry powder, continued share buybacks.
Bearish catalysts:Cost-push inflation from high oil, stubbornly high long-term rates, widening credit spreads.
In the short term, bear traps are likely to form, but behind them is the淘淘 elimination of weak companies. 2026 stock investing returns to a period where identifying truly strong cash flows matters more than simply owning an index.
Chapter 7: Upcoming Scenarios — Three Critical Points Investors Should Watch
How long can we stay in this “strange stability”? Here are three scenarios for late 2026. These are the author’s opinions and not guaranteed to be accurate.
Scenario A: Liquidity-driven rally continues (probability 40%)
Oil stays under $90, credit spreads compress to 3.0% or lower. In this case, BTC heads to $100k and the Nasdaq keeps hitting new highs.
Scenario B: Stagflation shock (probability 40%)
Oil breaches $100, VIX exceeds 35. Gold is briefly bought but gains are limited due to a stronger dollar. Meanwhile BTC, as a means of movement, bottoms faster than equities.
Scenario C: Systemic credit event (probability 20%)
A large number of defaults in the high-yield market cause spreads to break above 4.5%. This becomes the “Lehman moment of 2026,” a phase where all assets are indiscriminately dumped in a cash-is-king environment.
The philosophy required of investors in 2026
March 15, 2026 market teaches a strong message: “Discard the old textbooks.”
Gold and Bitcoin begin to diverge, geopolitics become part of daily life, and large corporations behave like central banks. Surviving in this chaotic world requires not the comfort of diversified investments, but a correct understanding of the roles and functions of assets.
Gold:Store of value. However, returns are not to be expected—an anchor.
Dollar:The strongest liquidity.
Bitcoin:A call option on the future financial OS.
Calling Bitcoin “digital gold” may already be outdated. It may be as underestimating its potential as calling the Internet merely “digital news.”
We are witnessing the dawn of a new capitalism.