

How to Read and Decide on MTF (Multi-Timeframe) Charts: MT F Analysis Intro Part #3
Hello! I’m SAKU!
In the previous two installments, I introduced the basic concepts of MTF analysis, but this time I plan to delve into how to view each time frame using actual charts in detail!
The difficulty will gradually increase, so please keep up!
If you haven't read the previous articles yet, please read the following before this article.
Previous article →What are the roles of each time frame in Multi-Time Frame Analysis?【MTF Analysis Intro #2】
Two articles ago →About market fractality ~ What is Multi-Time Frame Analysis? ~【MTF Analysis Intro #1】
How to read the charts in MTF analysis
In MTF analysis,once you decide the main thread, you basically analyze by dropping down from the higher time frame to the lower ones in order.to do so.
The flow is higher time frame → main thread → lower time frame, in that order, to understand direction and conditionsas you go.
This is because if you raise the time frame from the lower to higher, your viewpoint can become messy, and it’s easier to follow the overall trend by first assessing the situation on the higher time frame.
Once you get used to it, you can switch time frames and still understand where the price action on each time frame sits relative to others, so you can change the order according to the situation, but until you’re accustomed, I recommend starting from the higher time frame and dropping down.
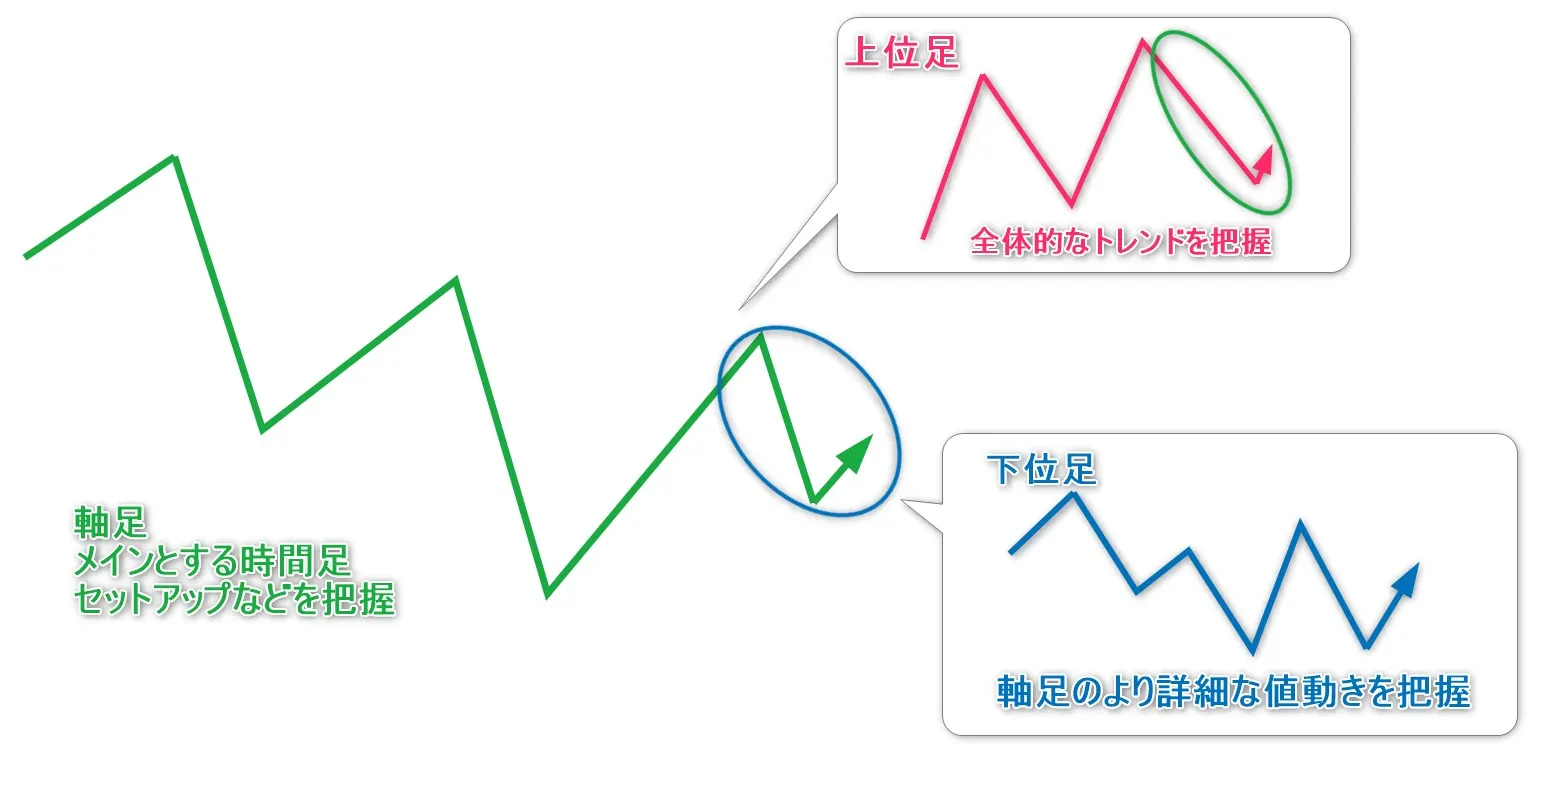
To review the previous article, the roles of each time frame are as follows.
・Higher time frame → grasp the overall trend
・Main time frame → grasp the main setup, etc.
・Lower time frame → grasp more detailed price action
Examples using charts
Next, we’ll look at how to use MTF analysis with actual charts!
Here, we’ll set the main timeframe to 4 hours, the higher timeframe to daily, and the lower timeframe to 1 hour, and use MTF analysis to analyze the chart as an example.
Also, in the chart images below, the parts enclosed in squares are dropped down to the lower time frame for viewing.
1: Get a rough understanding of the situation
First, roughly grasp the daily trend from the higher time frame.
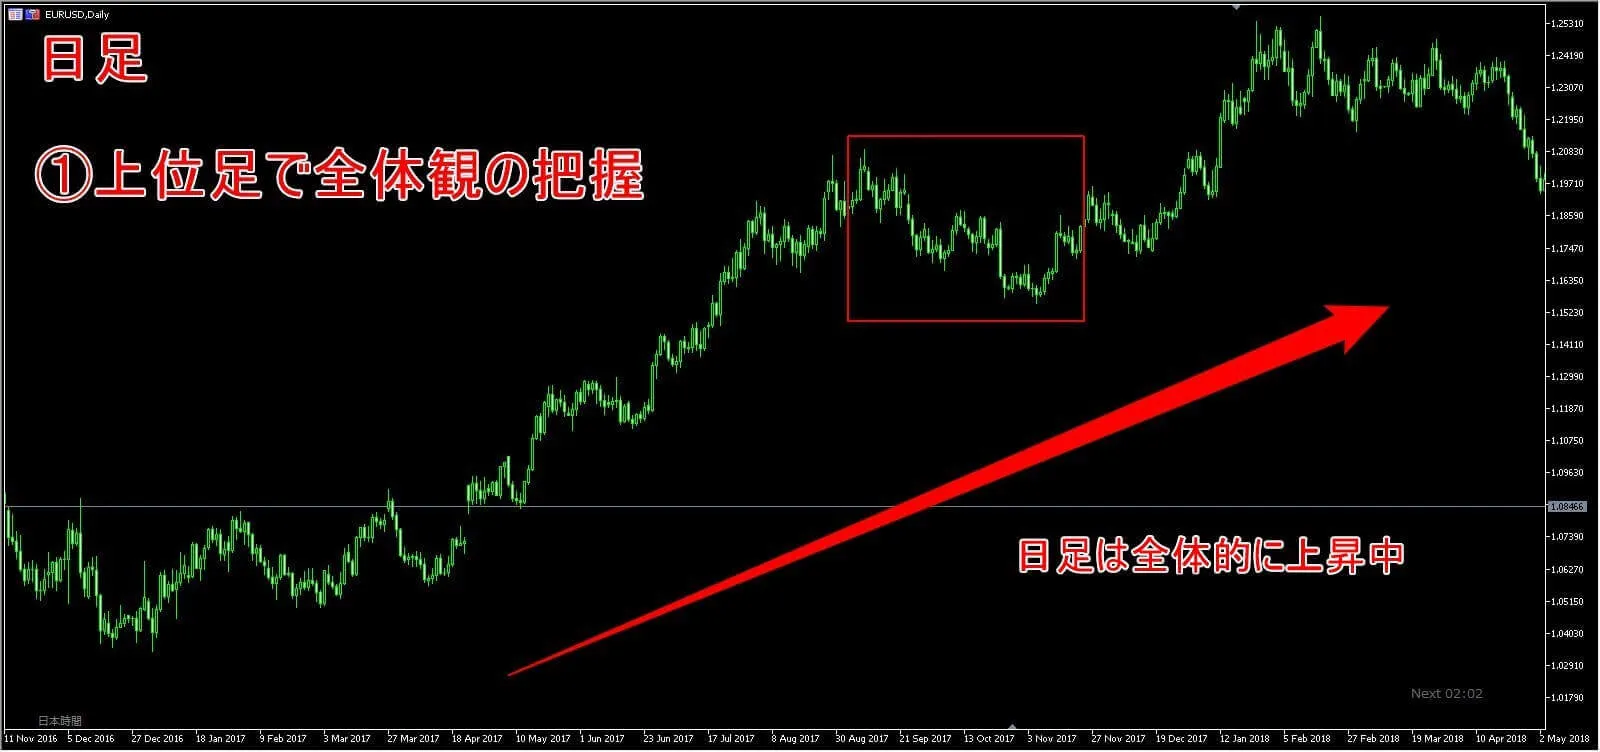
① The daily on the higher time frame is overall rising. Next is the main thread.
Let’s look at the red-framed part of the daily on the 4-hour chart.
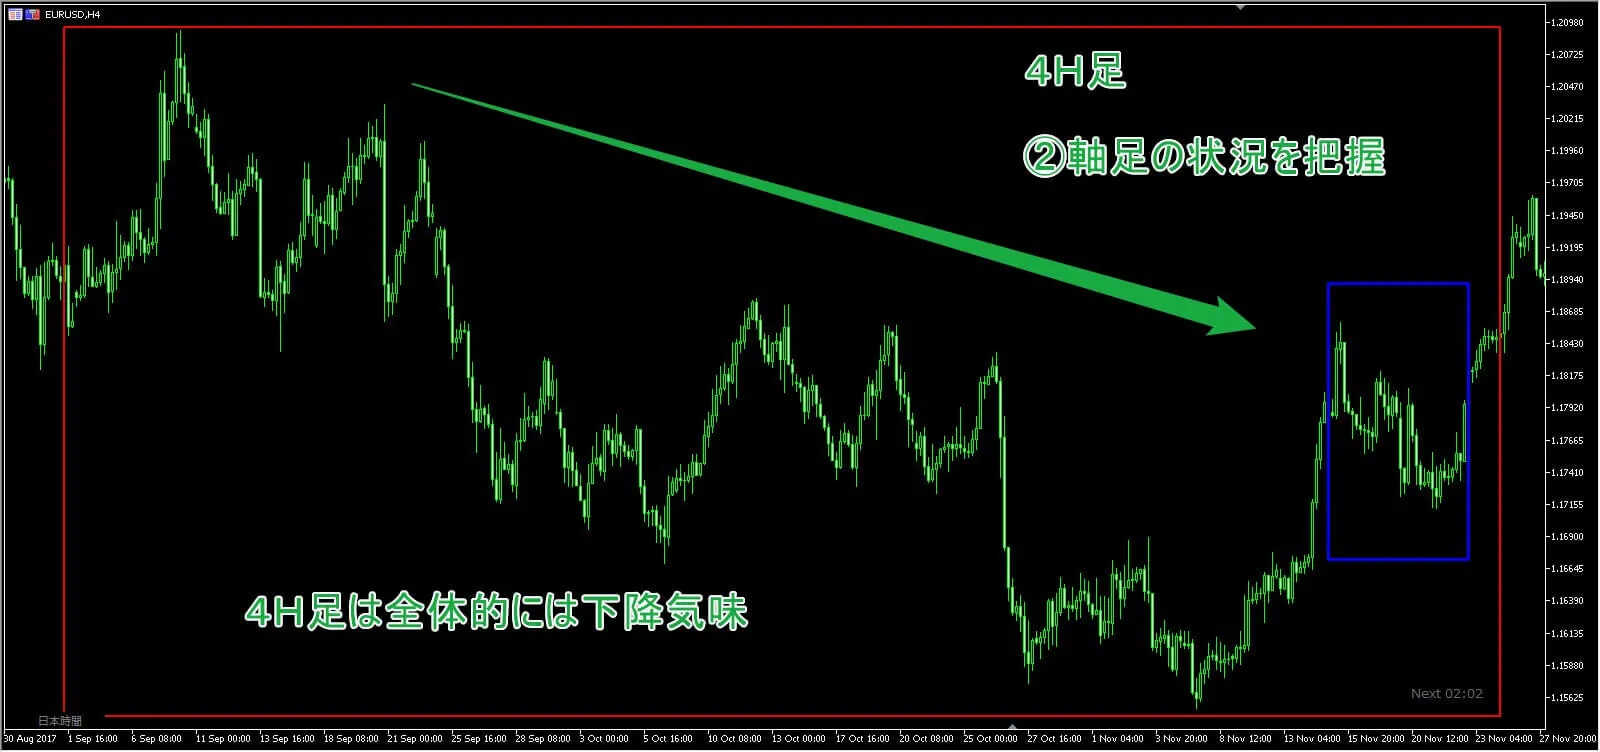
② The 4-hour main thread looks broadly bearish. Let’s drop down to the lower time frame.
We’ll examine the area near the blue-framed part of the 4-hour chart on the 1-hour chart.
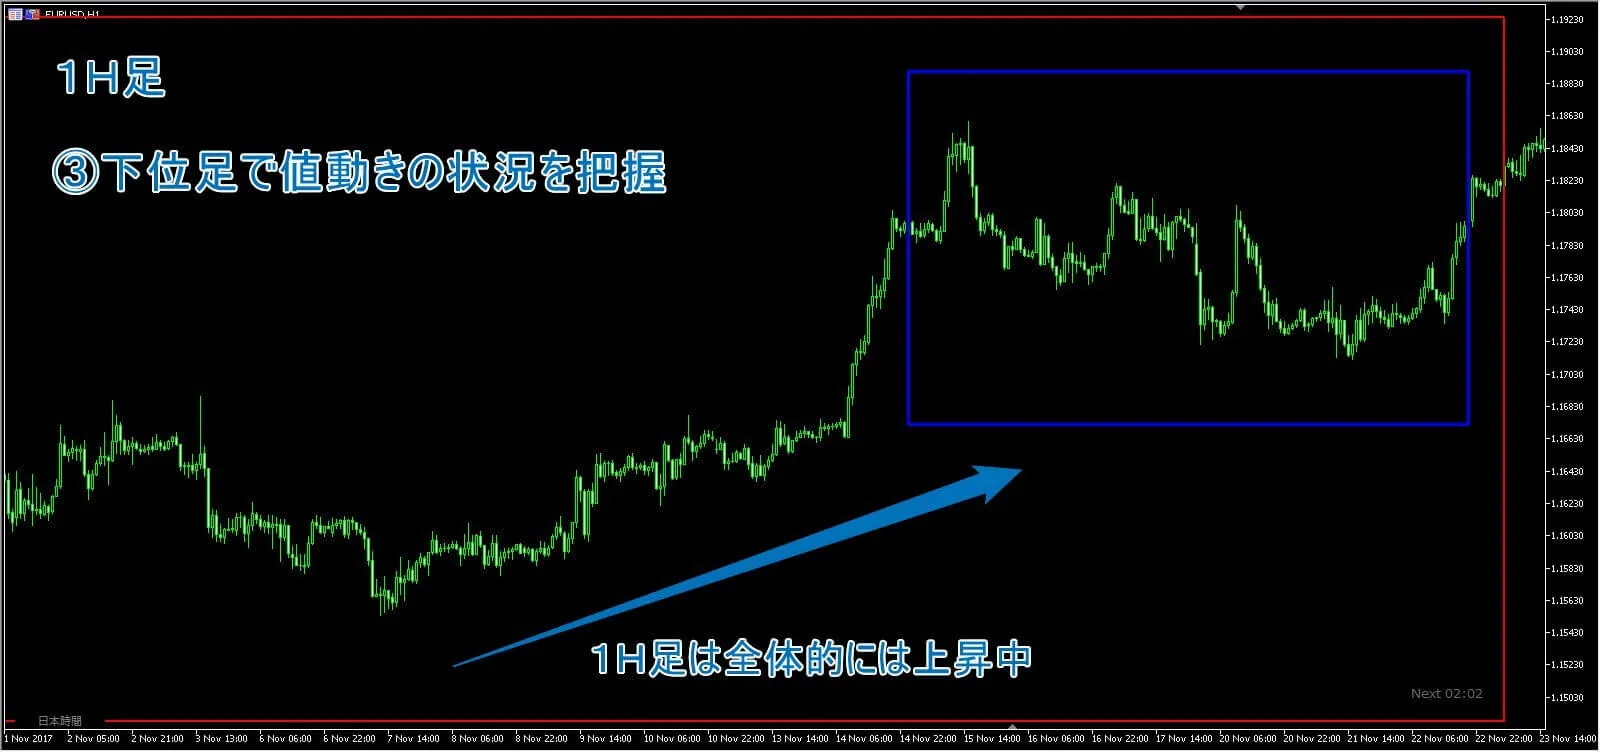
③ The 1-hour lower time frame is roughly rising.
Summing up to here, it looks like this.
【Viewpoint】
・Daily → Up
・4-hour → Down
・1-hour → Up
2: Grasp more detailed conditions
Earlier we grasped the direction roughly; now let’s understand the flow and conditions a bit more in detail.
First, the higher time frame (daily).
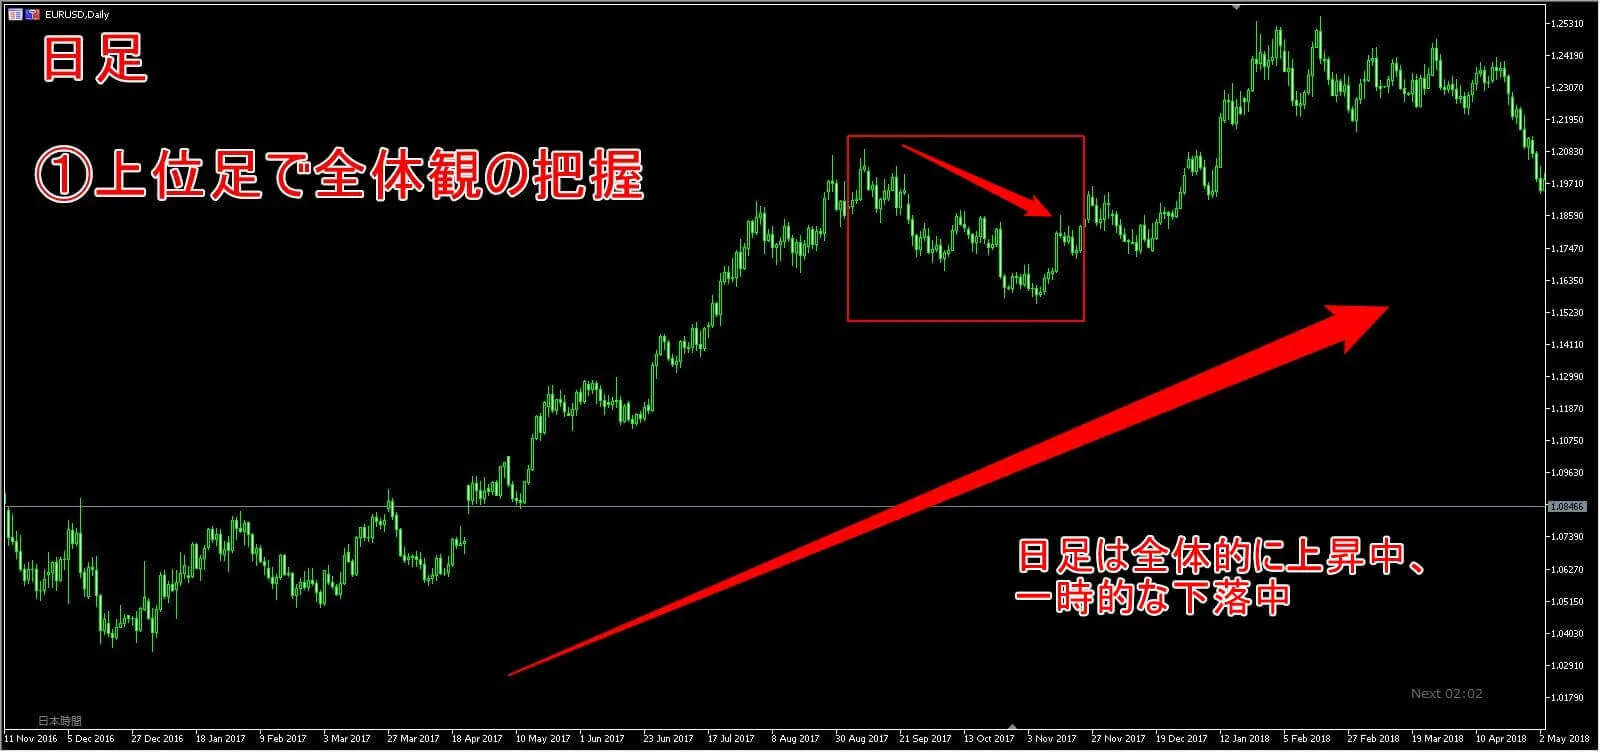
① The daily is generally rising, but in the red frame it’s temporarily making lower highs and lower lows.
Next is the main thread (4-hour).
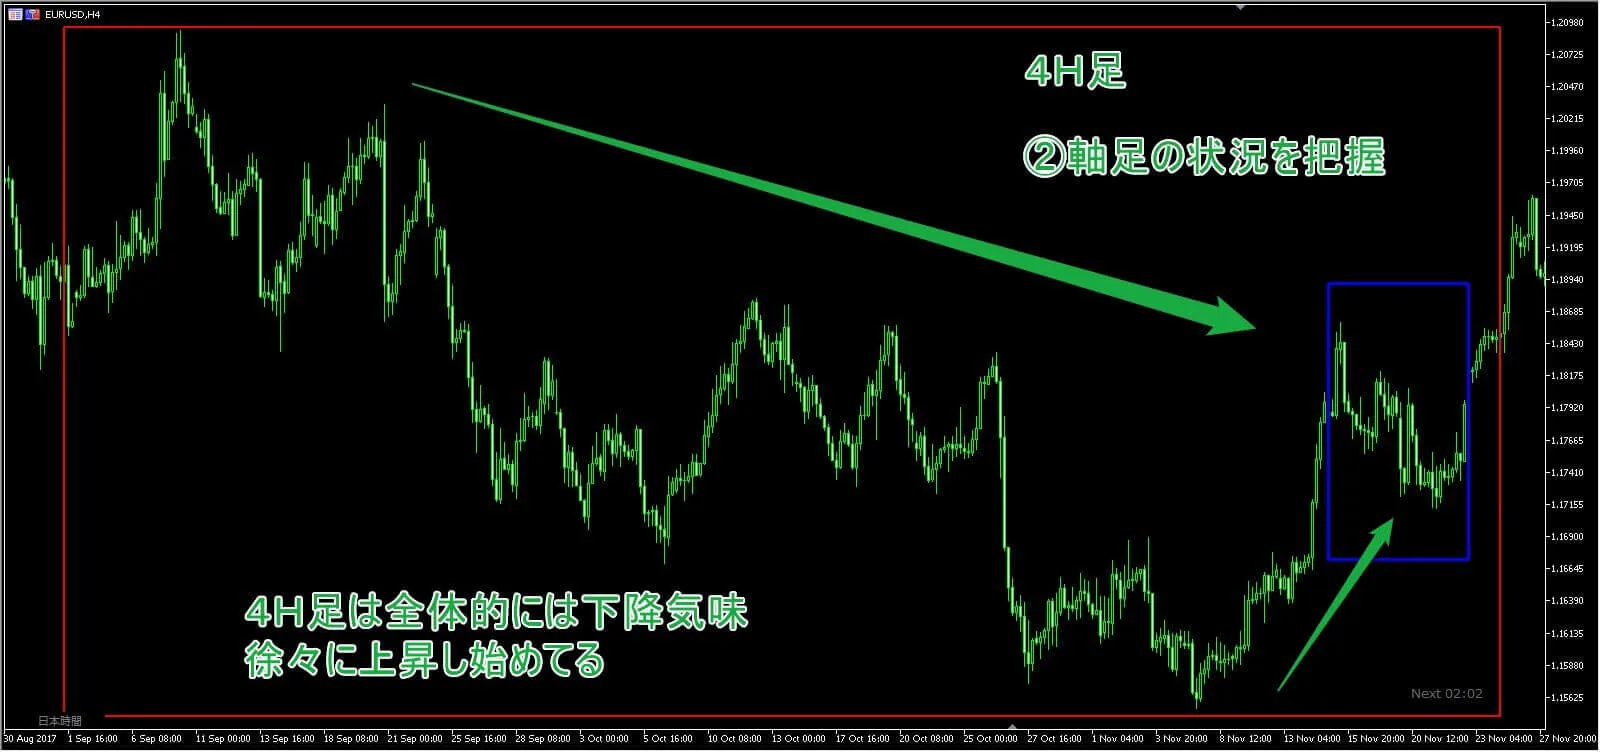
② Broadly it’s declining, but until the blue-framed area, the lows are gradually rising and the price begins to move up.
Next is the lower time frame (1-hour).
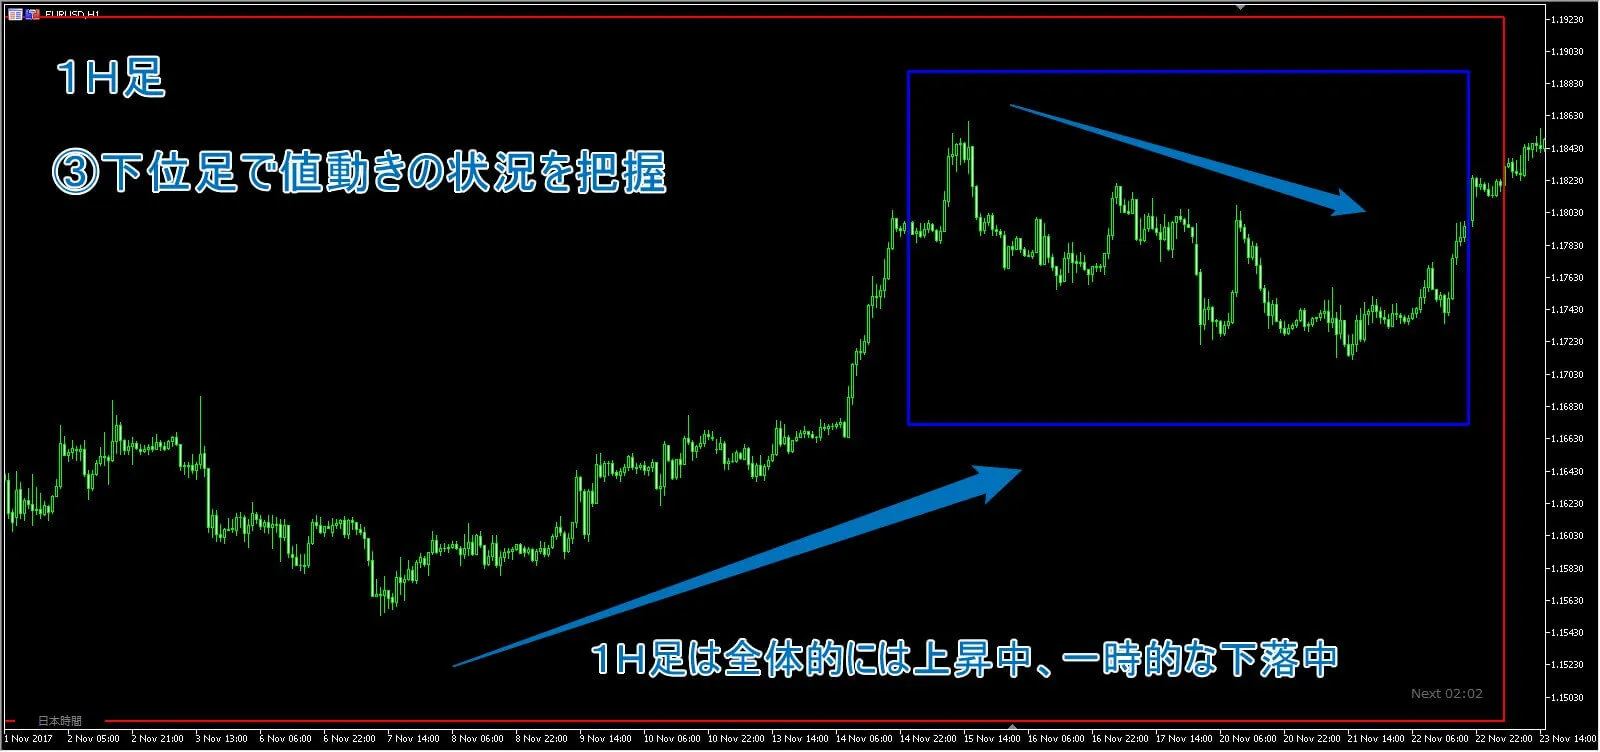
③ Overall it’s rising, but temporarily making lower highs and lower lows.
【Viewpoint and Conditions】
・Daily → rising, then pullback
・4-hour → turning from down to up
・1-hour → rising, then pullback
3: Add lines to judge
Next, let’s add lines to Step 2 to make a judgment.
From here, the difficulty will rise sharply, so please read carefully and think things through.
First, the higher time frame (lines drawn on the higher time frame are red).
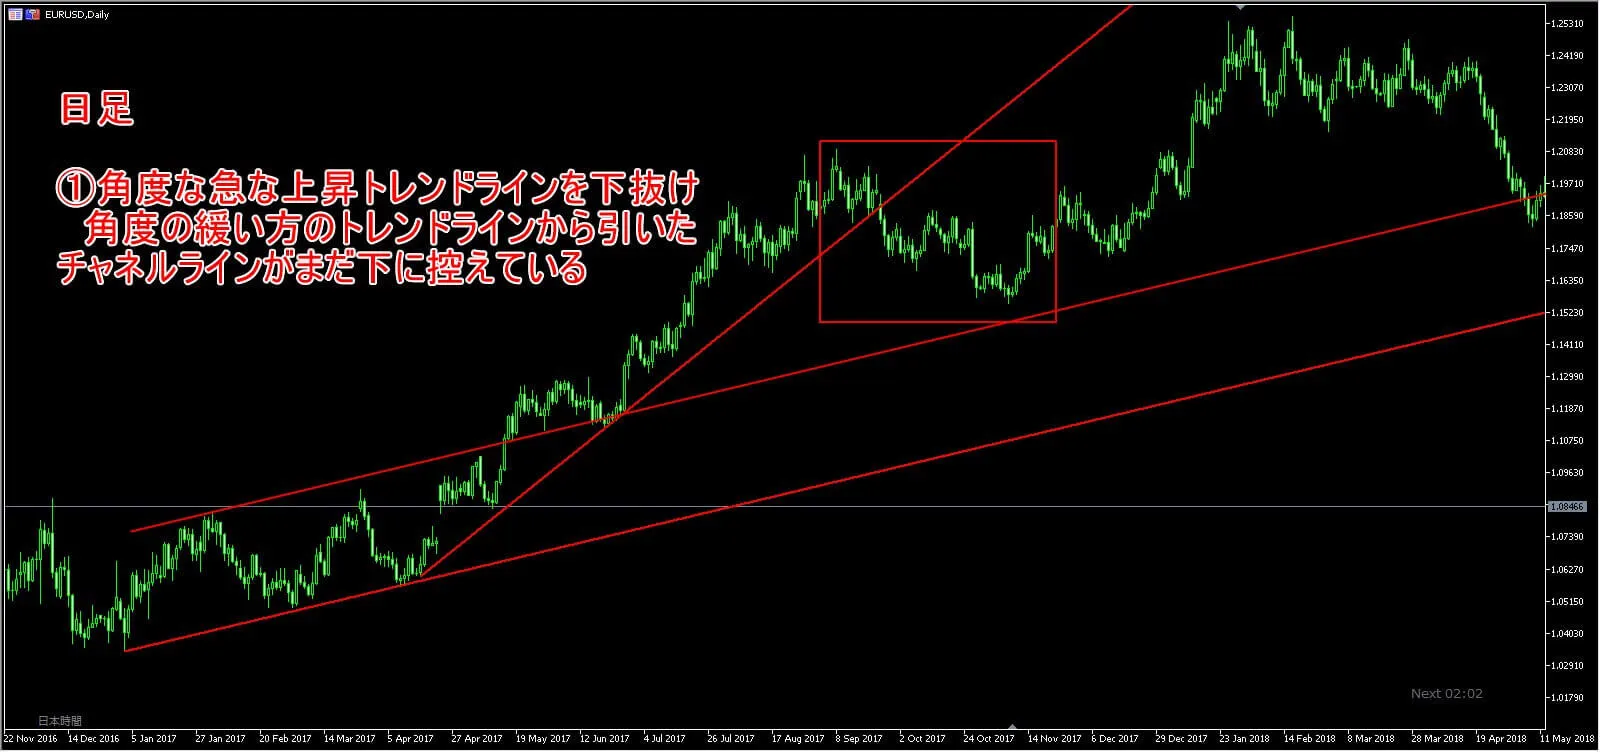
① The steeply rising trend line was broken to the downside, but a channel line drawn from a more gradual downward angle below is coming into play.
→ On the daily level, those who bought at the steep rising trend line may be taken profits, implying a temporary pullback.
Next is the main frame (lines drawn on the main frame are green).
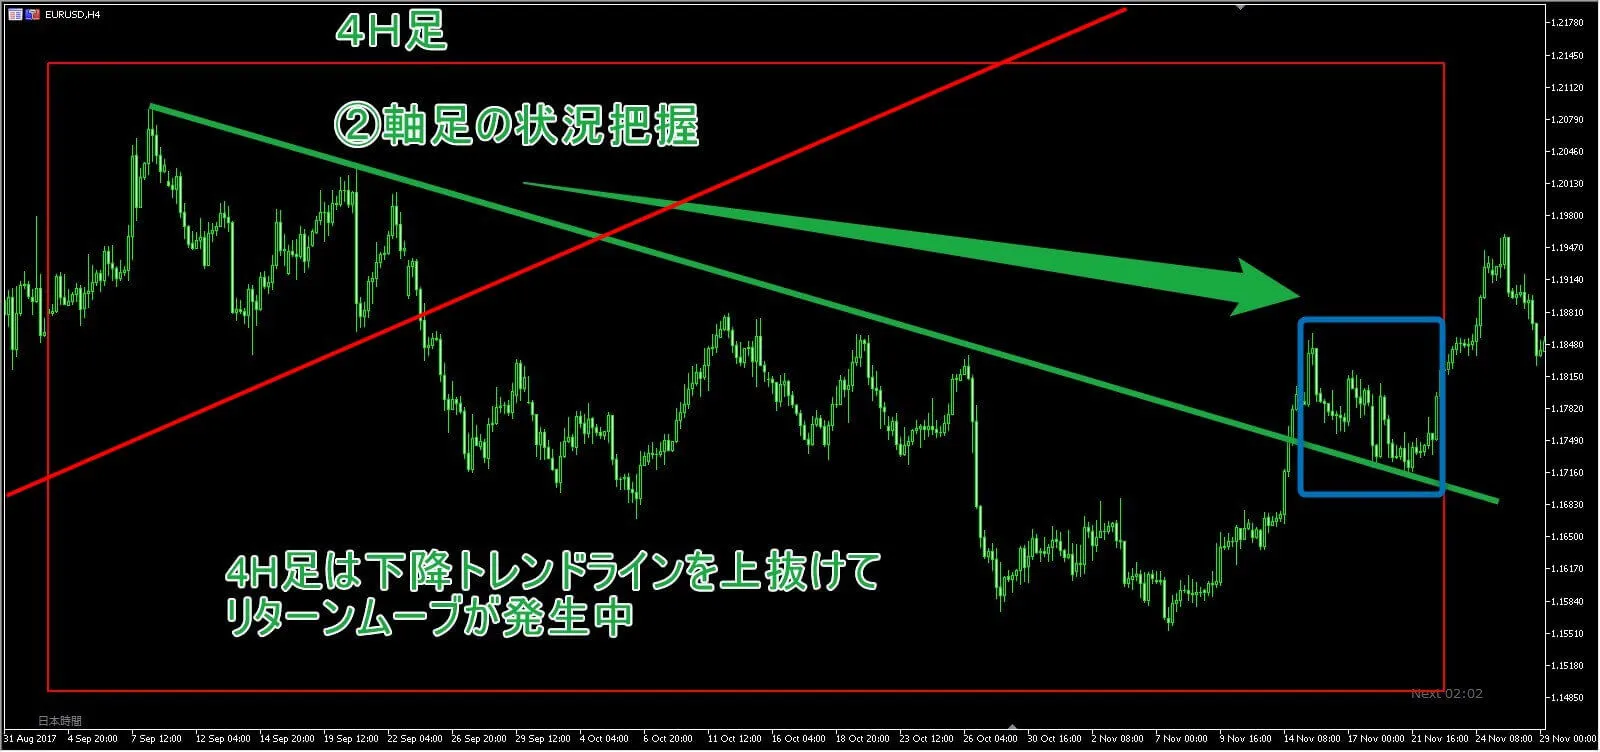
② The 4-hour time frame breaks above a downtrend line, with a return move (a move back to the line after a break) occurring.
→ The downtrend line on the 4-hour level is indicating selling pressure ending, with a possibility to rise (since the daily direction is up).
Next is the lower time frame (lines drawn on the lower time frame are light blue).
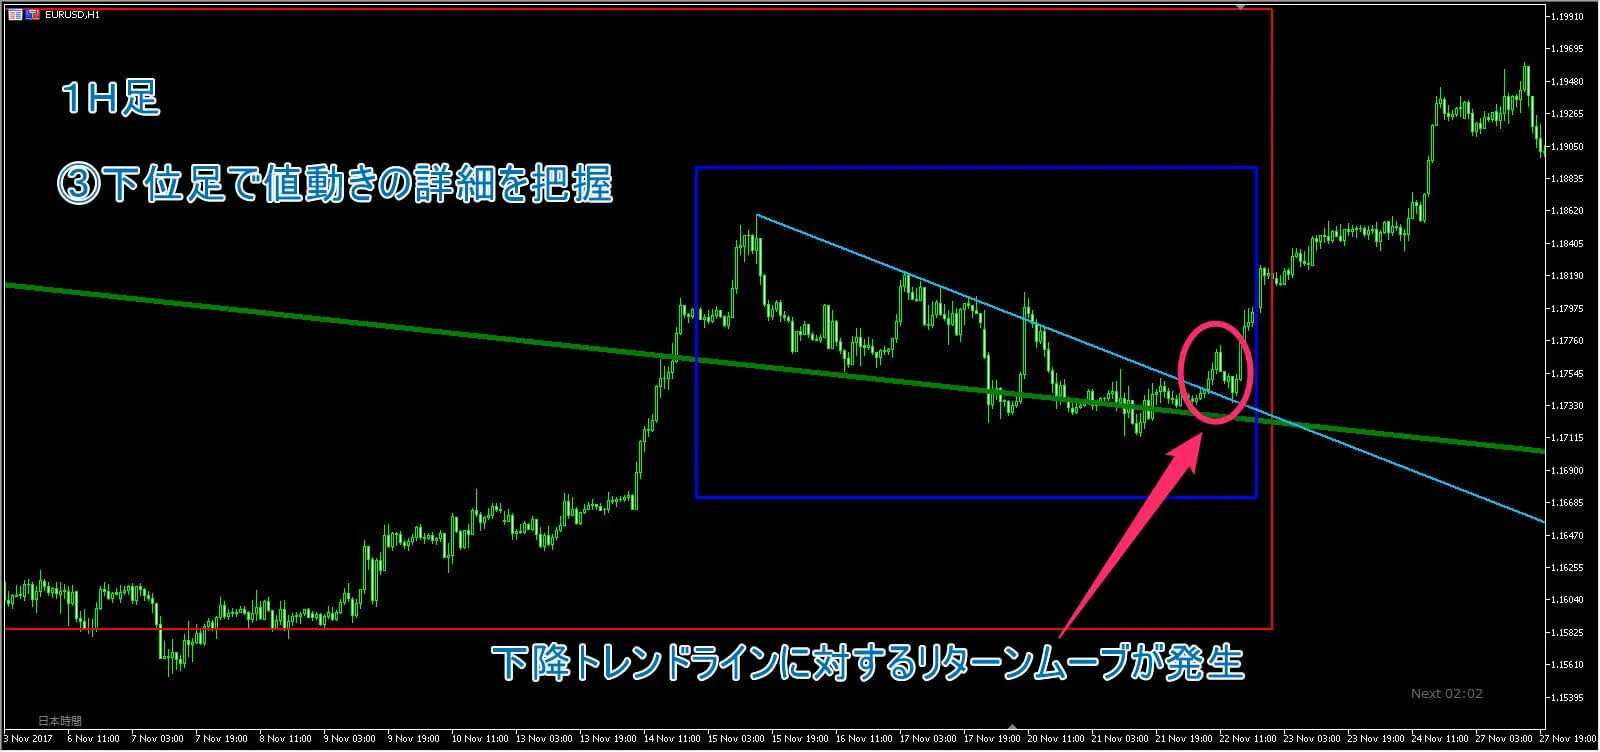
③ On the 1-hour level, the downtrend line is broken to the upside, with a return move occurring.
→ The sell signal on the 1-hour level (the return move on the 4-hour level) ends, and there’s a possibility of moving higher toward the daily direction.
【Viewpoint and Conditions】
・Daily → rising, with sharp downward break of the trend line; channel line kept above
・4-hour → turning from down to up, return move after breaking a downtrend line
・1-hour → rising, with a return move after breaking a downtrend line on the 1-hour, toward the daily direction
If you were to long entry at 3③ (the pink circle on the 1-hour).
There is a premise that the higher time frame is rising, and that the higher time frame is temporarily in a pullback during an uptrend, and that a return move is happening on the main main line, and that you enter in the direction of the higher time frame only after confirming that the action (return move) on the lower time frame has ended.
The basics are to follow the higher time frame direction
This is not limited to MTF analysis, but the basics of trading areto follow the trend in the direction of the higher time frame (trend following, naive) .
If you understand the overall situation on the higher time frame and it’s rising, you buy when the main thread on the main main frame is rising or when the momentum shifts to rising.
And further, to time that, you drop down to the lower time frame to observe the detailed price action of the main thread.
Stop making pointless contrarian trades.
More than that, beginners often don’t even know whether their contrarian move is against the higher time frame, so train yourself to be aware of the higher time frame direction and follow the trend.
That’s all for this time!
Some of you may have felt the latter half jumped in difficulty.
When considering multiple time frames, viewpoints can become tangled, so reread many times andpractice a lotplease!
It may take time at first, but soon you’ll be able to judge at a glance!
Also, for ease of understanding, I explained in three stages (1–3), but as you get used to it, you can perform direction, conditions, and line judgments simultaneously!
Even if you change the time frame, make sure you know exactly where you are in terms of time axis and situationbefore you trade.
So,This concludes MTf Introduction Course in 3 partsfor now!
The content covered in this introductory section isstill just the beginningthough,if this discussion was too difficult or you want to master MTF at a higher level, check my e-book (link below)!
It is packed with content to deepen your understanding of MTF analysis and line trading, and to master trading at a higher level from the basics. to learn from the basics as you level up!
Methods to practice for mastering MTF analysis, setups (entry patterns) and trigger conditions, of course risk management, and profit-taking methods, all explained with rationale and underlying concepts, thoroughlyand concretelyfor improving trading skills!
By the way, there is currently a campaign,and you can purchase at a discount until August 31, 2026!
For more details on the author’s MTF trading method, see here ↓
MTF Mastery of Multi-Time Frame Analysis(Until August 31, 2026 23:59DiscountCampaign ongoing!)