
Will the USD/JPY move in the same way as one year before the Lehman Brothers collapse? (Decided in 24 hours)
Below chart is as of the end of the week of 8/29, dollar/yen (monthly) chart.
The monthly close confirmed at 6:00 a.m. on Tuesday, 9/1 is whether it can retrace to the lower zone from 157.291, which is 1.8 yen (180 pips) lower, and be confirmed, without making a new high and instead moving lower, is the key, and depending on the situation, September’s monthly candle could become a large bearish one. Below, I explain in detail why I think so by comparing it with the chart from a year before the Lehman Brothers collapse.
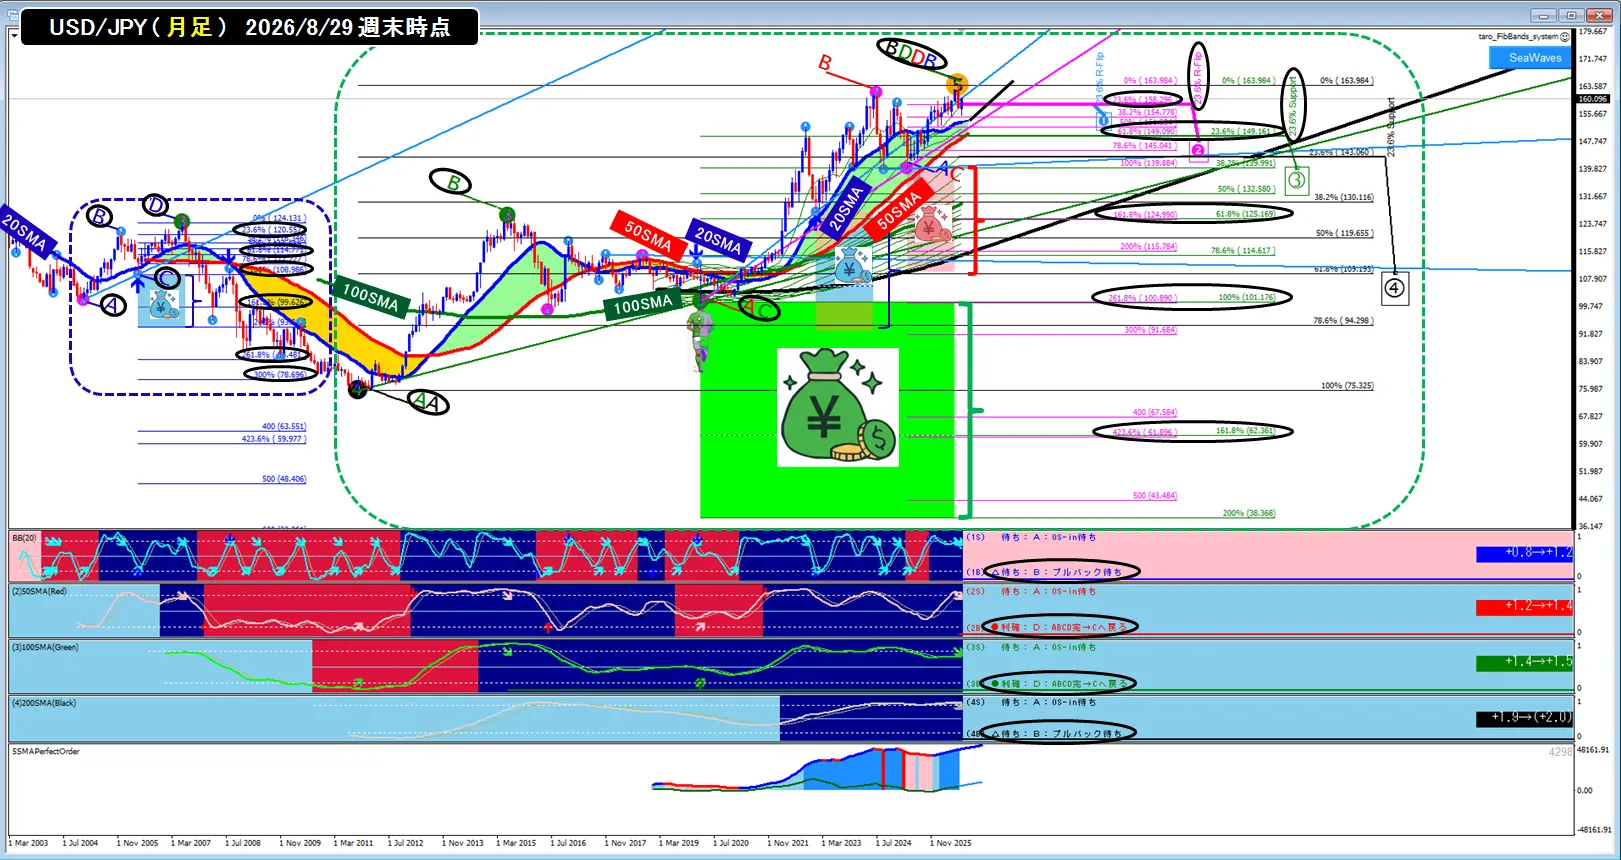
●I think the sections enclosed by the blue dotted line on the left and the green dotted line on the right somewhat resemble each other..
●The section enclosed by the blue dotted line on the left represents the downtrend from a year before Lehman, where the blue 20SMA forms an ABCD pattern and acts as support turned resistance and then rises, after which the blue 20SMA acts as support/resistance and the price falls.
●The section enclosed by the right green dotted line shows the pattern in the A→B phase of the Abe-Nomics era where the green 100SMA is broken to the upside, then under the Trump administration (first term) in the B→C phase the red 50SMA and blue 20SMA suppress prices and push them down, after which the green 100SMA provides support and C→D breaks above on the green 100SMA and rises under the Biden administration. Note the sequence where blue ①20SMA and red ②50SMA progressively flip into resistance/support forming ABCD..
●About the left and right boxed areas: they look similar, but I’m not sure if they are exactly identical. Therefore, I displayed the left blue dotted box on a weekly chart rather than a monthly chart..
The chart below shows the Lehman-downmove portion on a weekly chart..
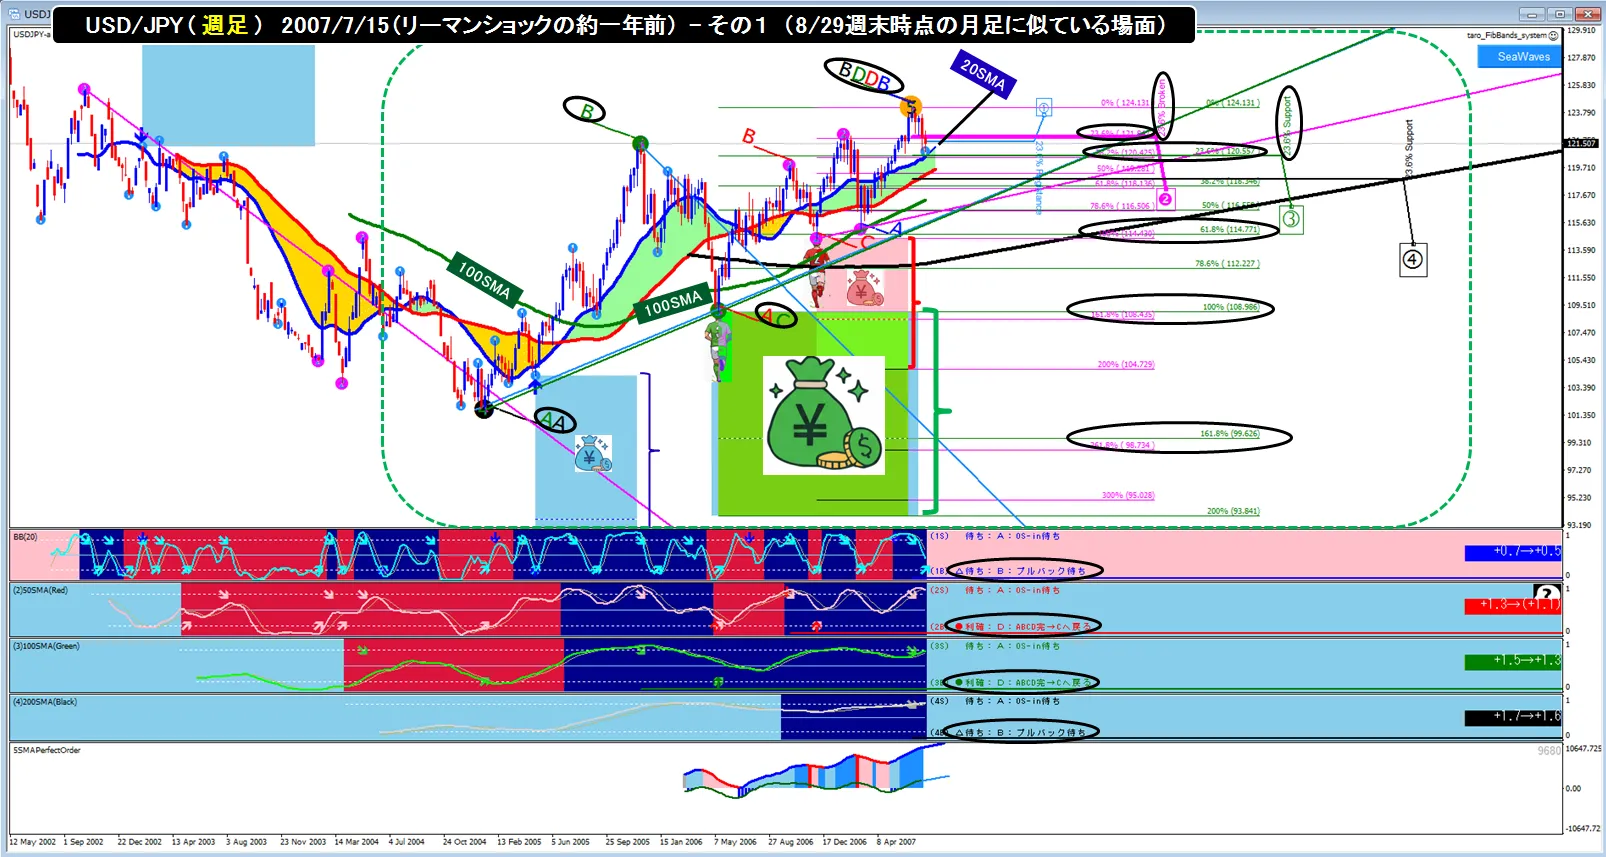
●Somehow it feels similar.
The green 100SMA forms ABCD with a resistance/support flip, and the red ②50SMA wave also forms resistance/support and rises; in contrast to the weekly chart, the red ②50SMA and blue 20SMA do not clearly act as resistance in the same way, but the similarity is approximate.
●When compared precisely, the monthly chart shows the head of the candles being resisted around red ②50SMA and blue ①20SMA at the green ③B→C area, after which the green ③CD section flips to resistance/support to form upward ABCD; on the weekly chart, however, the red ②50SMA and blue ①20SMA do not clearly create a resistance pattern, so technically they differ, but they feel similar.
●And what I want to emphasize is the upward ABCD in red ②at point C of red ②, I buy the dip (long) afterI take profits from D of red ②, with the 23.6% retrace of CD as a rough target, and if the close remains above, a band-walk-like ascent may occur, while if the close breaks below the 23.6% retrace, there is a possibility that the long position will revert back to point C.
●At the monthly chart, by the end of July, the 23.6% retrace of red ②CD has already been broken to the downside by the closeThe pink Fibonacci retracement level against the upward red ②50SMA in CD is the 23.6% boundary; on the monthly chart it is labeled “23.6% R-Flip,” and on the weekly chart it is labeled “23.6% Broken.” Since by end of July the 23.6% retrace has already been broken on the monthly chart, it would ordinarily be “Broken,” but because the provisional monthly close is yet to be confirmed and is above the 23.6% retrace, it is shown as “23.6% R-Flip,” indicating that a support-resistance flip is in progress. The term “R-Flip” may not be entirely accurate, but I’ve checked with Gemini several times and am using the English shorthand as best as I can, and I hope that’s acceptable… (my English isn’t strong)., and if D→C returns, the end-of-August monthly close must retreat to below the 23.6% retrace (158.296). As of the 8/29 weekend, the USDJPY price is 160.096, so from the 8/31 6:00 a.m. to 9/1 6:00 a.m., a drop of about 1.80 yen (180 pips) over 24 hours is needed. to potentially bring the end-of-month close on 9/1 into the zone below the 23.6% retrace of red ②CD (158.296) Thus, there is a scenario where the price could drop about 1.80 yen in a 24-hour span.
●
●One year before Lehman, I will display several weeks ahead on the weekly chart to confirm whether the close remains in the lower zone below the 23.6% retrace of red ②CD.
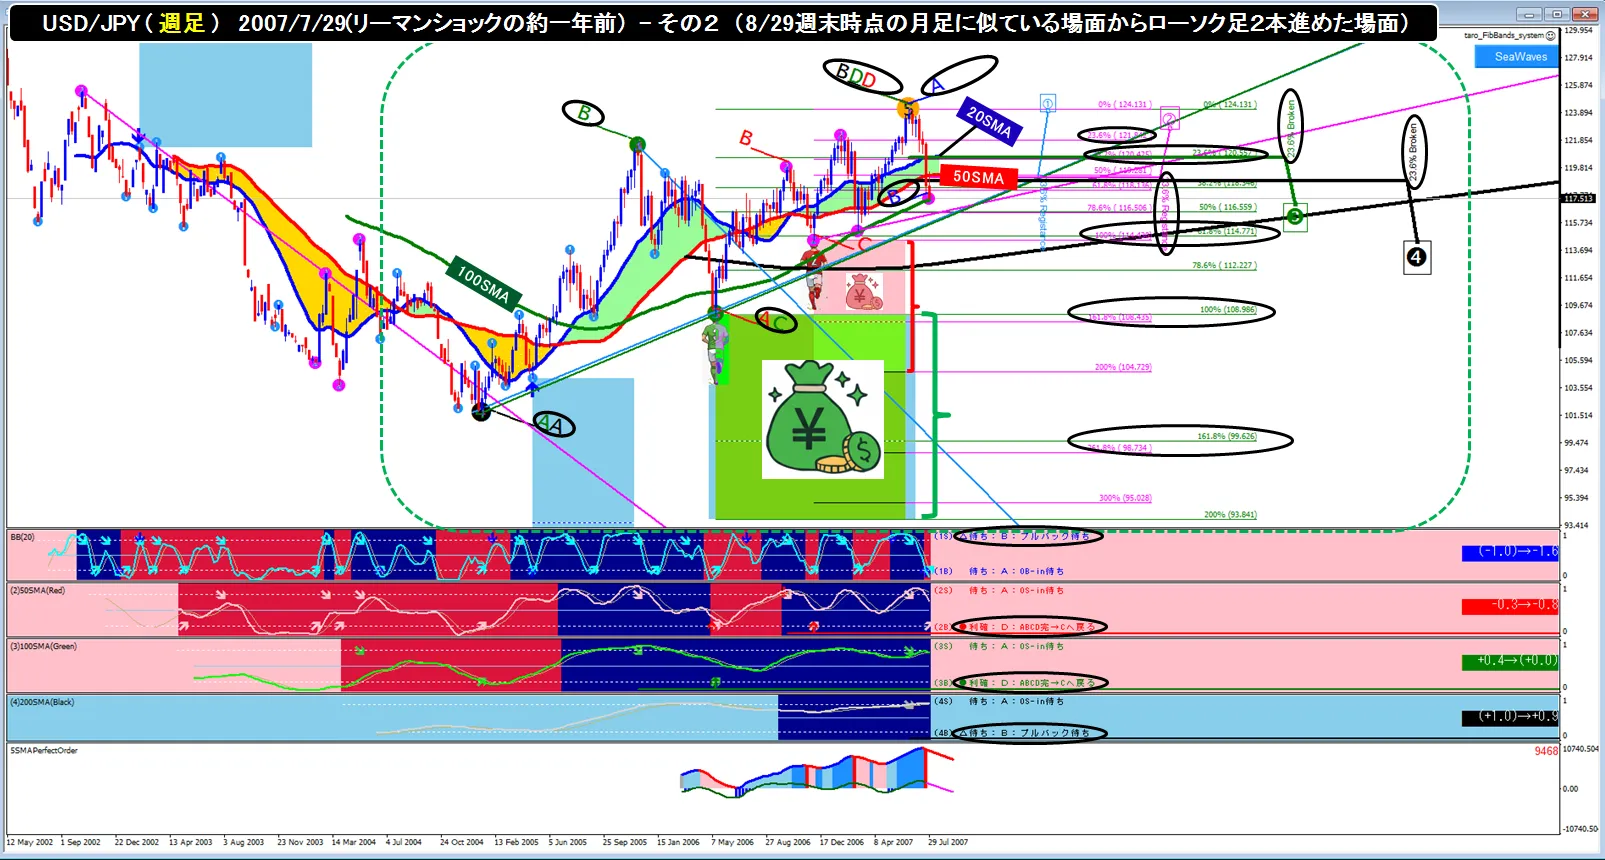
●The weekly chart from one year before Lehman shows, the close breaking below the 23.6% retrace of red ②CD, and the next candle holding the lower zone, followed by a large bearish candle.
●If, between 8/31 (Mon) 6:00 a.m. and 9/1 (Tue) 6:00 a.m., the price falls about 1.8 yen (180 pips) and the end-of-August monthly close remains in the lower zone under the 23.6% retrace support of red ②CD (158.296), and if the price moves similarly, there is a possibility that September’s monthly candle could drop with no upper wick.
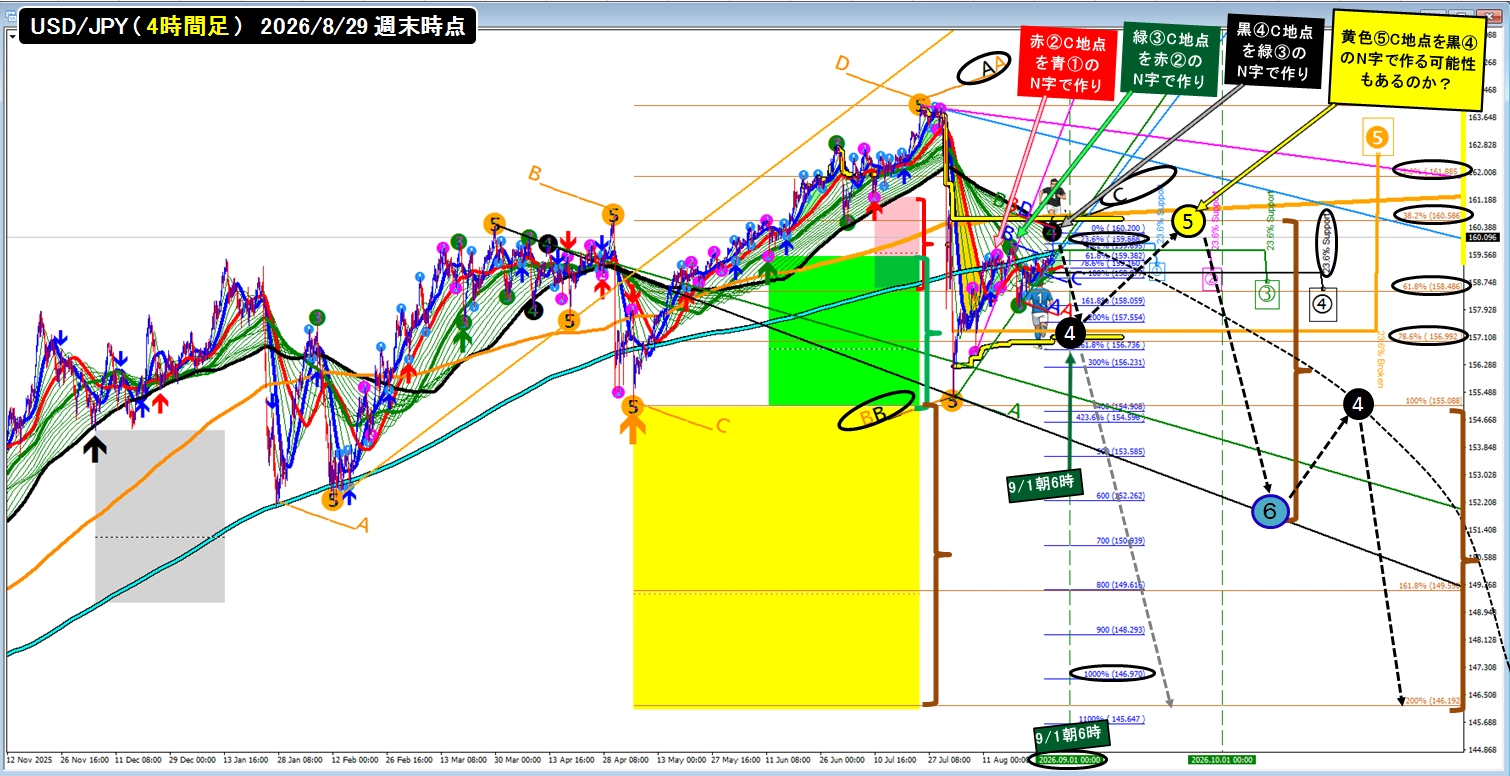
● I will display the four-hour chart as of 8/29 weekend and verify within the 24 hours from 8/31 morning to 9/1 morning whether the price can drop around 1.8 yen (180 pips).
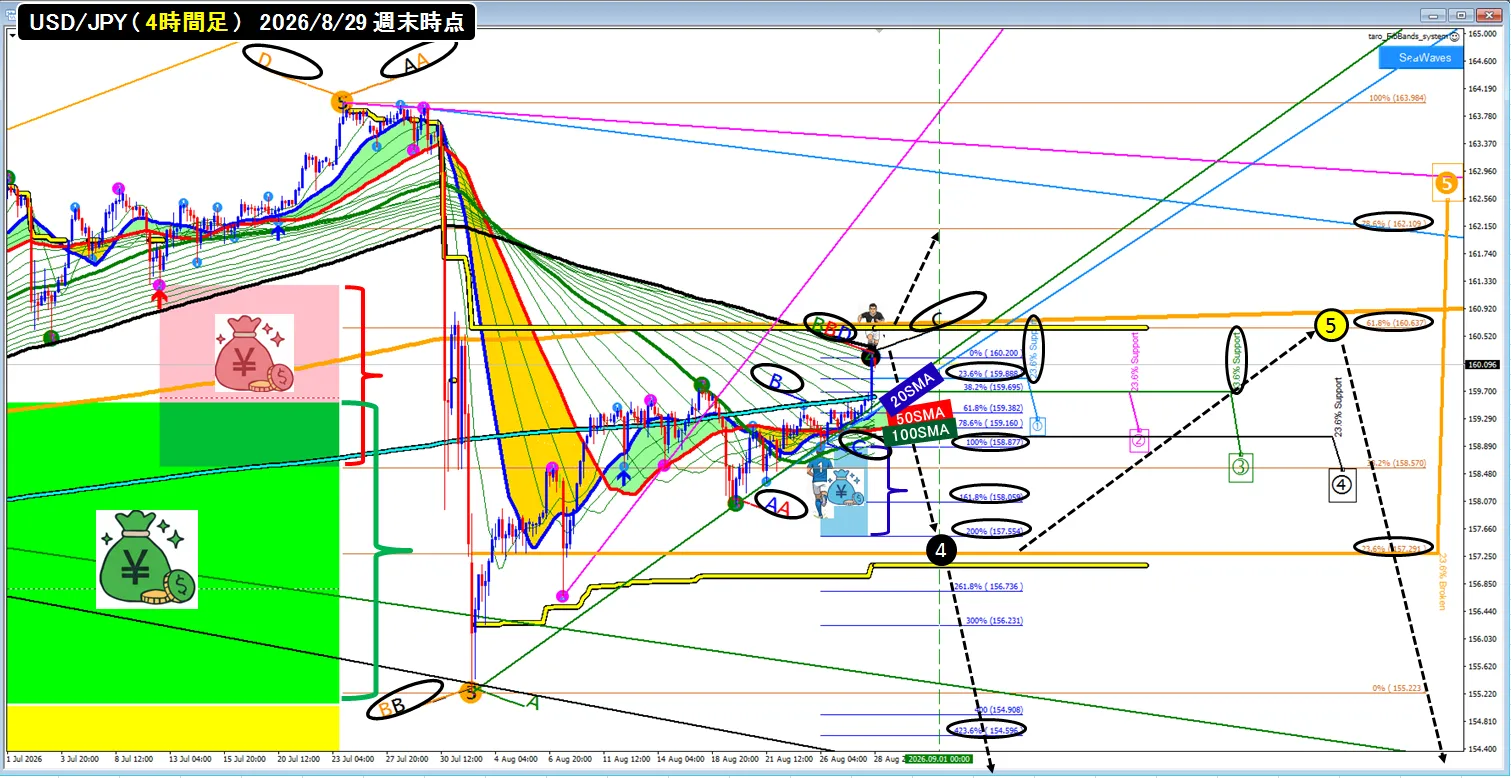
●Broad view: from the yellow ⑤ high to the yellow ⑤ low, there is an overshoot downward, then the price returns toward the vicinity of the black 200SMA around the C point and initiates a short entry as a pullback, breaking below the yellow ⑤ low (BB), suggesting the possibility of a move to break the yellow ⑤ high and drop below toward the yellow 61.8% retrace and the blue box lower edge as the next step. The basic plan is that at the C point the price would pull back and then move toward the black 200SMA with a head-resistance pattern around the head of the candle, and then the move could drop. If the black 200SMA is touched but the close doesn’t rise above, there is a risk of a drawdown to the blue box lower edge.. In practice, at the C point on black ④, the order would be to observe successive support/resistance flips across 5SMA, 10SMA, 20SMA, 50SMA, and 100SMA before entering short on a pullback, to be held until the price returns to the black 200SMA. If the price touches black ④ 200SMA and closes above, you could exit with a break-even, but there is a risk of a straight breakout. Think of it like soccer: when a player receives the ball on their line, there are those who trap it and pass to D, and those who immediately push forward without a proper trap. (This analogy may be a bit off.)
●And what’s important is the blue ①20SMA flipping to resistance/support and completing the ABCD with a higher high, creating the blue ① head high, so when the blue ① closes and the long is exited, price may return to the blue ① C point. Therefore, it’s more likely that the move from black ④ 200SMA will proceed smoothly.
●Focusing on the upward ABCD at blue ①, within the price action where green ③ 100SMA moves to push lower lows in CD, the price has pressed down with blue ① 20SMA but could not make a new low, broken above blue 20SMA to become overshort and rise to blue ① B point, and then a dip buy (long) entered near C around the blue 20SMA turning upward, with the move rising toward near black ④ 200SMA in AB ≈ CD fashion.
●Even next week, the price may continue rising, but whenever long positions on blue ① 20SMA are closed, the price could revert back to C point. And when it returns to C point, the leverage for blue ① 20SMA traders would be fully restored.How much leverage is that? It’s the leverage that allows moving the height of the cyan box..In other words, only the funds of traders using blue ① 20SMA for long positions would be used to take profit and instantly short, allowing a rapid drop to the cyan box lower edge. No help is required from traders using red ②50SMA, green ③100SMA, or black ④200SMA. Right now, the cyan box lower edge sits slightly above the yellow ⑤ 23.6% retrace support, but if it rises in the first half of next week and the candles touch the black 200SMA, then the cyan box lower edge, the yellow ⑤ 23.6% retrace support (157.291), and the 61.8% retrace support may align, making it theoretically possible for a drop of 157.29 in one day.
●The problem is that the yellow ⑤ low also serves as the yellow ⑤ B point,
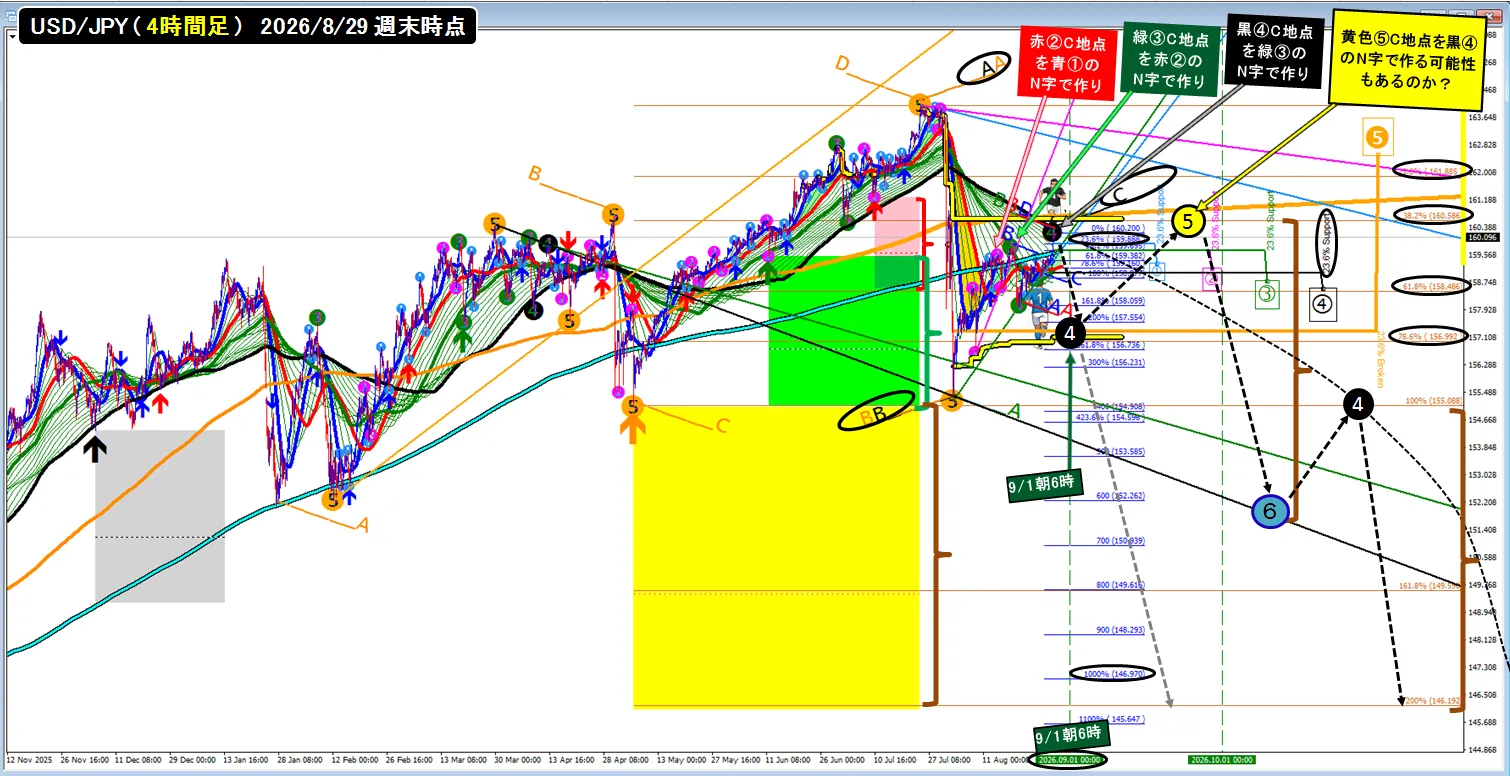
● The above chart is a four-hour chart scaled down, and the wave pattern suggests that
red ②50SMA’s point C is formed into the blue ① N-curve, green ③100SMA’s point C is formed into the red ② N-curve.
green ③100SMA’s point C is formed into red ②’s N-curve.
black ④200SMA’s point C is formed into green ③’s N-curve.
●The nearest low of yellow ⑤ shows a “yellow B,” and there is a possibility that yellow 400SMA becomes the retrace C point, and if so, after forming the yellow ⑤ high near the yellow 400SMA and yellow 61.8 retrace resistance, a move to turn by resistance/support at black ④ could occur and the price may drop toward the cyan box lower edge at black 200SMA.
●If that price action occurs, it may not follow Lehman-downmove and, I plan to monitor closely from next week to see what actually happens.
For reference, I’ll also display the weekly chart from the Lehman era to see how prices moved then.
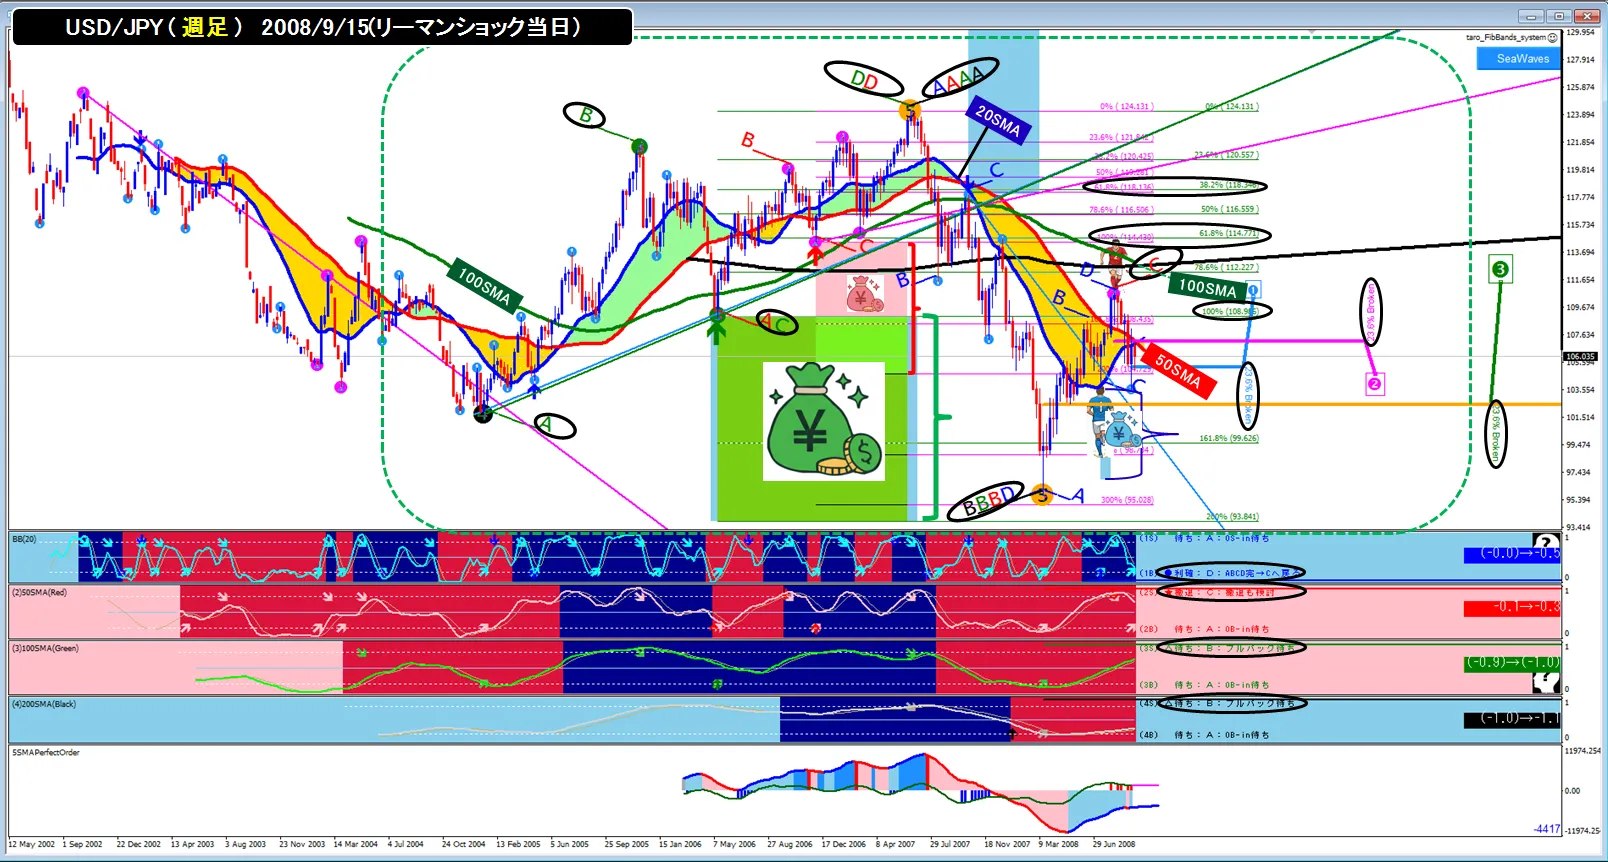
●The yellow ⑤ high is labeled as “DD” and “AAAA.”
●Looking at the movement, when blue ①20SMA flips to resistance/support and forms downward ABCD, overshoots to near the lower edge of green ③ box and drops to create yellow ⑤ low, at that moment, red ② B point, green ③ B point, and black ④ B point are formed. This implies that traders using the red ②50SMA, green ③100SMA, or black ④200SMA would aim to sell on pullbacks near the turning points as their moving averages head downward.
●In soccer terms blue ①20SMA’s player (Aoshima) uses the blue line to break through each line like Kaoru Mitoma or Junya Ito and progresses unimpeded, creating the B points in red ②50SMA, green ③100SMA, and black ④200SMA colors, with each player waiting on their own colored line (moving average) for the ball to advance before the ball goes beyond the B point. In reality, some passes go over the top.
●And, as seen on the weekend, the blue ①20SMA flips to resistance and builds upward ABCD while passing the ball to blue’s long-term targets, red ②50SMA and green ③100SMA and black ④200SMA, so three participants are waiting in the zone to receive the ball.
●So, a day like Lehman’s day could occur, where the long position using blue ①20SMA is exited to bottom out and then the area between red ②’s 23.6% retrace support and blue ①’s 23.6% retrace resistance contains the price body (close).
●After that, I will observe how far it drops and when the Lehman-era transition to Abe-Nomics begins to take shape.
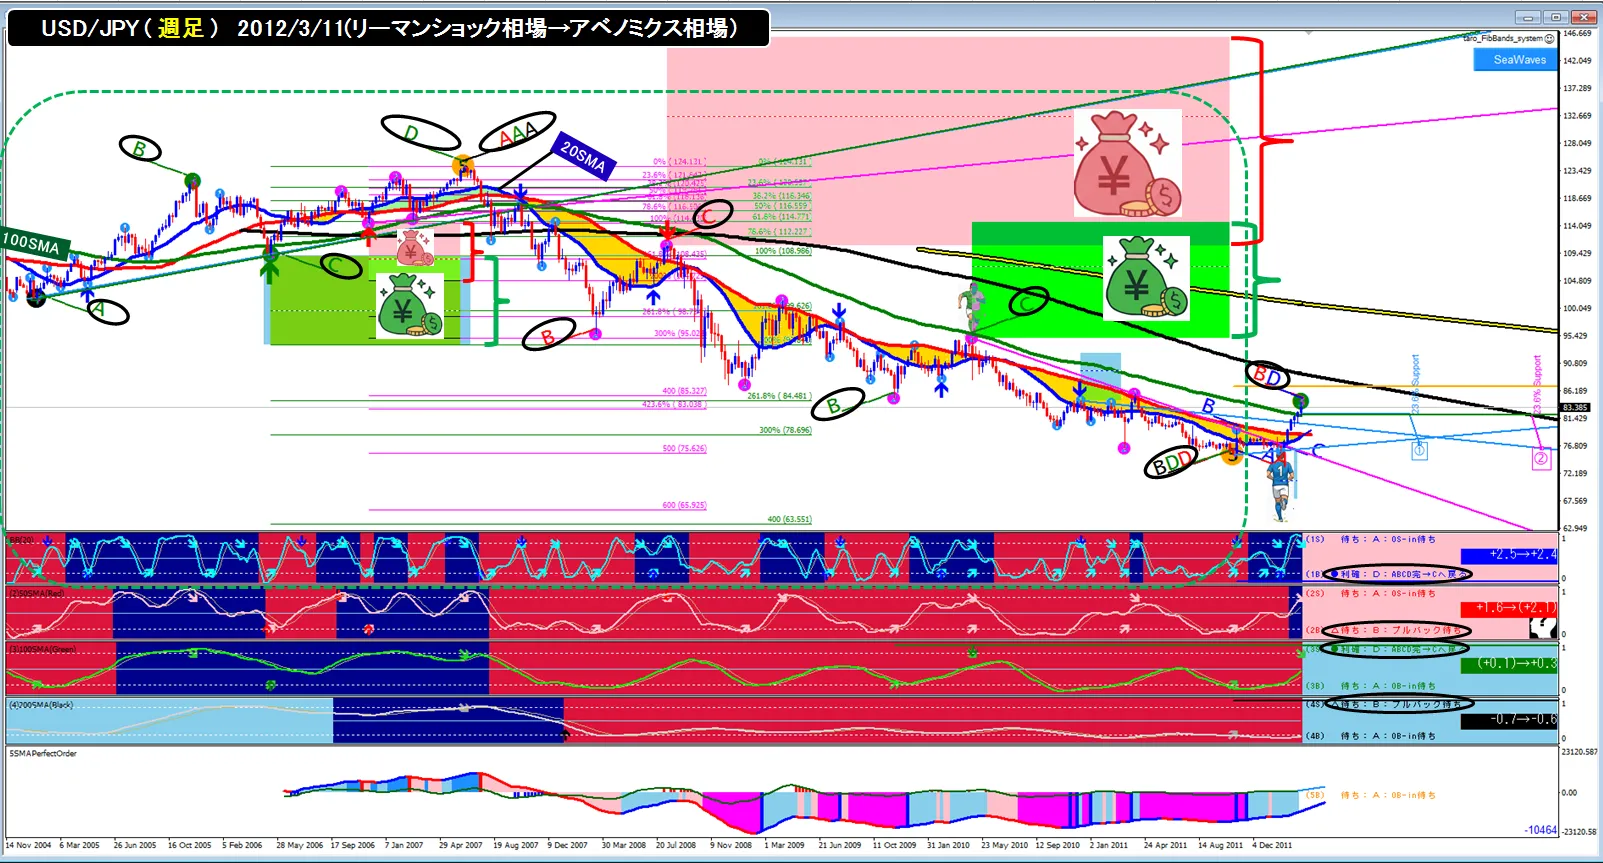
●> Then, from the price action after that, from red ② B point back toward red 50SMA at C point, breaking red B’s low and falling, then from green B point back toward green 100SMA, breaking green B’s low and falling, and then with blue ①20SMA resistance/support development, the red B point formed.(^^)
●For black ④, yellow ⑤ low is B point, and the situation is waiting for a pullback near the black 200SMA, but prices move straight upward without any flips in 5/10/20/50/100SMA, so the downward ABCD at black ④ 200SMA does not occur.
●The funds of traders who sold from green ③100SMA and red ②50SMA can be estimated somewhat.
●The cyan box sits below the green box on the right, and this shows examples where the short-covering returns to the C point (retrace high) and a larger moving average triggers a pullback, often seen in practice.
●The upper and lower edges of the box correspond to retrace highs and pullback lows, and observing how full margins that return to the traders’ hands are allocated among the different colored traders is very interesting. Traders, when margin returns to their hands, tend to want to hold long or short positions, so watching how they choose to use the margin as the chart progresses can give hints about what happens next.
●Personal wish is that, in the 24 hours from the start of next week (mon 8/31 to tue 9/1), the black 200SMA touch, the 23.6% retrace of the blue ① 4-hour up move and the 5SMA breaking down on the 4-hour close, a support/resistance flip, and the price begins to fall, and by the morning of 9/1 the monthly close would be confirmed below the 23.6% retrace of red ②CD (158.296)
(Wait for the four-hour blue ① CD’s 23.6% retrace (currently 159.888; changing with price) to be broken to the downside and for a head-resistance flip)
●I have homework to finish by 8/31, but I’m anxious as a mother about whether my kids will actually do it on time, given they haven’t started yet and whether they will finish the homework properly.
● If by the morning of 9/1 (Mon) a different development occurs, I will reanalyze. If the monthly close is confirmed above, there is a possibility of a small upward ABCD with 5SMA resistance/support inside red ②CD, and the price might make a new high. There are cases where red ② upward ABCD forms but blue ① upward ABCD does not touch blue 20SMA and still makes a new high.
● I am a day trader who does not hold positions across weeks or days, so I’m flexible, but I would love to see the kind of tense, high-stakes action in the world’s finest battles, like the World Cup, where forex is like a global competition between currencies, and I don’t want to watch a low-level game. If September’s monthly close turns into a large bearish candle, it would be an exciting matchup. I just want the excitement, like sports entertainment.