
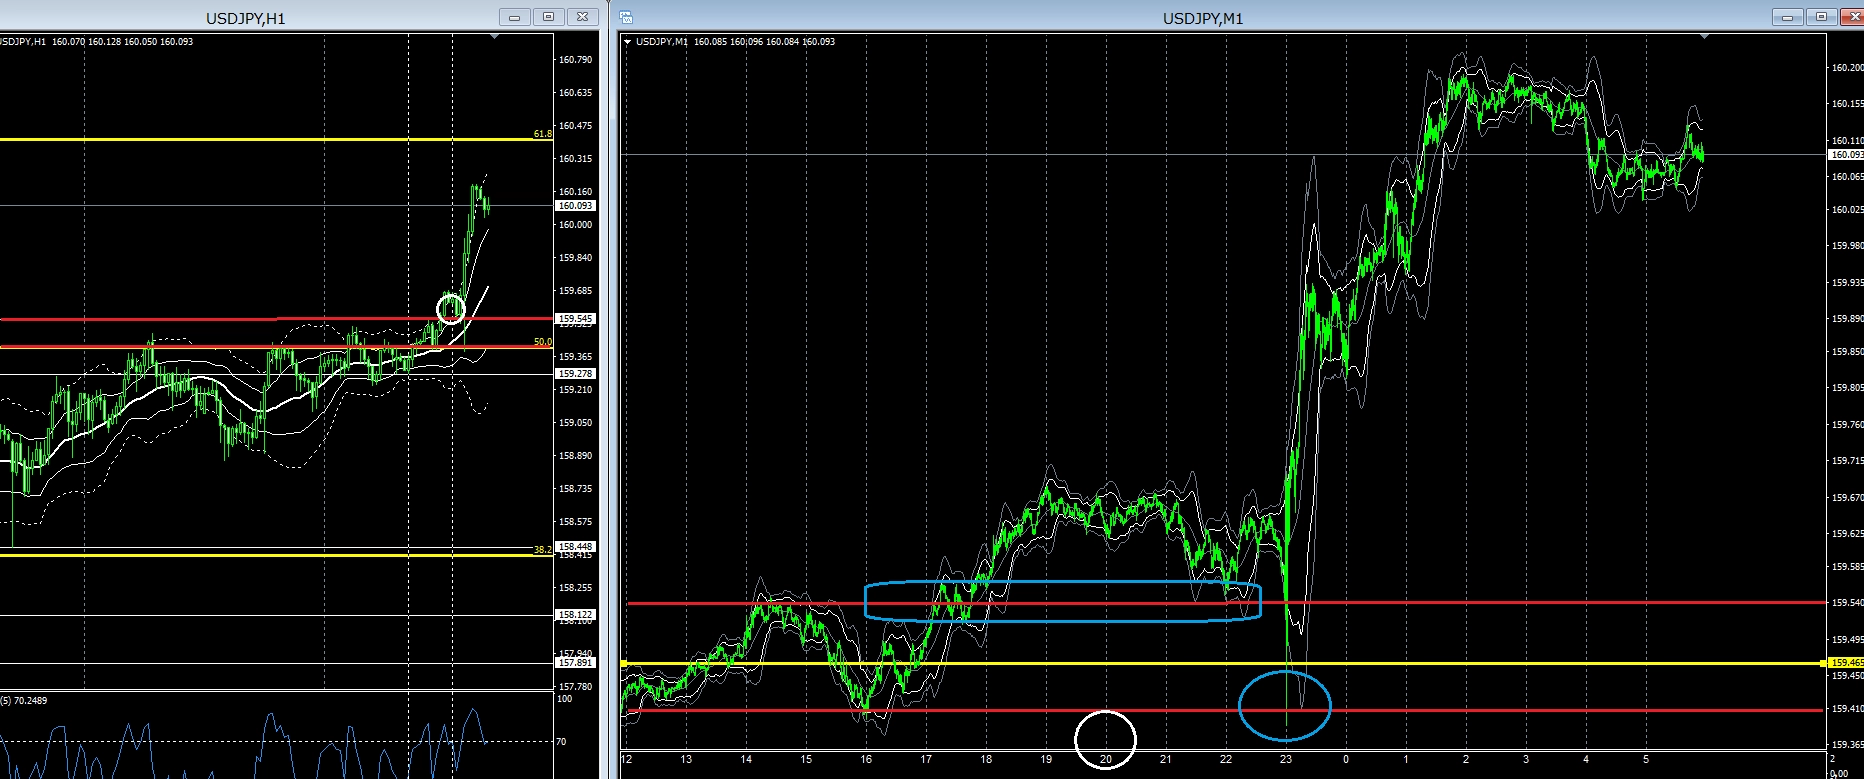
How should we view yesterday's USD/JPY?
2026 Latest Version!!
You can watch President Hayakawa of Gogojan and my dialogue VTR here
There are also free gifts.
This is information on new products!!

Please read the product information.
is.
Good morning everyone.
Yesterday's USD/JPY price range was about 80 pips.
The reason was, from 23:00, US economic indicators & FRB-related statements caused a large move to the yen’s weakness.
This is also just a retrospective explanation, so if those hadn’t occurred, this kind of rise wouldn’t have happened.
What this means is not to always predict movements, but to follow what I always say: “be flexible and view the chart from multiple angles.”
*However, predicting price movement one minute ahead or five minutes ahead is important.
What flexible means...
“Flexible (rin ki ō hen)” means,to take appropriate judgments and actions according to the situation and changes at that time and place, a four-character idiom.
Meaning points
To view things from multiple angles means...
“Multifaceted (takaketeki)” means,to look at or think about things from several different directions or perspectives.
Basic meaning and usage
If you lean toward one view, your field of vision narrows and you are more likely to make wrong judgments. To prevent that and approach from various angles is “multifaceted.” [1]
- Examine multifacetedly(examine and think from several aspects)
- Have a multifaceted perspective(grasp the situation from many positions and angles)
that is.
By translating these into trading and viewing the chart, your mind and the way you view the chart can become clearer.
USD/JPY 1-hour & 1-minute chart
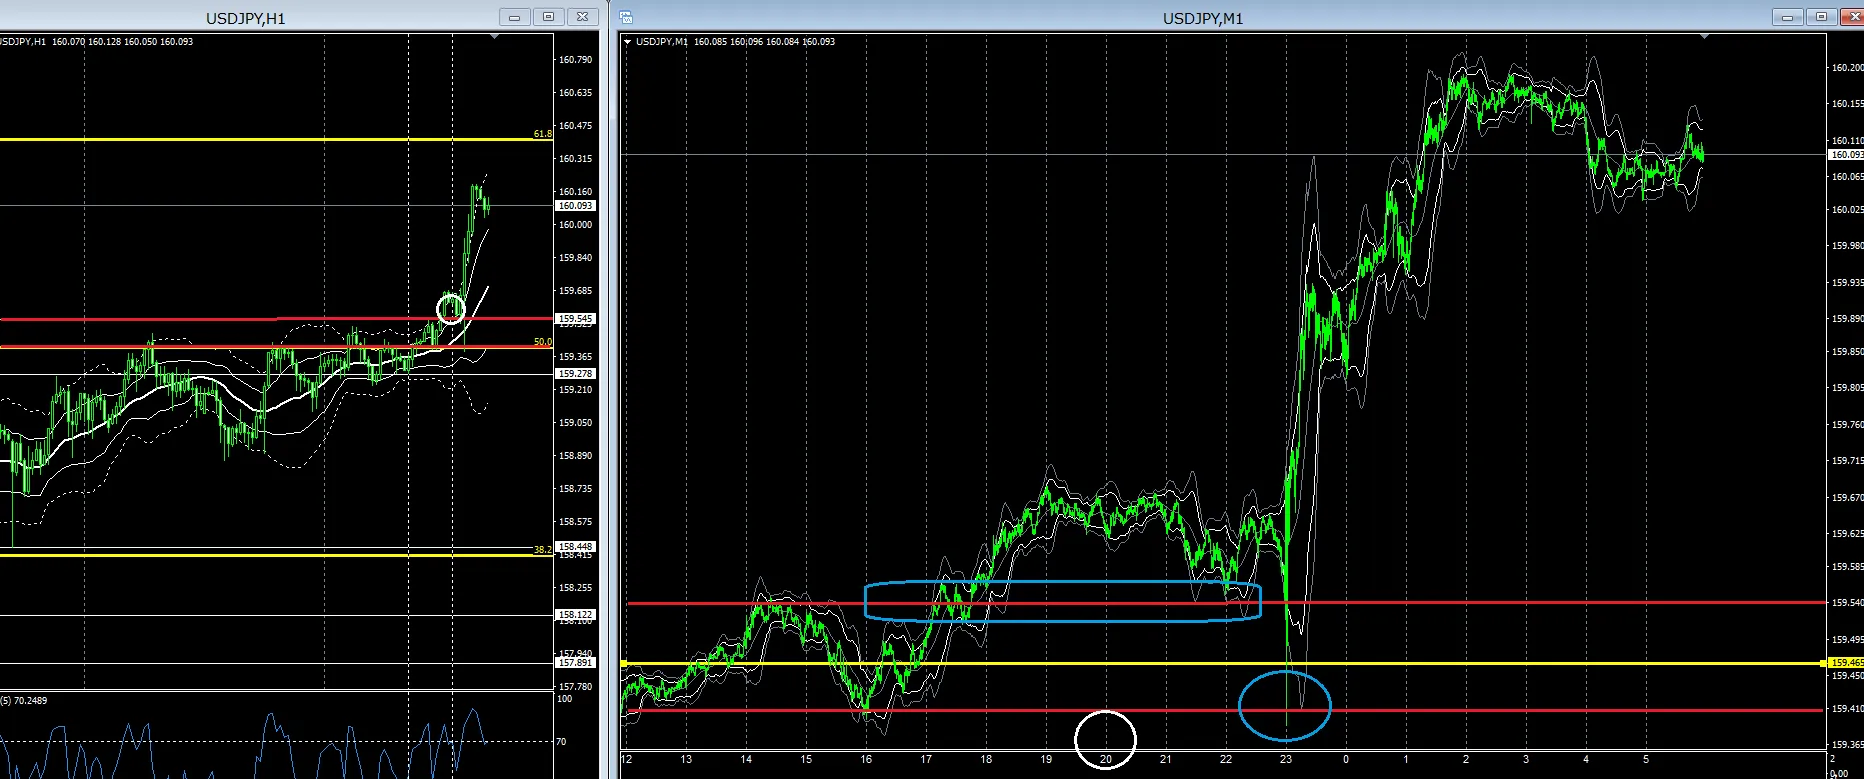
The two red horizontal lines are the Tokyo session highs and lows.
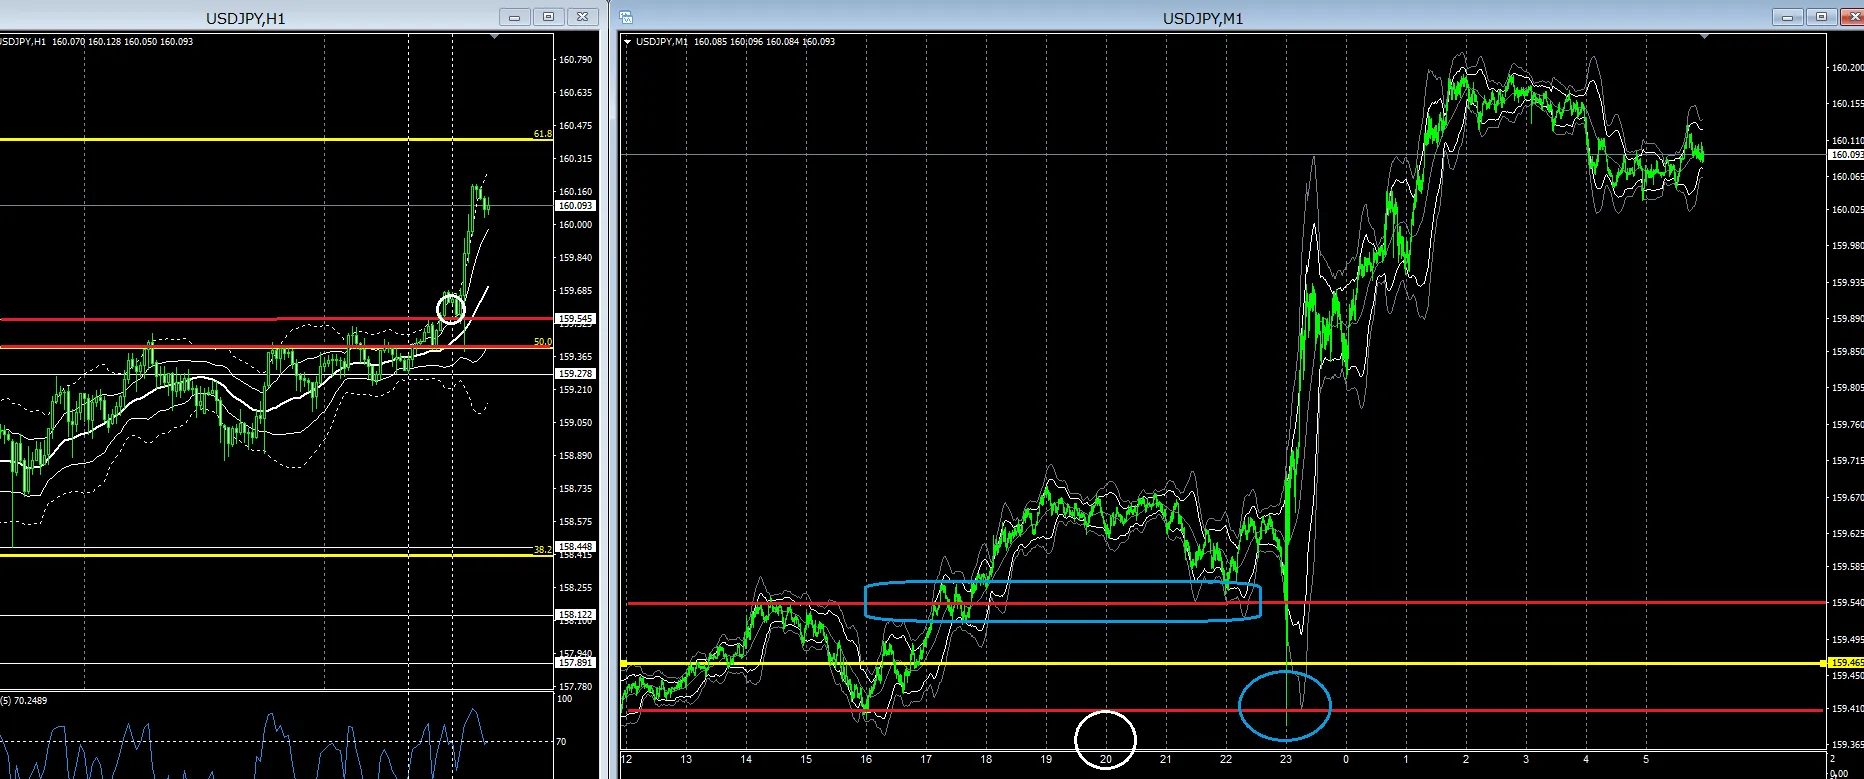
White circle marks the time when most of you would be back home, right?
Around 8:00 PM.
From the point where a decline occurred due to Japan-US coordinated intervention, it retraced about 50%, and yesterday the 50% line acted as resistance but there was an atmosphere it might become support.
By 8:00 PM, when most of you might have returned home, you could see the sense of support-resistance switching.
After 8:00 PM, is the option to push the blue square zone on the 1-minute chart to create an uptrend as a retrace?
Will it stay in a range like this?
Will there be a deeper retracement and then rise?
The retracement point is around the 50% line on the 1-hour chart, where support and resistance swap?
Is there further decline?
I think these four options cover the gist.
By combining these options with flexible and multifaceted thinking and viewing the chart, it will be easier to formulate your own strategy.
It's okay to choose just one option.
If it comes as you expect, do it; if not, you don't have to.
For example, if it retraces to the 50% line
FX trading is not about ordinary hedging
to take a long position (L).
That would be fine too.
Last night, with FRB involvement, it fell and then suddenly rose.
If you had taken a contrarian L position at the blue circle, it would have yielded easy profits.
Even this kind of hindsight scenario confirmation is absolutely useful for determining positions next time.
There is a clear difference between people who trade without thinking and those who trade with a well-founded personal theory and scenario planning.
Of course, the “accidentally” happens more often too.
Please explore scenario verification on past charts this weekend.
Thank you for your continued support today.
Anyway, for traders who desperately want to succeed in trading and make a living, the product I recommend, which can be learned on your own, is this trading technique ↓
Usually, price ranges when there is nothing else going on are about this much.
I think it would be fine to start the day with a fixed assumption.