
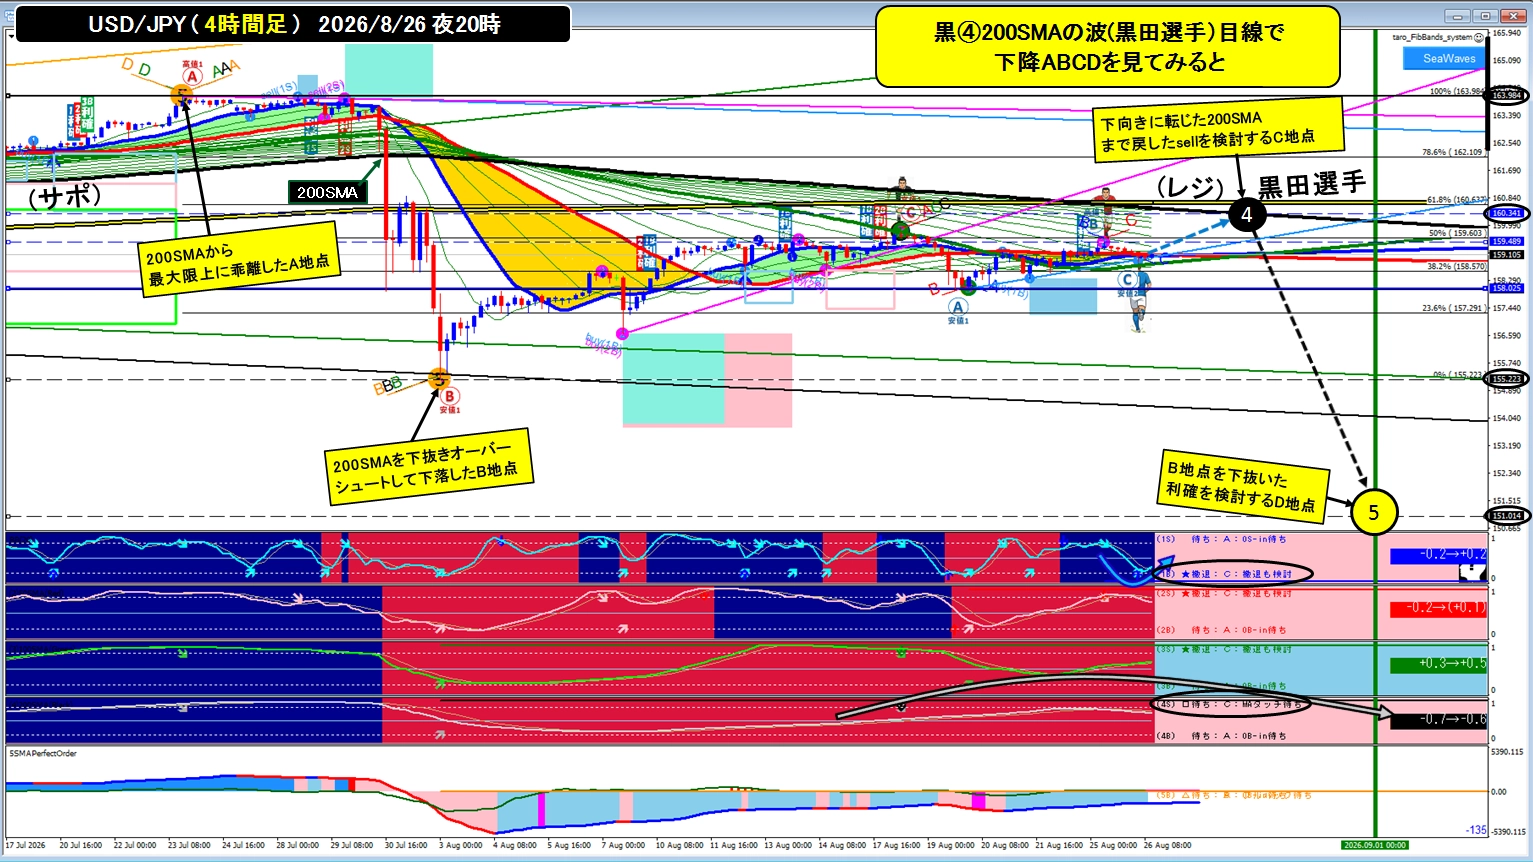
Consider support-resistance turning points with moving averages of large, medium, and small scales in soccer players at the World Cup (USD/JPY 4-hour chart on the night of 8/26)
Crossing the moving average lines to signal a support-resistance reversalthe price movement that crossesthe large, medium, and small moving averages (Blue ① 20SMA・ Red ② 50SMA・ Green ③ 100SMA・ Black ④ 200SMA)is depicted on one chart.
Soccerperspective,the price movement of a crossover moving average support-resistance reversalis
A point where from Point A you dribble or pass to move the ball across the moving averages to Point B,then,from Point B you pass the ball back to the moving averages up to the ball to Point C,andfrom Point C you advance forward with passes, shots, or dribbles to past Point B to Point Das an image.
More than soccer,rugby’s passing from Point B to Point C is not forward but must be backward, which may be a better fit conceptually,thoughI tried to present it in a soccer style recently due to the World Cup..
<Blue ① 20SMA Blue Island Playerthe perspective for considering a resistance-supply reversal>
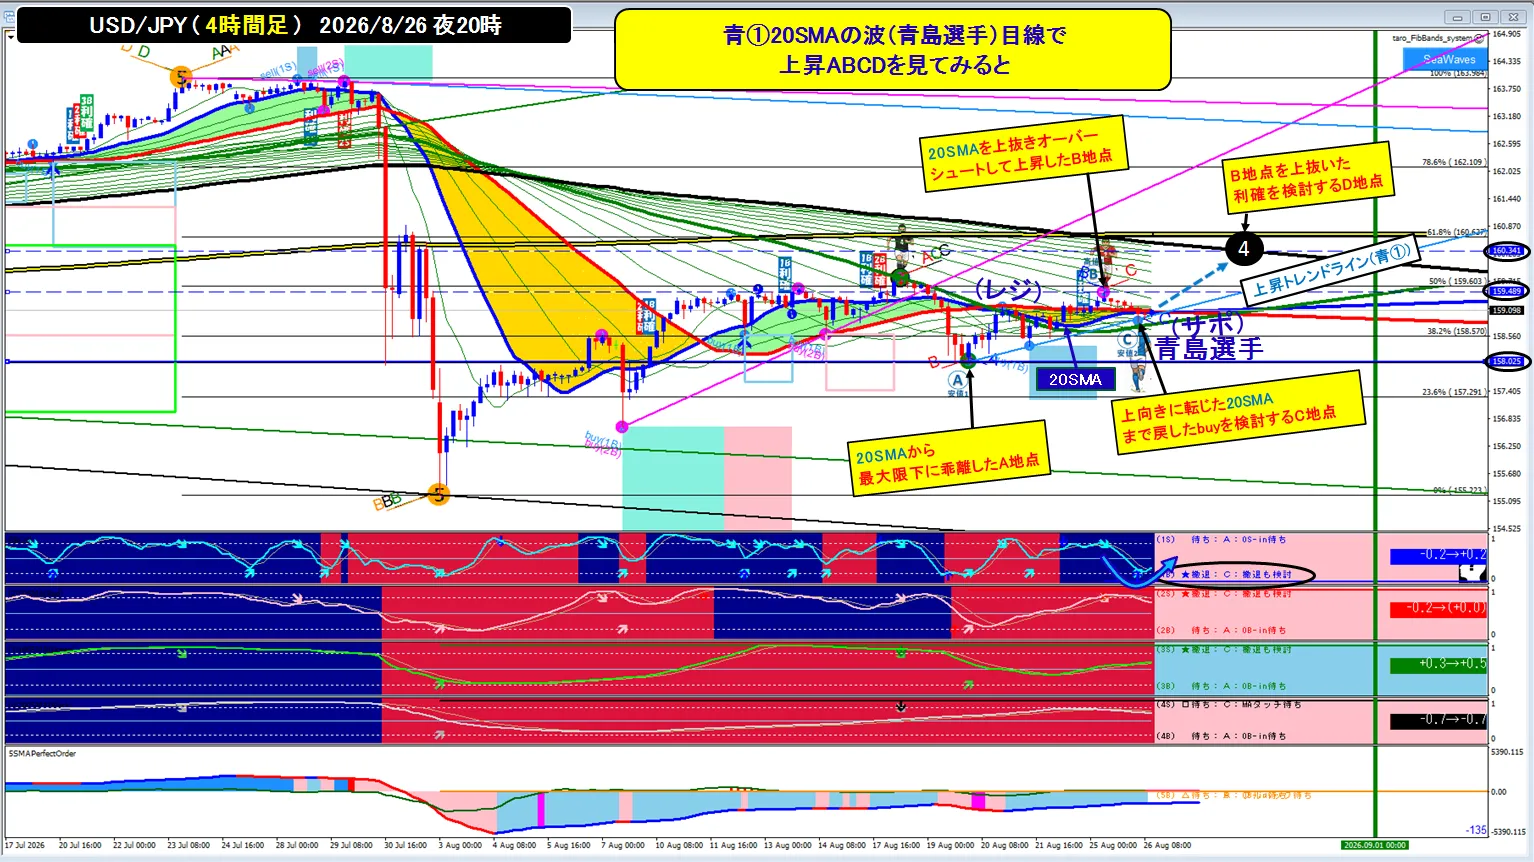
Point A: The lowest possible point where the blue 20SMA moving average presses the candle body as resistance and the price is furthest below the blue 20SMA (the largest deviation) is Point A..
(Soccerin this spot the ball is held,and from here is the start)
Point B:the position where the blue 20SMA moving average is broken upward and deviates above the 20SMA.
(Socceris to move the ball to forward teammates by pass or dribble)
Point C:the position where it returns to the upward-turning 20SMA from Point B. Here you consider buying on the dip (going long).The bottom stochastic shows a V-shaped reversalwhere the candle is supported by the blue 20SMA and reverses in a V-shapeto rise,here.A V-shaped reversal does not always succeed; there are cases where it fails to break above Point B.
(Socceris to pass the ball back from Point B to be received,and then. When watching the World Cup, you’ll see teams’ coordination mistakes or players’ own mistakes, and even with miraculous plays, skilled opponents can still take the ball away, which is amazing, butFX is like the World Cup of currencies, where representatives from around the world compete; imagining players fighting in that world is appropriate.)
D地点:the point where it crosses above Point B from Point Cbecomes Point D.AB=CD forming an N-shaped wave is drawn as a candidate for D,and the example imagining a high at Black ④ being formed..If Point B is broken above, Point D is formed and ABCD is completed; thus the N-shaped Point D is for reference only and you can take profit anytime..Generally, when everyone takes profits, price returns to Point C, the margin returns to the traders, who can use that margin to take new positions either up or down.
(Socceris thatPoint Dcorresponds to a teammate or a goal)
<Red ② 50SMA Red Star PlayerPerspective for considering a resistance-supply reversal>
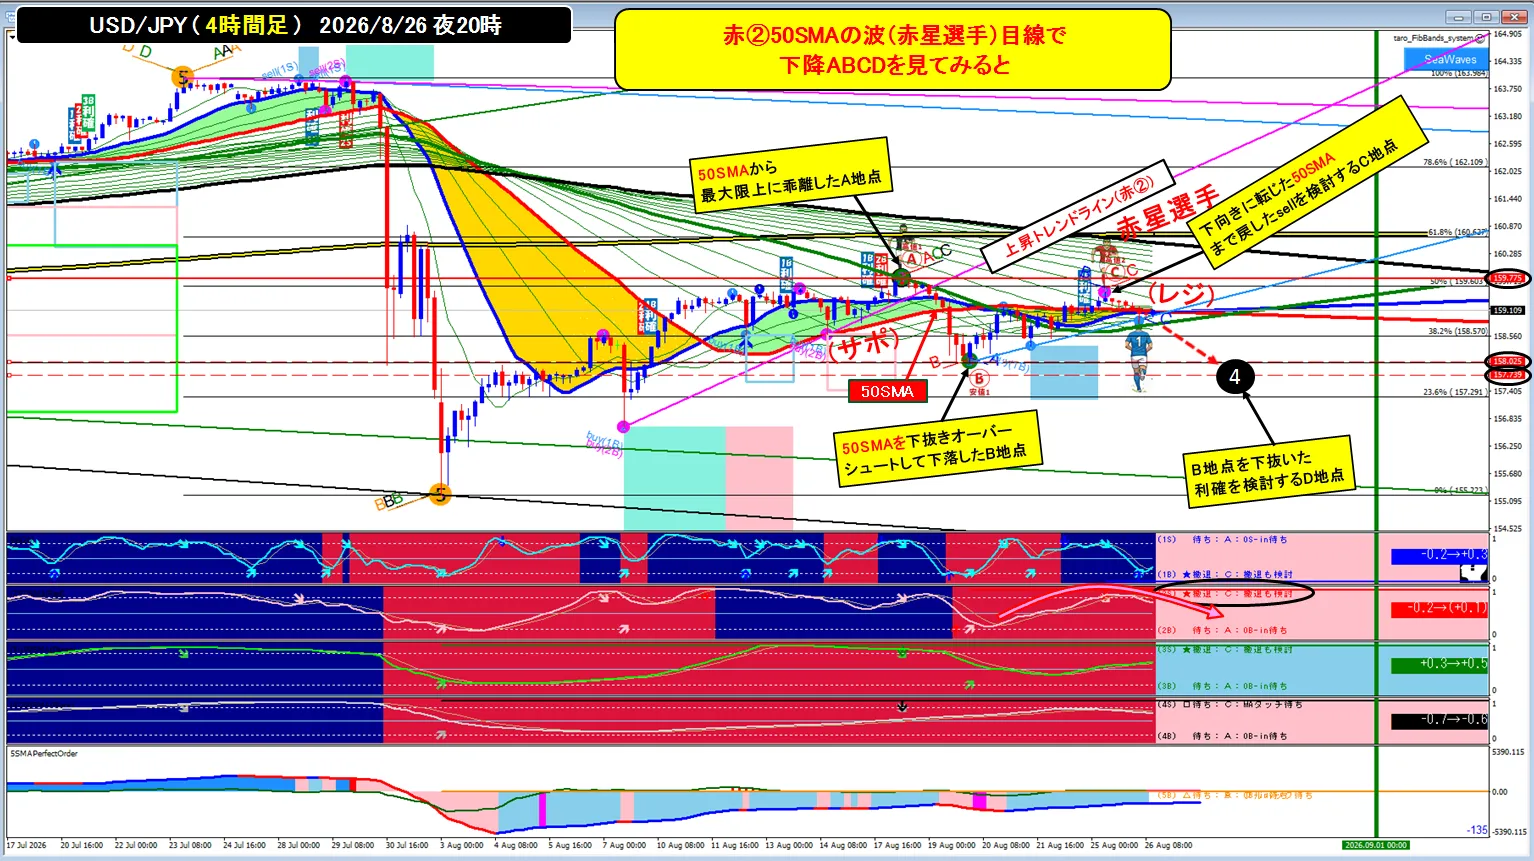
Point A: The point where the red 50SMA moving average supports the candle and the uptrend is formed, moving upward, with the price deviating the most above the red 50SMA.
(In soccer this is where you hold the ball; from here is the start)
(In soccer, from Point A you move the ball to forward teammates by pass or dribble)
C地点:从B地点向下转折并回到50SMA的C地点。此点考虑回撤卖出(做空)。下方的随机指标形成反向V字形时,收盘价在红色50SMA之上一致。(这时进行回撤卖出)反向字反转对应下跌的地方。必ず逆V字反转成功并非总是;也有无法突破点B而失败的情况。本次情况是现在红50SMA已由K线实体向上突破,考虑撤退(例如收盘价突破后回落至红50SMA处±0撤退)这样的情形ですが、です。
(Soccer: Point D corresponds to a teammate or a goal)
<Black ④ 200SMA Kuroda PlayerPerspective for considering a resistance-supply reversal>
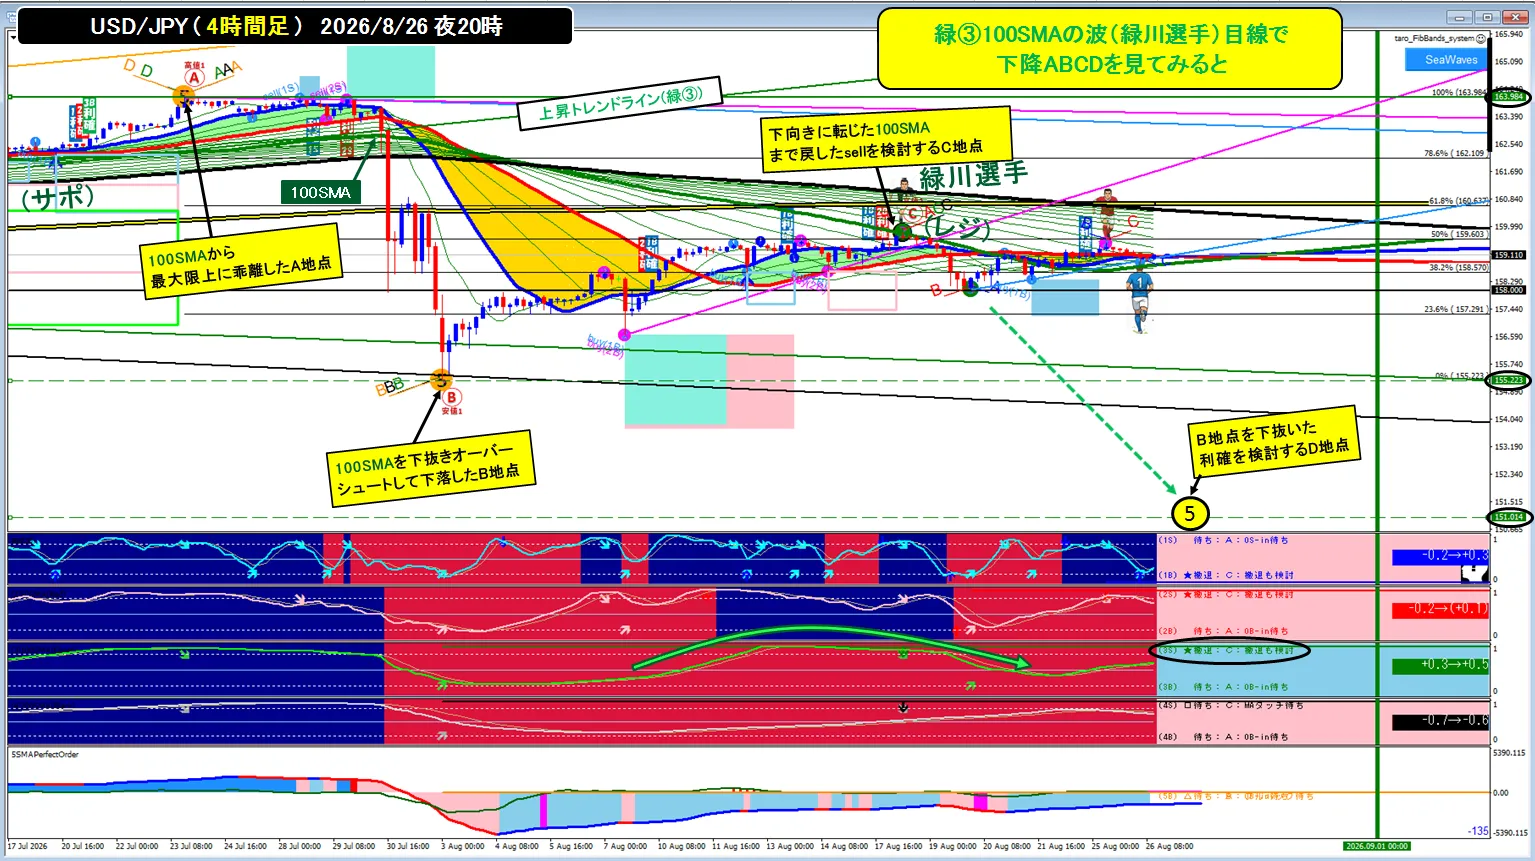
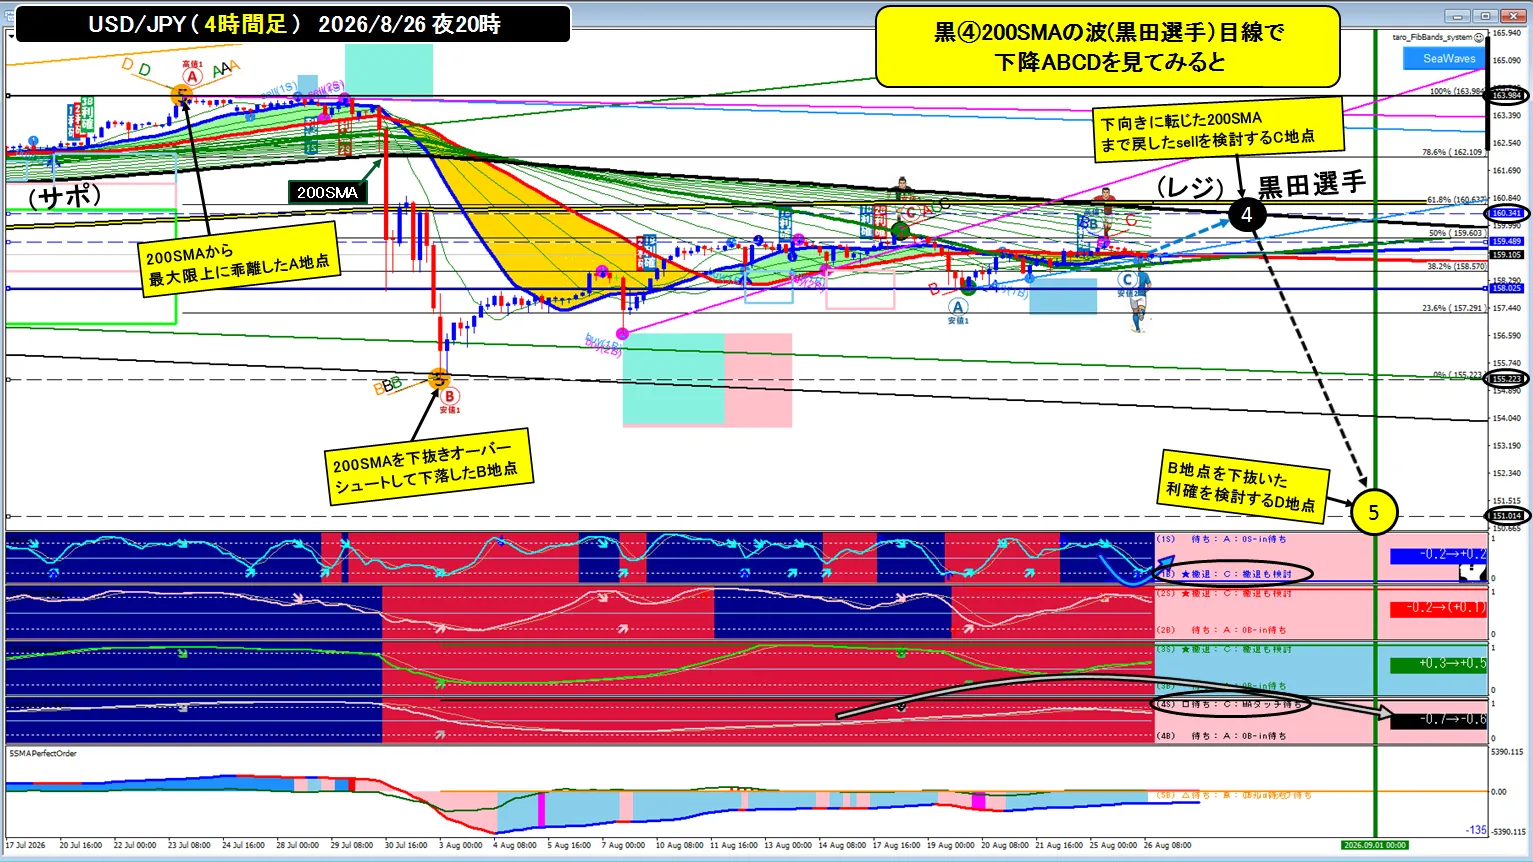
A地点:黒色の200SMA moving average supports the candle and an upward trend rises; the point where the black 200SMAis deviated the most above is Point A.
(Soccer, at this point you hold the ball, and from here is the start)
(Soccer, from Point A you move the ball to forward teammates by pass or dribble)
(Soccer: Point D corresponds to a teammate or a goal)
●Example of selling (short) at resistance-reversal for Black ④ 200SMA (Kuroda) with blue ① 20SMA rising to create a reverse-N high with blue ① as the resistance?; we showed blue ① 20SMA rising to N shape and Black ④ high forming. we showed this example, but in this way, market movements often involve resistance-reversal and support-resistance reversals across multiple moving averages working in concert.
●We showed four moving averages,but,facing off against top traders from around the world,imagining that seems enjoyable(^^
●By late July, I expect the monthly close to have already broken below the 23.6% retracement support (around 158.0), and also breached +1σ and the 5SMA on the monthly close,and by the end of August I hope the monthly close stays as low as possible under 158.0 (support-resistance reversal),in about five days, what combination of moving averages for support-resistance reversals would be most effective at driving down?
●A week-by-week chart from a year ago vs the current monthly chart look very similar,and if it moves similarly, August’s monthly candle could form a long upper shadow with a negative line,,If Oda Nobunaga moves in the opposite direction, would he cut losses immediately? If Toyotomi Hideyoshi has moneyed people push the price down forcibly? If Tokugawa Ieyasu waits patiently until the target price drops?What is historically the right move?Is it possible to actually win FX World Cup rather than just theorize?