
NK225 Futures MTF Dow Theory Four-Scenario Analysis Report 2026-08-25
NK225 Futures MTF Dow Theory Analysis Report
Date and Time: August 25, 2026 06:16 JST / Night Session
Current Value: 65,360 JPY
Target: For the day session (Tue, 8/25)
Conclusion
In summary, during 8/24 the intraday high was sold at 66,250, and after entering the night session it declined to 65,260. It then retraced to 65,950 but could not sustain, dropping to 64,850 and then recovering to 65,590 before closing at 65,360. The 4H shows a loss of the uptrend and shift to a range and a downward wave; the 1H and 15m indicate downward trends and downward waves. The direction is aligned downward, but the close rebounded 510 yen from the low, suggesting it found support above a thick lower band.
In the near term, treat as a range of 64,680–66,460. If it stalls at 65,470–65,590 (15m reversal price–1H reversal price), consider selling into rallies; if it retraces to 65,800–65,950 and stalls, scale in more shorts. If it rebounds on dips at 65,150–65,270 or 64,850–65,050, look to buy the dips, and a 1H close back above 65,590 would be a bullish sign. If it breaks above 65,950 (15m retracement high = MA convergence belt) on a 15m close, switch to breakout buying; a break below 64,680 (4H support) would turn the 4H down as well. Above, 66,950–67,000 and below 65,050–64,950 are thick supply/demand zones, and only after confirming closes beyond those outer zones should one aim for moves beyond them.
4H Analysis
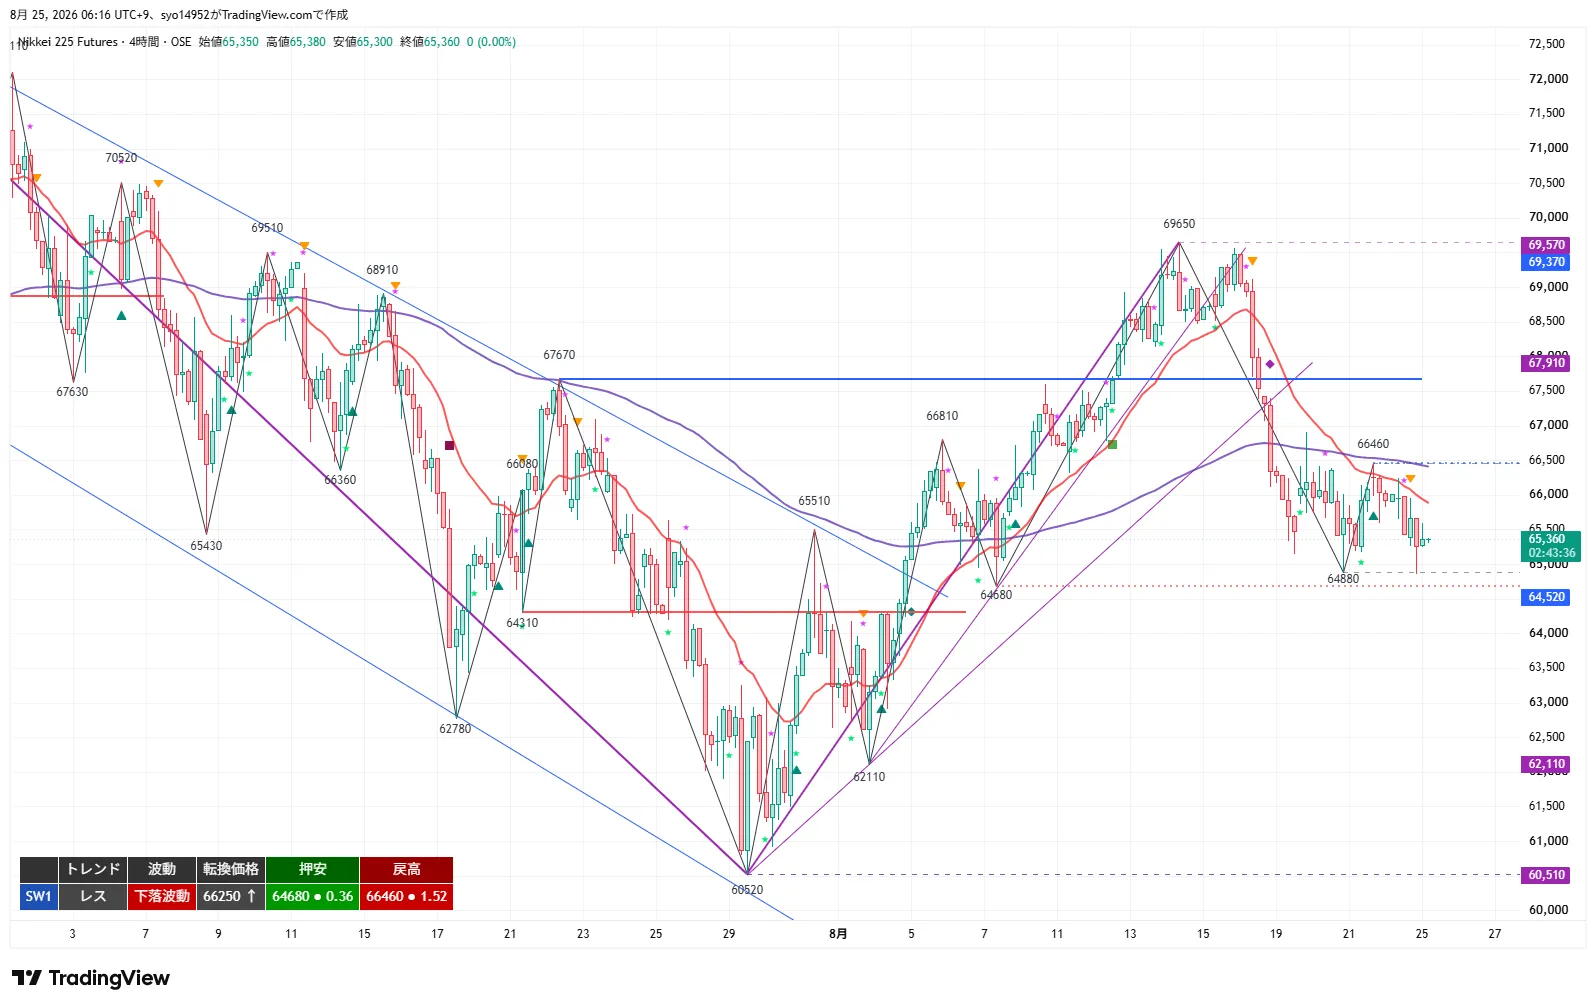
The 4H has finally lost the uptrend and moved into a range. From a drop starting at 69,650, retracements formed lower highs of 66,900 → 66,460 → 66,250, with the retracement high settled at 66,460. The wave remains bearish, and the reversal price is 66,250. The most recent leg opened at 65,350 and closed at 65,360, and the downward momentum has temporarily slowed.
The 20EMA (around 65,900) is negative in slope, and the 120EMA (around 66,480) is turning downward as well; price remains beneath both. Since the support at 64,680 still exists, a near-term range of 64,680–66,460 is most realistic. Upper levels are 66,250, 66,460, with 66,950–67,000 forming the thickest boundary above. If the downside breaks the close below 64,680, the downtrend will turn, with 64,520, 64,310, and 63,820 as subsequent targets.
1H Analysis
The 1H is in a downtrend and a downward wave. After hitting 66,460, the retrace high was lowered to 66,250, and from intraday to night session on 8/24 it fell to 64,850. The close is 65,360, a 510 yen rebound from the low. The reversal price is 65,590, 230 yen above the current price. Only a 1H close above this level would turn the downward wave into an uptrend.
The 20EMA around 65,500, the 80EMA (4H 20EMA equivalent) around 65,900, and the 480EMA (daily 20EMA equivalent) around 67,200 are all sloping downward, with prices below all of them. The MA alignment is downward. Practical upside targets are around 65,470–65,590 and 65,800–65,950, where selling into rallies would be applied. Support areas include a point near 65,270 and a thick band at 65,050–64,950, with 64,680 as a progressive target if reached.
15m Analysis
The 15m chart shows a downtrend and downward wave. After peaking at 66,250 intraday on 8/24, selling occurred; in the night session it fell to 65,260, then retraced to 65,950 but did not continue, dropping to 64,850. It then recovered to 65,360 at close. The swing low 65,580 has already been breached on the close, with retracement high at 65,950.
The 20EMA around 65,390 is flat with price largely hugging above it; the 80EMA (1H 20EMA equivalent around 65,510) and the 320EMA (4H 20EMA equivalent around 65,990) are both negative, keeping upper limits restrained. Reversal price 65,470 is 110 above the current price; if closed above here, the near-term wave turns up. Conversely, closing below 64,850 would resume the downtrend, but the area around 65,050–64,950 is a zone that often halts the decline.
MTF Status
- 4H: Range / Downward wave. Reversal 66,250; support 64,680; retrace high 66,460. Lost the uptrend signal and shifted to a range; retrace high confirmed at 66,460. 20EMA and 120EMA both negative; price below both.
- 1H: Downward / Downward wave. Reversal 65,590; support 68,510 (X); retrace high 66,250. All MAs downward; price below all.
- 15m: Downward / Downward wave. Reversal 65,470; support 65,580 (X); retrace high 65,950. 20EMA flat, 80EMA and 320EMA negative.
- Consistency: 4H, 1H, and 15m all align in a downward wave. However, the night’s low of 64,850 briefly dipped below the thick lower band but closed above, so the downside may struggle to extend cleanly.
Important Prices
- 66,950–67,000 JPY: The thickest zone for upside supply/demand. A close above this would change the market’s character. Upper bound for T2 of item 1.
- 66,460 JPY: 4H retrace high and 8/22 high. Upper boundary of T2 for item 1.
- 66,250 JPY: 1H retrace high, 4H reversal price, intraday high of 8/24. T1 and main formation line.
- 66,000 JPY: Middle upper level. 15m 320EMA band (4H 20EMA equivalent).
- 65,950 JPY: 15m retrace high and 8/24 night high. Break price for item 1 and Zone 3 upper boundary.
- 65,800 JPY: Key level. Zone 3 lower boundary.
- 65,590 JPY: 1H reversal price. Main formation line for Zone 2 and Zone 3 upper boundary.
- 65,470 JPY: 15m reversal price. Zone 3 lower boundary.
- 65,360 JPY: Current price / Night close price.
- 65,270 JPY: 8/24 night low. Zone 2 upper boundary and Zone 1 T1.
- 65,150 JPY: 8/19 intraday low. Zone 1 lower boundary.
- 65,050–64,950 JPY: The thickest lower-band for downside; a zone where declines tend to halt. Center of Zone 2 for item 2 and Zone 3's T2.
- 64,850 JPY: 8/25 night low. Briefly went below a thick zone but closed back above. Preliminary signal for Zone 4.
- 64,680 JPY: 4H support. If broken, 4H turns downward. Break reference for Zone 4.
- 64,520 JPY: 4H pivot. Crossing point for Zone 4.
- 64,310 JPY: July pivot. Zone 4 T1.
- 63,820 JPY: Next downside target. Zone 4 T2.
Trading Ideas
1) Breakout Follow-Through (Long)
- Trigger: Close above 65,960 (above 15m retrace high 65,950).
- Pre-entry price: 65,960. After breakout, look for pullbacks toward breakout price vicinity or toward the inclined 20MA on shorter timeframes (back-entry).
- Actual entry price: 66,260 (1H close above).
- Stop loss: 65,780 for the pre-entry, 65,940 for the main entry. Full exit 65,460.
- Targets: 66,250 (partial take + cost basis shift), 66,460, 66,900. Do not extend beyond 66,950–67,000 without a close above.
- RR: T1 66,250 = 1.6; T2 66,460 = 2.8; T2 final (66,900) = 5.2.
- MFE protection: bail at +200 for cost or small profit, lock in at +300 with at least +100 or trail. Move forward after approaching 66,900.
◎ 2) Buy on Dips (Long)
- Standard: Zone 1 65,150–65,270 (8/19 intraday low–8/24 night mid low), Zone 2 64,850–65,050 (8/25 night low–upper end of thick lower band). Confirm a clear reversal pattern within the zone by the 15m close.
- Pre-entry price: 65,220 (if entering from deep dip zone, replace stop with 64,780).
- Actual entry price: 65,600 (1H close above).
- Stop loss: 65,040 for pre-entry, 64,840 for main entry. Full exit 64,660.
- Targets: 65,590 (partial take + cost basis shift), 65,950, 66,250. 65,470 treated as a waypoint.
- RR: T1 65,590 = 2.1; T2 65,950 = 4.1; T2 final (66,250) = 5.7.
- MFE protection: bail at +200 for cost or small profit; +300 for at least +100 or trail. Shift forward near 65,950 and adjust if necessary.
3) Sell on Rallies (Short)
- Standard: Zone 1 65,470–65,590 (15m reversal price–1H reversal price), Zone 2 65,800–65,950 (pivot–15m retrace high; MA convergence belt). Confirm stall pattern within the zone by the 15m close.
- Pre-entry price: 65,520 (if entering from Zone 2, replace stop with 66,020).
- Actual entry price: 64,840 (1H close below).
- Stop loss: 64,890 for pre-entry, 64,860 for main entry. Full exit 65,980.
- Targets: 65,270 (partial take + cost basis shift), 65,050. After closing below 65,000 on close, extend to 64,680.
- RR: T1 65,270 = 1.8; T2 65,050 = 3.4. If extended, 64,680 = 6.0.
- MFE protection: bail at +200 for cost or micro-profit; +300 for at least +100 or trail. Near 65,050, move earlier and exit if break cannot be confirmed.
4) Breakout Follow-Through (Short)
- Trigger: Break below 64,660 (below 4H support at 64,680) on a 15m close. A close below 64,850 is a pre-signal.
- Pre-entry price: 64,660. After break, look for pullbacks toward breakout price vicinity or toward a slope of 20MA on shorter timeframes (back-entry).
- Actual entry price: 64,300 (1H close below).
- Stop loss: 64,890 for pre-entry, 64,860 for main entry. Full exit 65,480.
- Targets: 64,310 (partial take + cost basis shift), 63,820. 64,520 is a low-RR point and treated as a waypoint.
- RR: T1 64,310 = 1.5; T2 63,820 = 3.7.
- MFE protection: bail at +200 for cost or micro-profit; +300 for at least +100 or trail. After a thick support is broken, false breaks and sharp rebounds are common, so protect early.
Current Actions
- Most important Line 1: 65,590 JPY — 1H reversal price. 230 above the current price. If it stalls around 65,470–65,590, then scenario ③ applies; if it recovers on the 1H close, scenario ② becomes the main formation.
- Most important Line 2: 64,850 JPY — Night low. Below it, 65,050–64,950 is the thickest zone on the downside and a rebound here would confirm scenario ②. If 64,680 closes below, the 4H will also turn downward to switch to scenario ④.
Entry prices, trigger points, and stops are set based on the chart shape at the close time (reversal prices, minor support, and retrace highs of each timeframe). As time passes and structure changes, unless there is a higher-timeframe structural change, entry prices on lower timeframes (e.g., 15m) should be adjusted toward values that better reflect reality, comparing with the originally set levels.
※ 4H has moved into a range. Because trading back into the middle of 64,680–66,460 is prone to being whipsawed, prioritize confirming rebounds and stalls near the edges of the zone.
※ This report is for information purposes only and does not constitute trading advice; investment decisions are your responsibility.