
Identify the reversal point for USD/JPY
2026 Latest Edition!!
You can watch the interview VTR with Gojozan President Hayakawa and me here
There are also free gifts.
Here is information about new products!!

Please read the product information.
is.
Good morning everyone.
Yesterday's USD/JPY, as it was Monday, moved about 40 pips, giving the impression of the old USD/JPY.It felt like the dollar-yen of the old days.
Not just USD/JPY, but forex is a tug-of-war among currencies; from my perspective, trading that rides the trend and trades at pullbacks/reversals are the easiest to win.
In the former case, you can chase with scalping from the billion-trader era. You can take positions near the initial move.
In the latter case, you can easily take contrarian positions with an unusual hedging setup.
Written like this, it might sound like “technique first,” but before that, I believe the clarity of your trading strategy comes from how you view the chart in front of you!
USD/JPY 1-hour and 1-minute charts
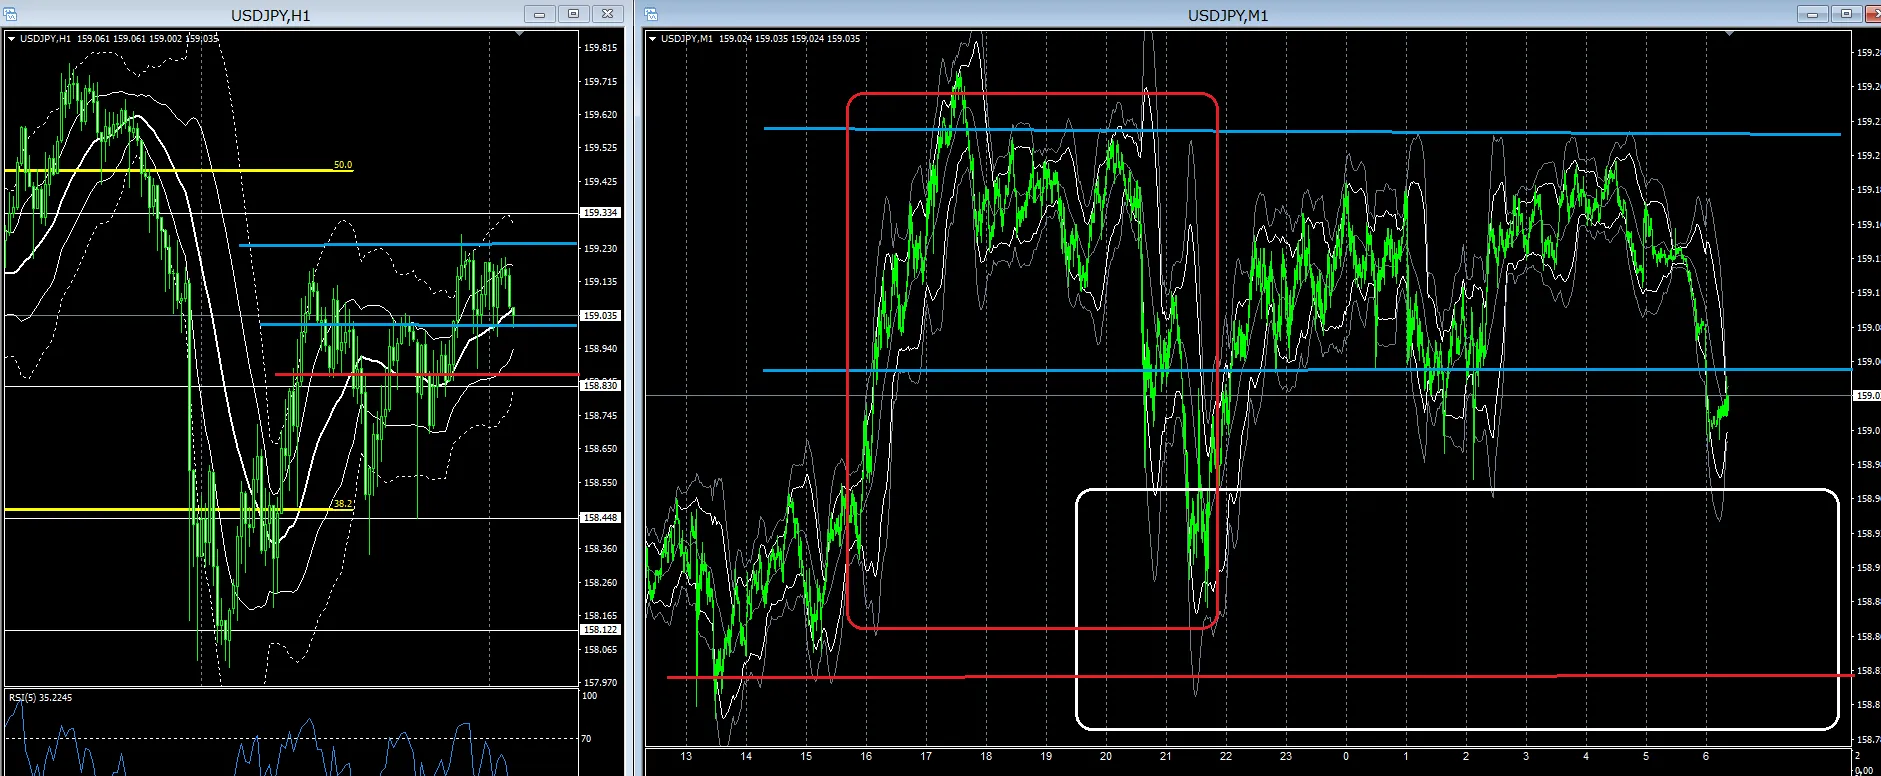 The chart is yesterday's USD/JPY.
Please look at the blue and red horizontal lines on the 1-hour chart.
It is generally evident that there was a rebound at those levels.
Considering the time to reach those rebound points, you decide whether to trade up to that reach, or trade anticipating the rebound after reaching it, thereby changing your stance.
People who can see the chart flexibly and multi-dimensionally, as I often say, can try both approaches.
Those who cannot should focus on one side to improve trading success rates.
A trillion-dollar trader can handle both.
Unusual hedging is a position that relies on a rebound.
Whatever the method, if you pre-embed these two patterns in your mind, there will be no “go with the flow as it happens” trading.
I think it’s important to wait properly and take the position you envision.
The red □ zone on the right 1-minute chart is a scenario to attack with the trillion-dollar trading method.
Since the price range is about 30 pips, if you grab the initial move, aim for about 15 pips of profit.
Today, will it enter the white □ zone of the red horizontal line...
If it enters, will it rise toward around the blue horizontal line near 1,590,00, or will 1,590,000 become a take-profit point? That is my current view.
In plain terms, will it target yesterday's high and low?
Regardless, it will be a flow about how overseas markets attack yesterday's high and low, but how about making today a day to anticipate rebound?
Whether it hits or not is unclear, but by doing so you will train your eyes.
Knowing this changes your waiting stance considerably.
If 90% of trading is waiting, can we say that waiting for the reversal is part of the job?
Thank you for today as well.
For traders who simply want to succeed in trading or make a living from trading, I recommend my product, which can be learned through self-study, and this is the trading technique: