
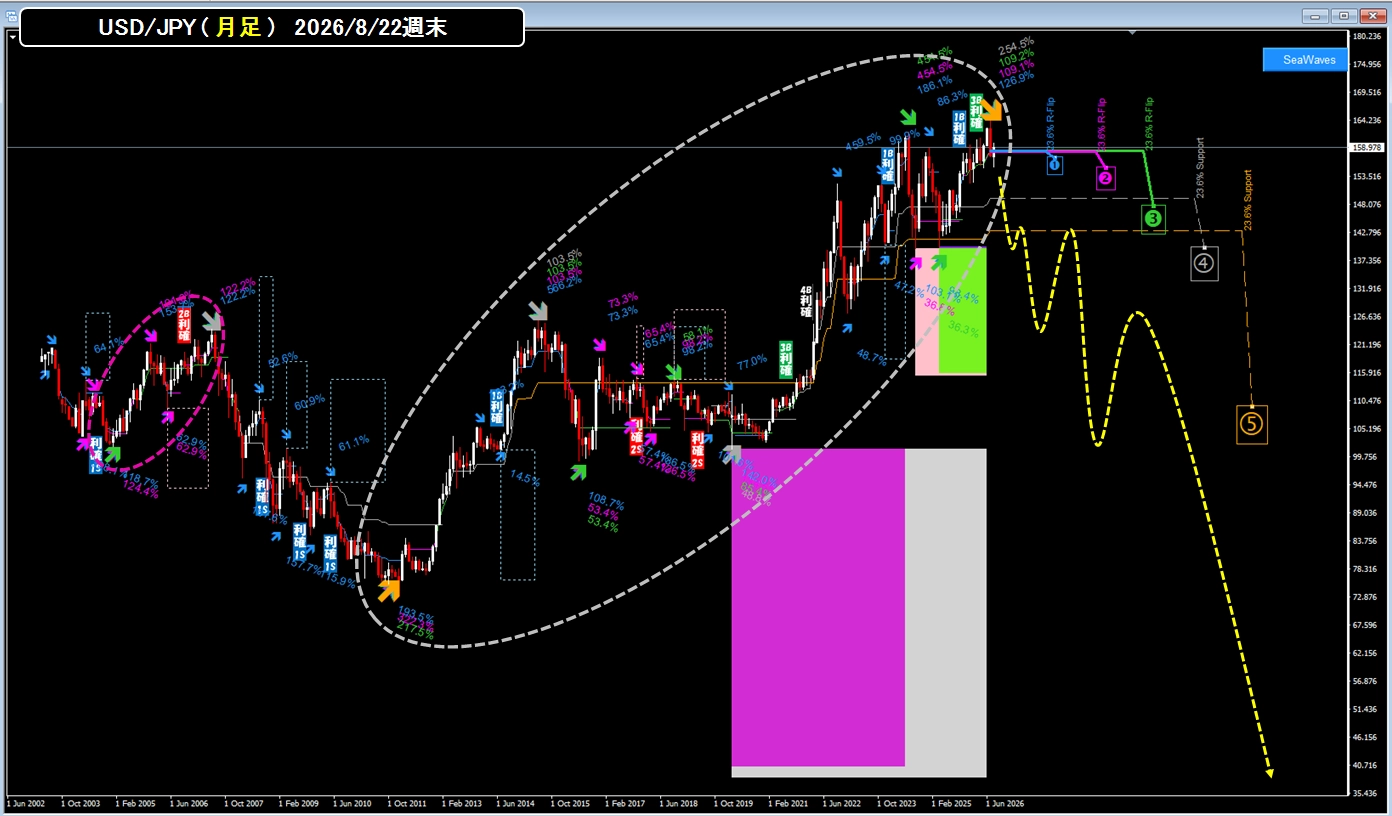
Analyzing USD/JPY (monthly) with a 23.6% retracement → This month-end (end of August) and next month are important
We analyzed the USD/JPY (monthly) using the 23.6% retracements of the large, medium, and small waves.
The large, medium, and small waves are five levels: blue ① / red ② / green ③ / gray ④ / yellow ⑤.
The chart below is the USD/JPY (monthly) chart as of the weekend of 8/22, and intuitively, could you feel that the pink circle on the left and the gray circle on the right look similar?
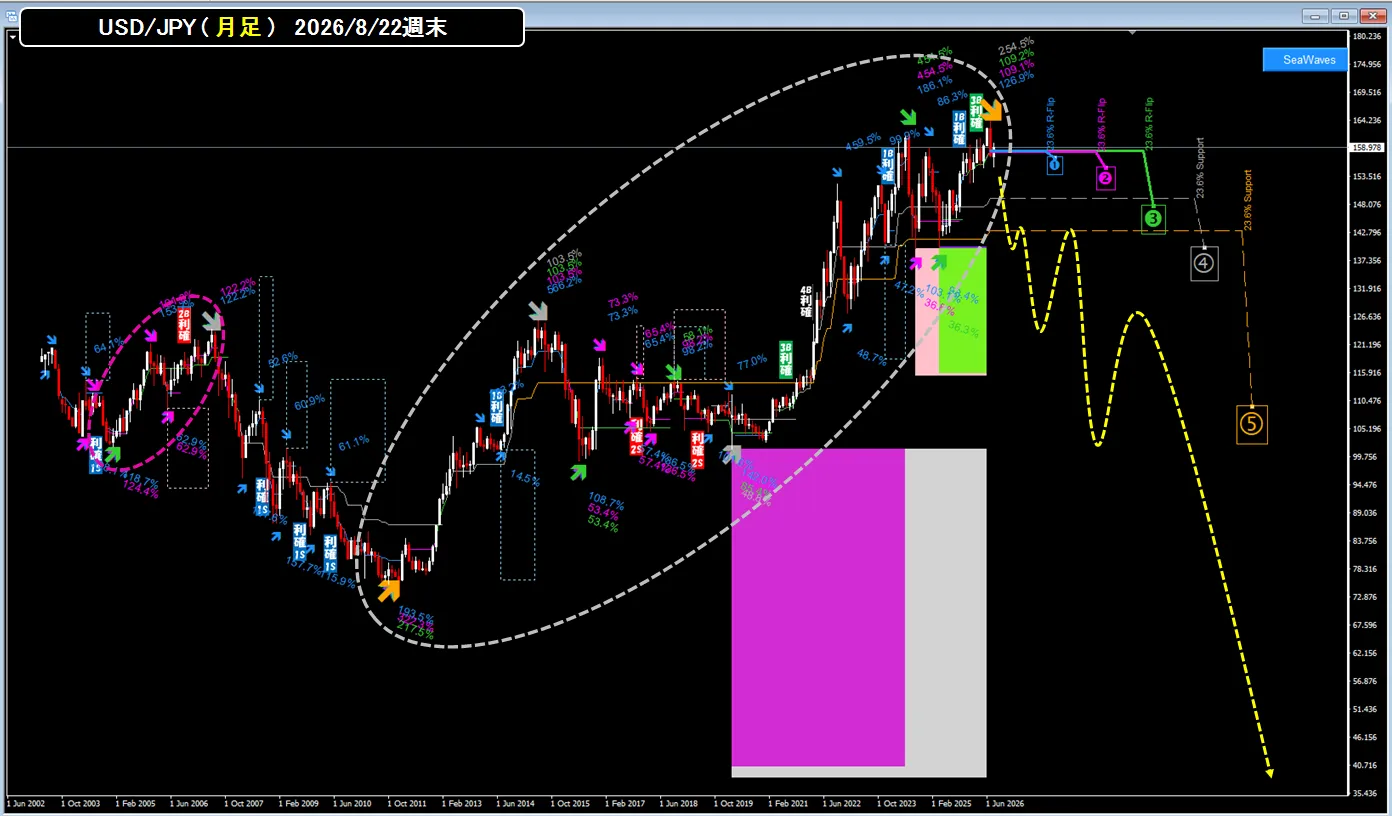
If you display the gray circle area enlarged and then display the pink circle area on the left enlarged on a weekly basis, you will find that they are really almost identical.
(By showing the pink circle on a weekly basis instead of a monthly basis, you can compare the same wave size more clearly!)
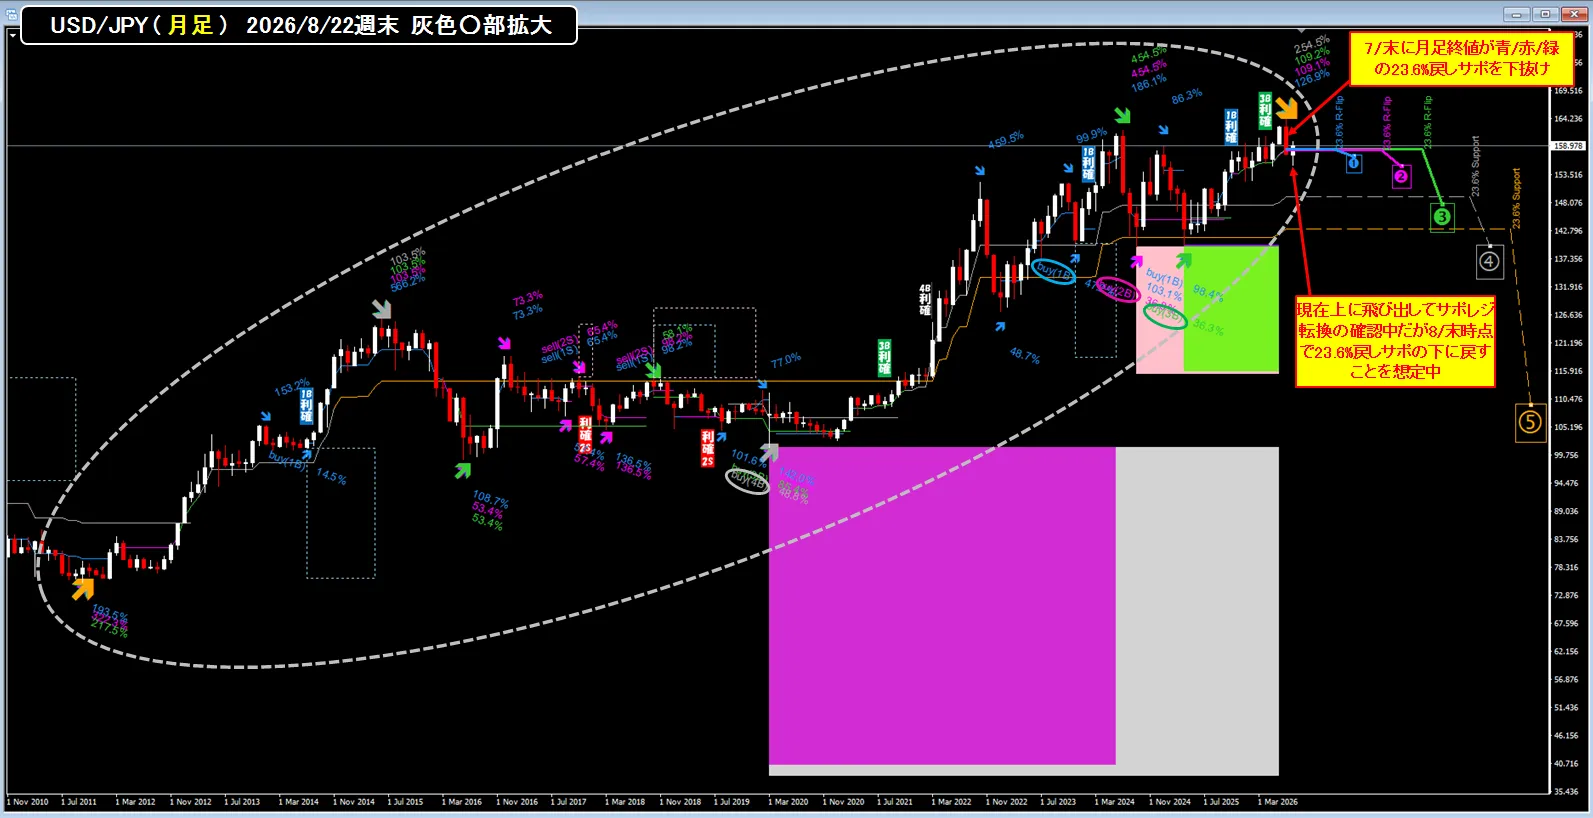
<Current USD/JPY (monthly) chart (enlarged gray circle)>
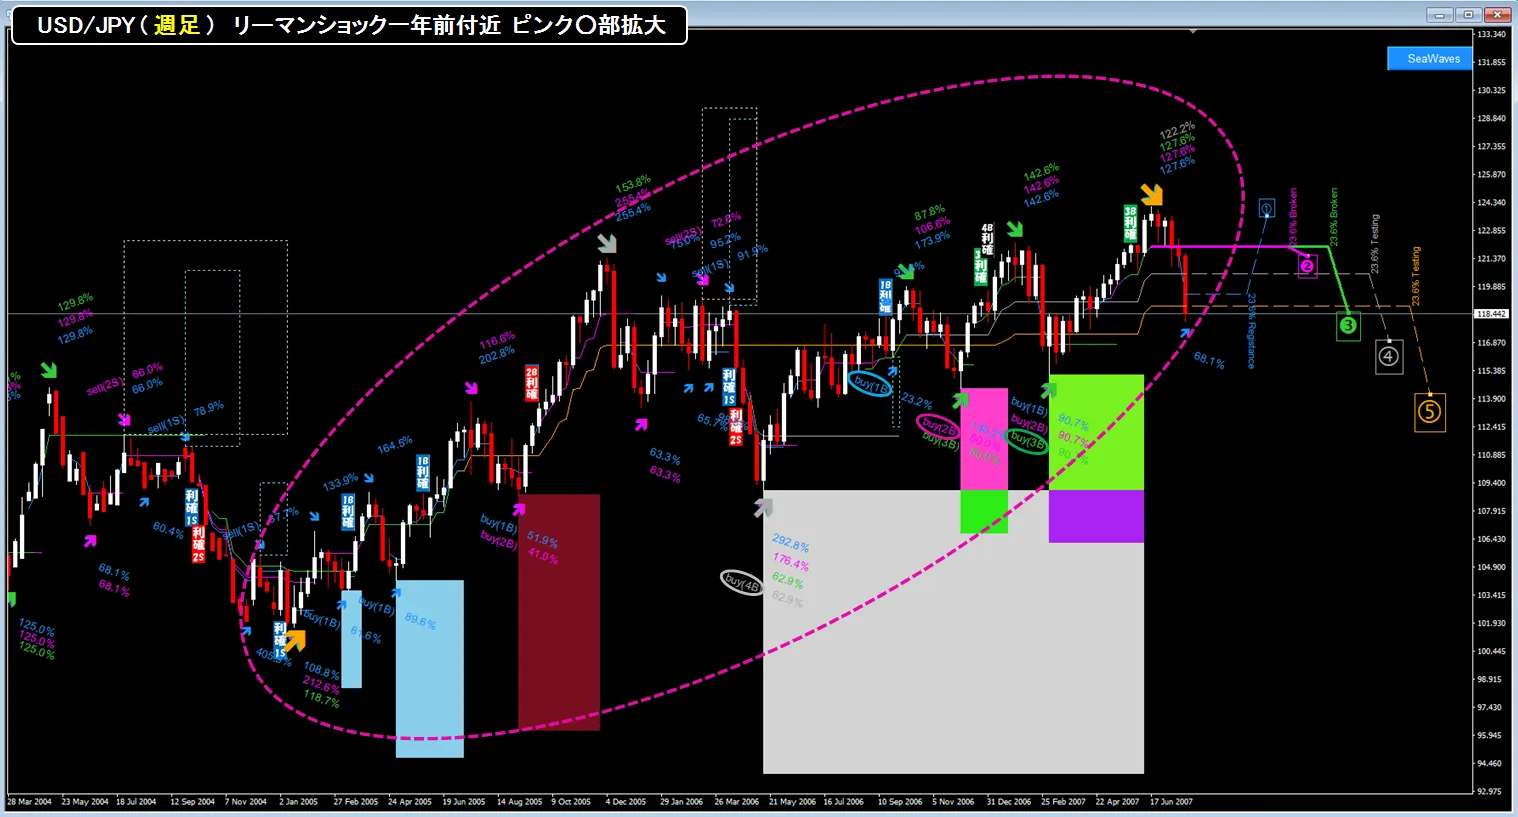
<Weekly one year before the Lehman Shock (pink circle area displayed on a weekly basis)>
<Similar parts>
● The shape formed by the rise from the yellow ⑤ low to the high as a W (N) on the gray ④
● The three-wave portion of gray ④ is formed as a W (N) on green ③, and in detail it shows the rising trend of blue ① / red ② / green ③ in order
● There is a buy position in gray ④ (4B) and pink buy (2B) and green buy (3B) in the market, and profit-taking is required, which can be confirmed by the filled Box. (The dashed Box already represents realized profit, with margin returned to the account, and after buying on blue buy (1B) and taking profit back to a support level, using the returned margin to enter red buy (2B) is imagined in exactly the same way.)
<Weekly movement one year before Lehman Shock>
● After the weekly close broke below the 23.6% retracement support of red ② / green ③, the next monthly candle showed a top wick bearish signal staying in the lower zone, and the following monthly candle was a large bearish candle breaking below the yellow ⑤ 23.6% retracement support.
<Current USD/JPY (monthly)>
● At the end of July, the monthly close fell below the 23.6% retracement support of red ② / green ③ and, after confirmation, as of the weekend of 8/22, appears to have temporarily entered the upper zone, and is watching to see whether it will properly press the head at the 23.6% retracement to confirm a support/resistance reversal. (If a support/resistance reversal occurs, the August end monthly close would need to close below further!!!)
● It is extremely important that the August-end monthly close closes below the red/green 23.6% retracement support (158.1–2). If the Lehman Shock moves echoed the same as the weekly one year before, there is also a possibility of further decline to form a bearish candle by the end of the month.
(Originally, I anticipated that the red/green 23.6% retracement would print a bullish candle at the end of August, followed by a decline in September, but it is also possible that it declines and becomes a bearish candle by the end of August. If that happens, there is a cautious possibility of aiming for a decline from the monthly upper wick within this month. But there is also a possibility of breaking higher, so waiting for the August-end monthly close before acting may be safer.)
● And in the Lehman Shock scenario one year before, the next candle was a large bearish candle that broke below the yellow ⑤ 23.6% retracement, so attention is also needed for the possibility of a large bearish monthly candle in September.
(However, the yellow ⑤ 23.6% retracement support overlaps with the down move from 1 USD = 360 JPY to the low of 76.265, creating repeated support/resistance transitions, suggesting careful attention to whether it can break below. This is a September topic, and since the August-end 23.6% retracement support has not yet decisively held, it could be speculative but may still play out, though...)
<Lehman Shock decline chart>
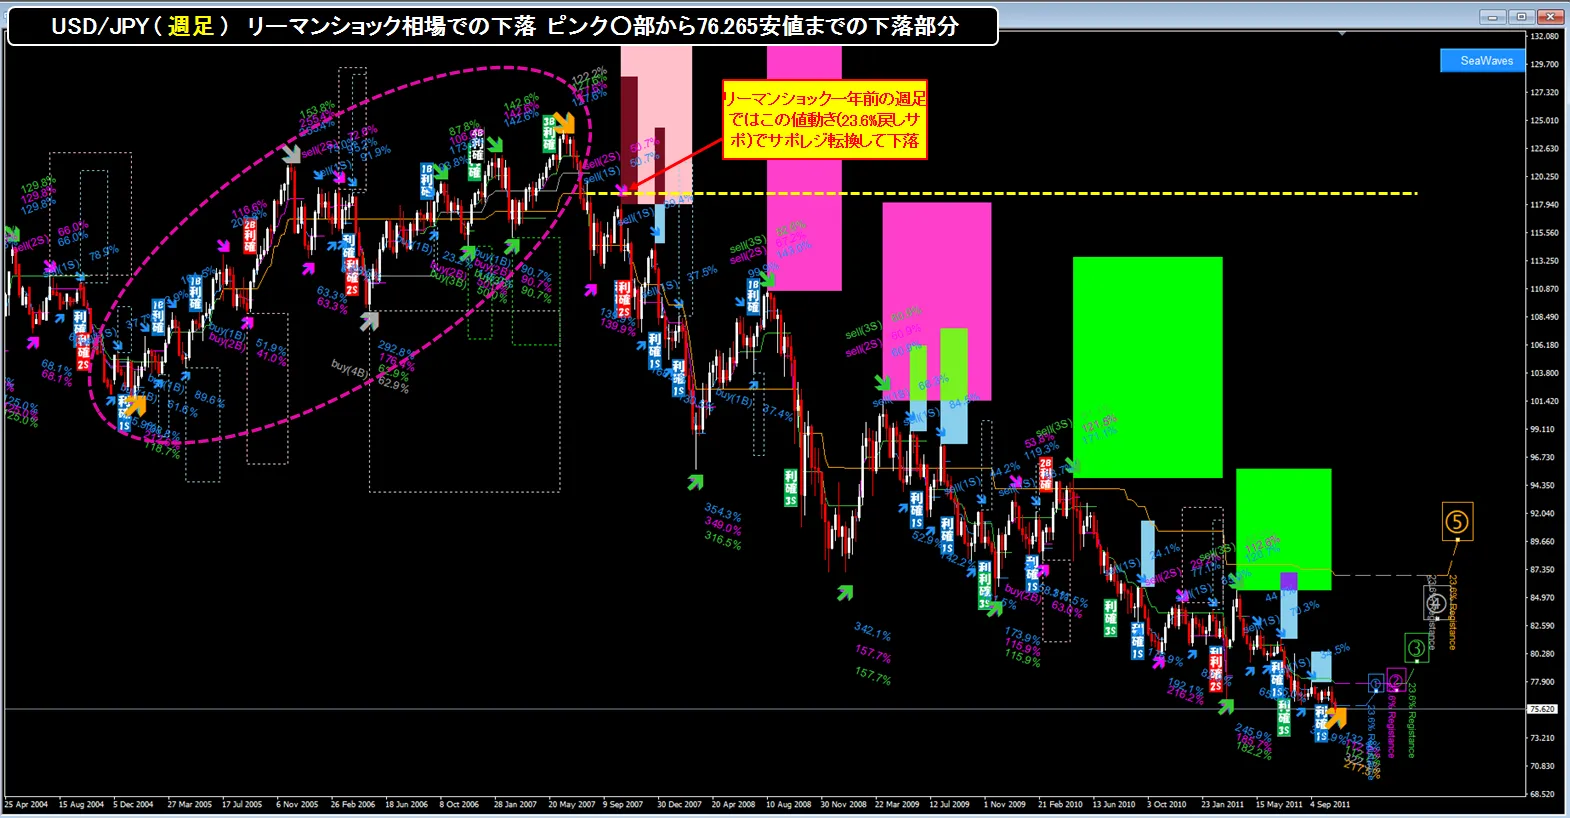
After the yellow ⑤ 23.6% retracement support closed below, the price formed a support/resistance reversal on the candle level and fell, then pressed again against the yellow ⑤ 23.6% retracement support, and dropped to the low of 76.265.
<Continuing to fall with each wave increasing from USD 1 = 360 JPY>
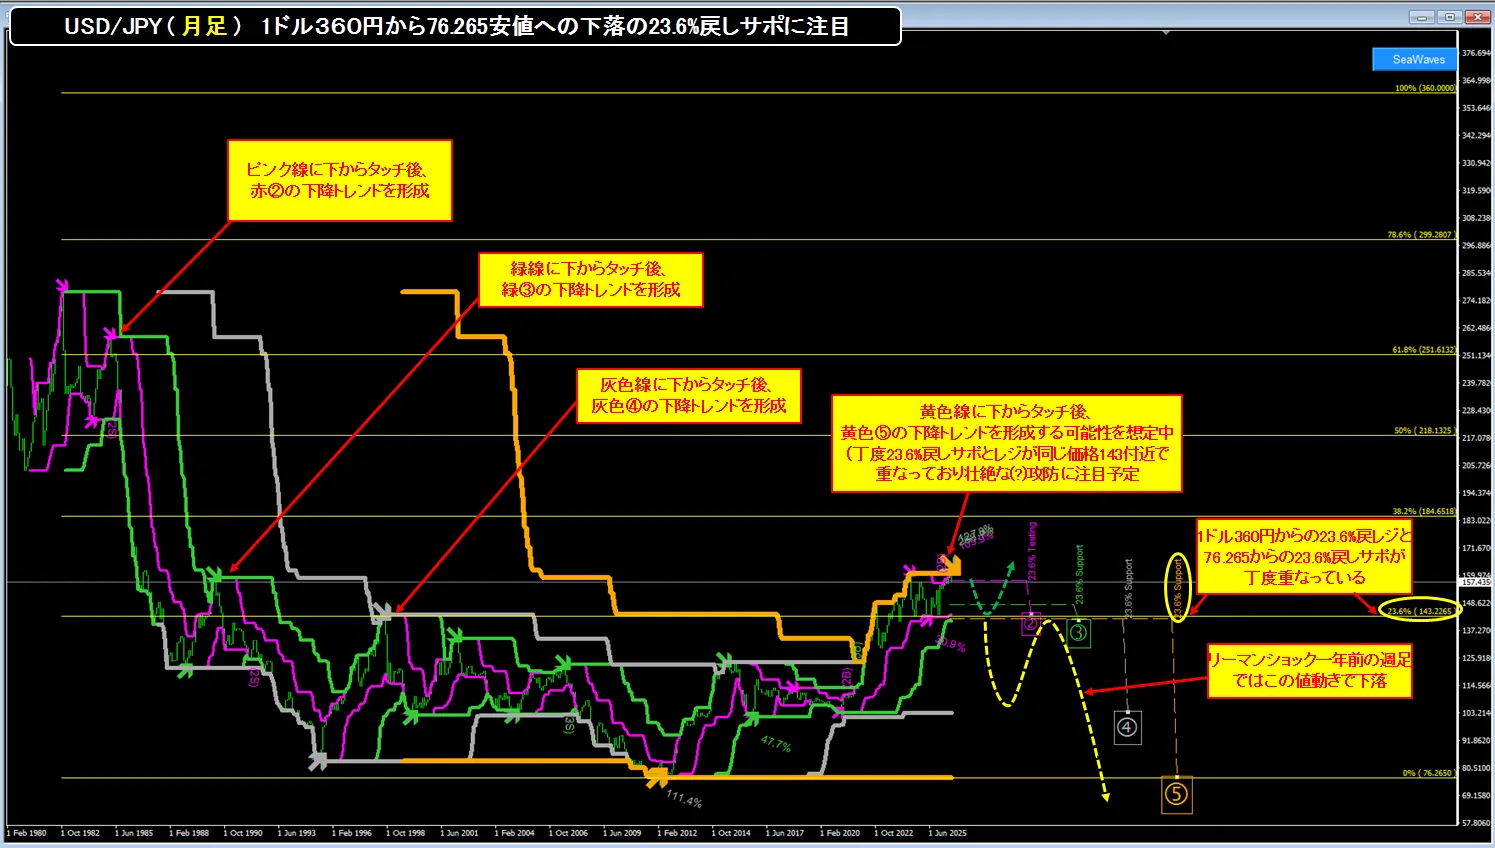
As shown in the chart above, the USD/JPY price moved from 1 USD = 360 JPY (chart starts from 277 JPY) to the upper/lower band, tapping from the bottom, creating a downtrend step by step with waves blue ② / green ③ / gray ④ growing larger, and currently after touching the upper band of yellow ⑤, is in a struggle to form a downward trend by creating a fall back below the 23.6% retracement support/resistance line. If the Lehman Shock were to follow the same pattern one year before, then once yellow ⑤ 23.6% retracement breaks below, it would be expected to reverse to a new low after support/resistance reversal. Although gray ④ retracement high has broken above, in the wave-by-wave growing-up pattern, breaking above is not a problem and can form new waves; however, since the retracement high has broken above, there may be a certain number of people who think the trend has reversed.
<Finally>
● If the monthly close at the end of this month (August end) closes above the 23.6% retracement support (158.1–2), even though the monthly close previously broke below the 23.6% retracement support and could have fallen to the minor low, it would become invalid and we would have to start over, so I hope the August-end monthly close will decisively close in the lower zone.
● If possible, I would like August’s monthly to close with a long upper shadow (bearish) like the Lehman Shock one year before, and for September’s candle to drop below the yellow ⑤ 23.6% retracement (143) after that. ^^