

2026/8/22 Dollar/Yen, Gold, SP500, and Nikkei 225 environment

For verification purposes, we provide a weekly video of USD/JPY price movements.
USD/JPY
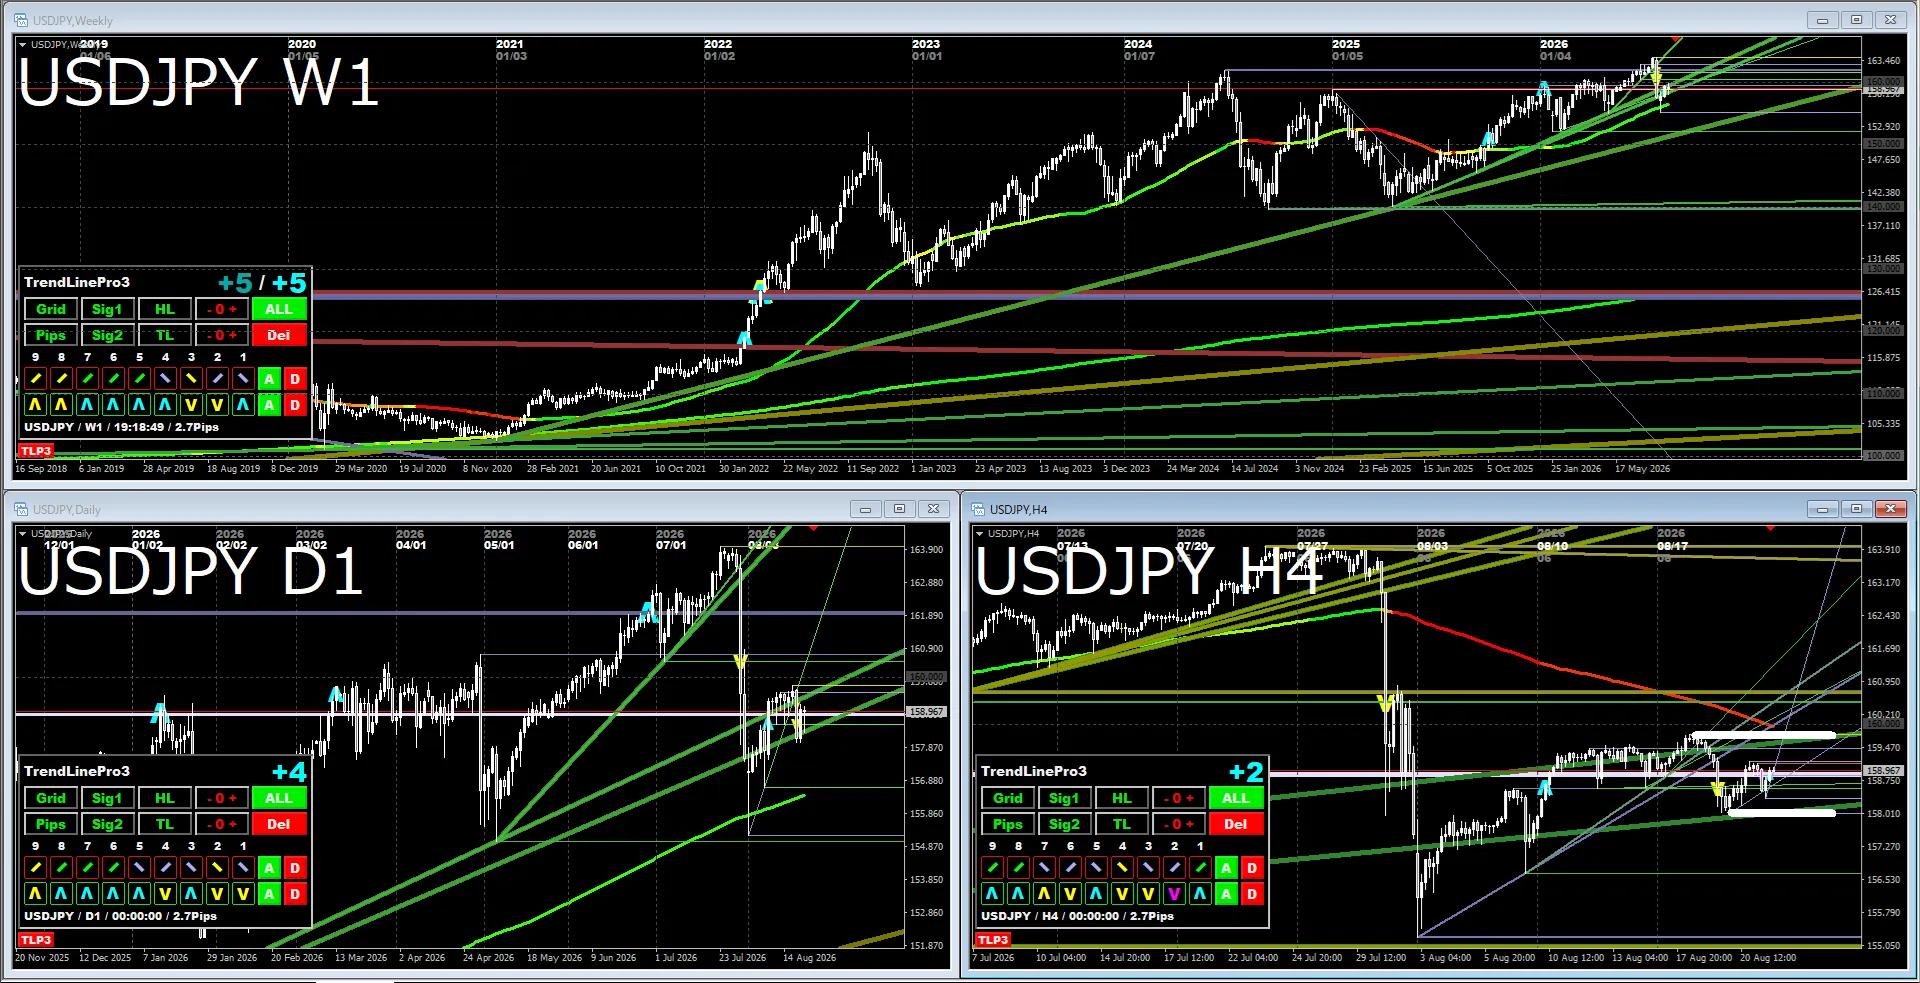
WeeklyThe trend remains upward with clear new highs. Since the price has broken below the trendline, a medium-term sideways development is expected.
Daily & 4-hourIt retraced to about half, but it did not form a head and shoulders downward movement; buying remains dominant. It has re-turned onto the trendline, and at present, the pattern suggests continuing to test higher levels.
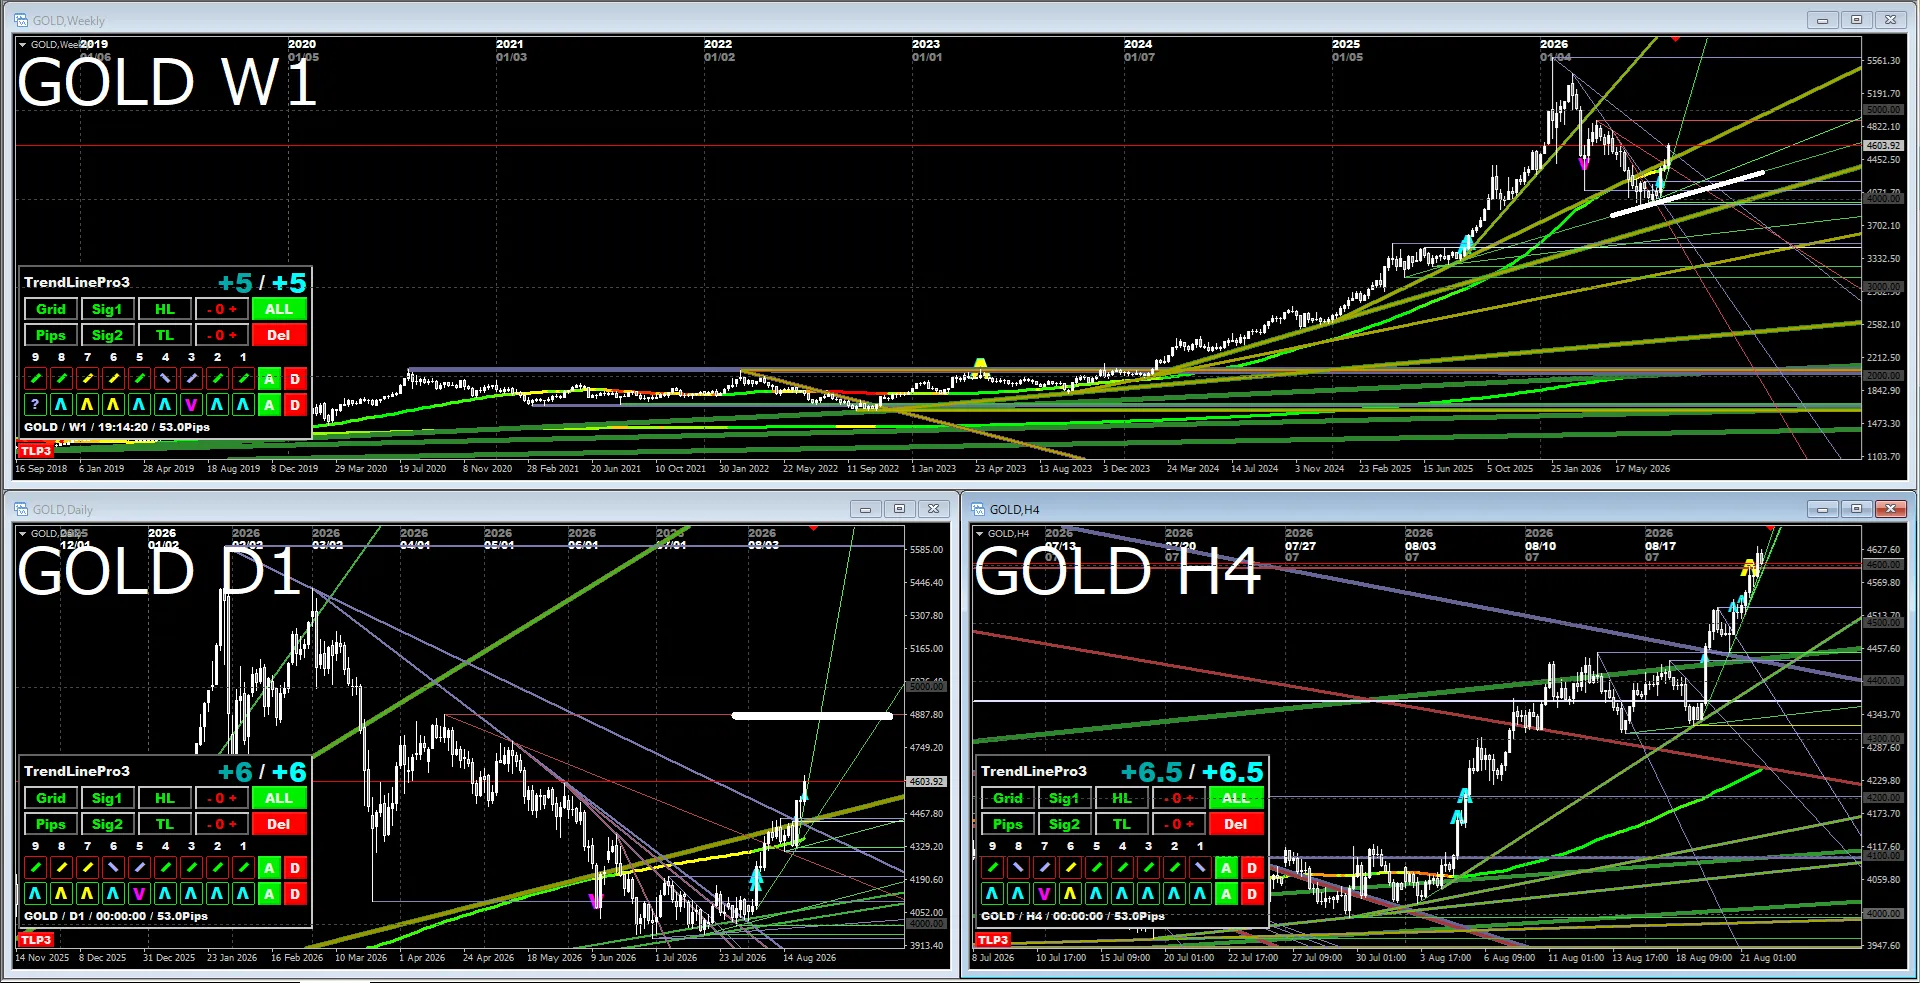
Daily & 4-hourThe score shows a bullish tilt, and there is a sense of testing the white line drawn on the daily chart.
S&P 500
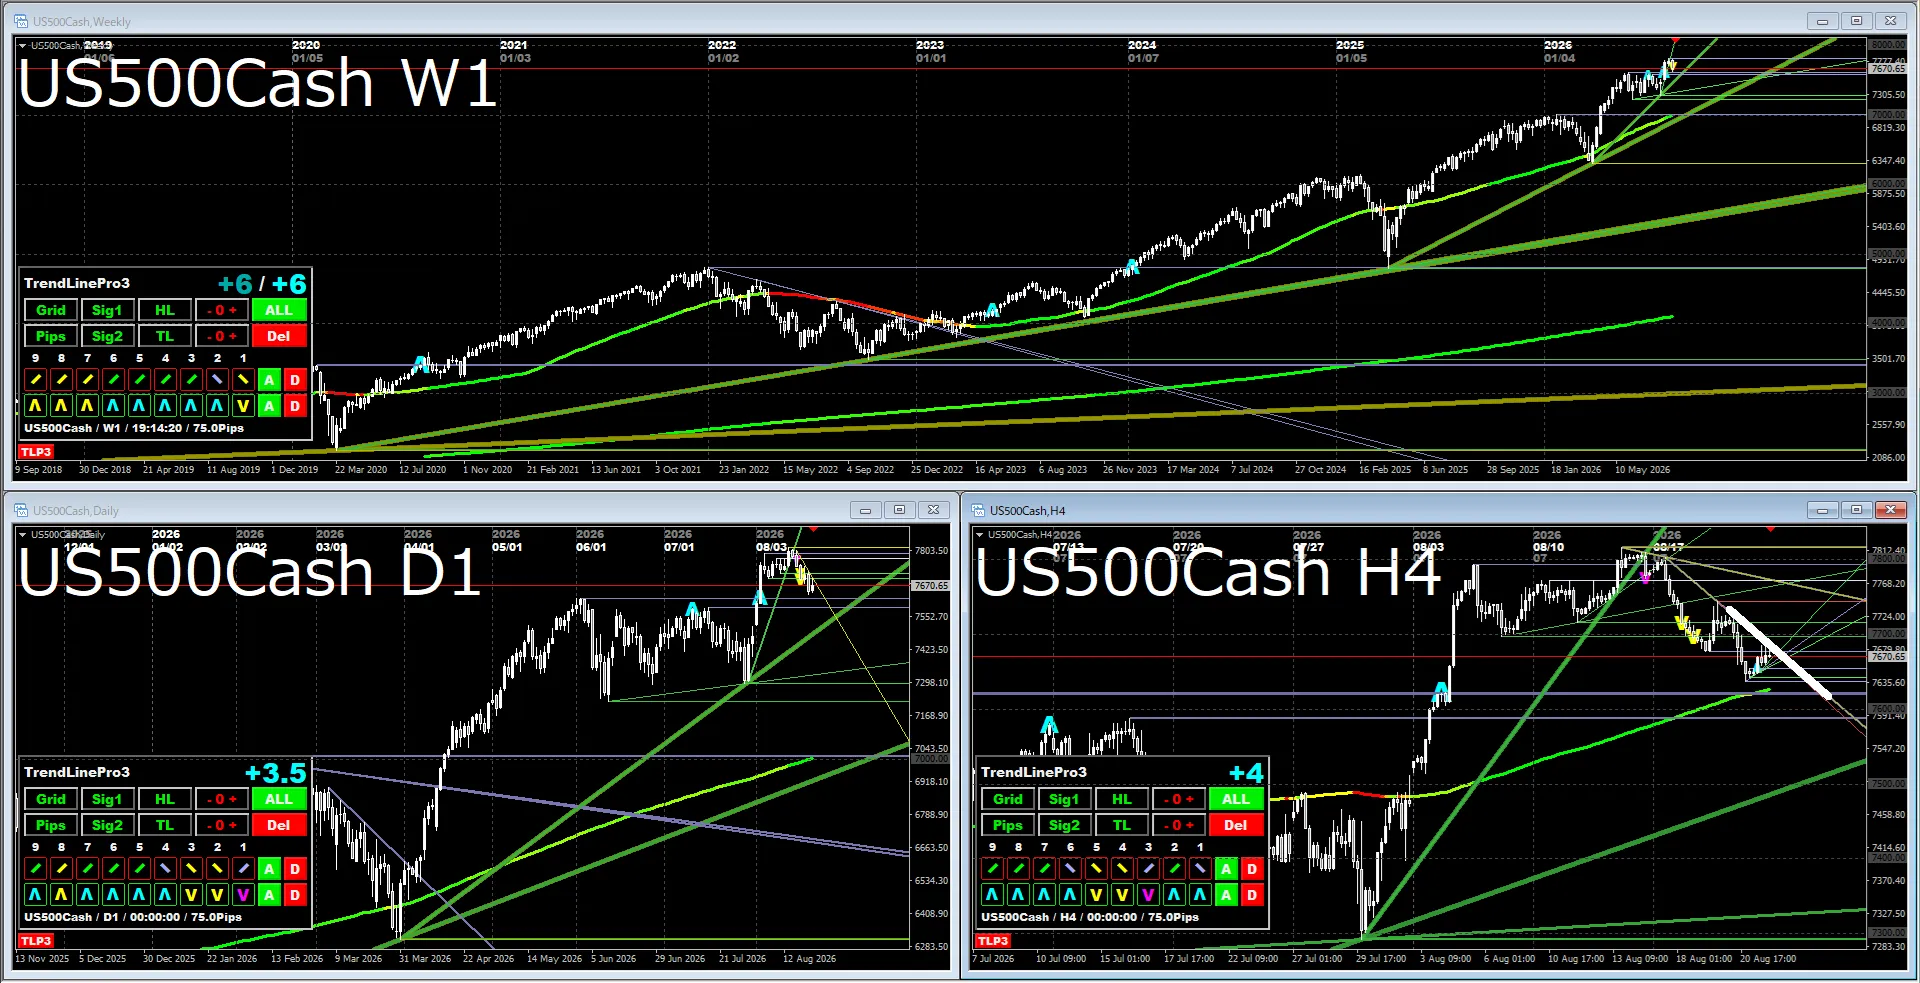
Daily & 4-hourIt is gradually dipping, but this appears to be a mere correction. A breakout above the 4-hour trendline could invite more buying.
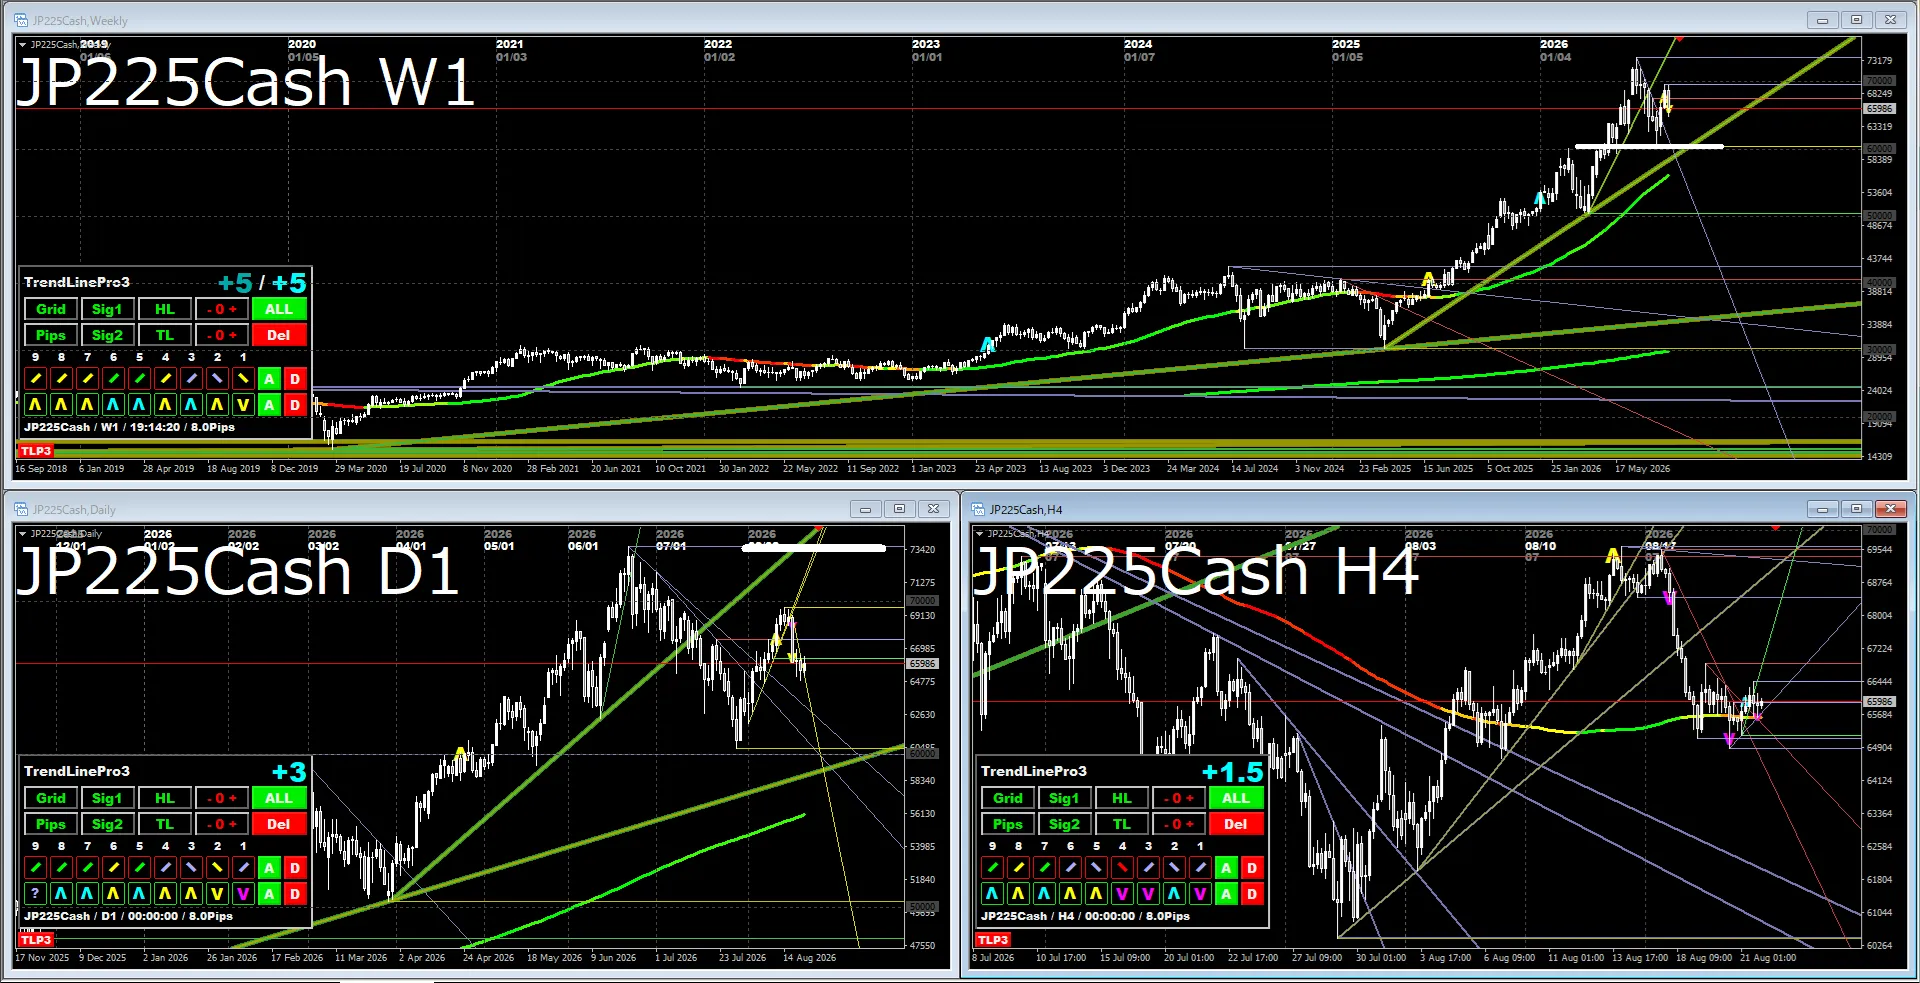
Daily & 4-hourWhen it suddenly rose too much, a correction followed. It seems likely to target the daily white line (high), but for now we will wait to see if a reversal is confirmed on the 4-hour chart.
The attached image’s indicator uses the following indicators.
If you’re interested, please take a look.