

[Very Important!] What is the definition of "trend" and how is it judged? Technical Analysis Basic Course #6
Hello! I am SAKU!
Today, we will delve into something essential to trading that you cannot cut off—the trend.
Previous article on Dow Theoryalso mentioned this term from time to time, butthe definition of trend and determining trendare very important in technical analysis, so please fully acquire this content!
What is a Trend
Trend (Trend)... literally, it means tendency, direction, or current.
In price movement as well, this trend concept appears.
In short, during an uptrend more people are buying, and during a downtrend more people are selling.
Trends in Dow Theory
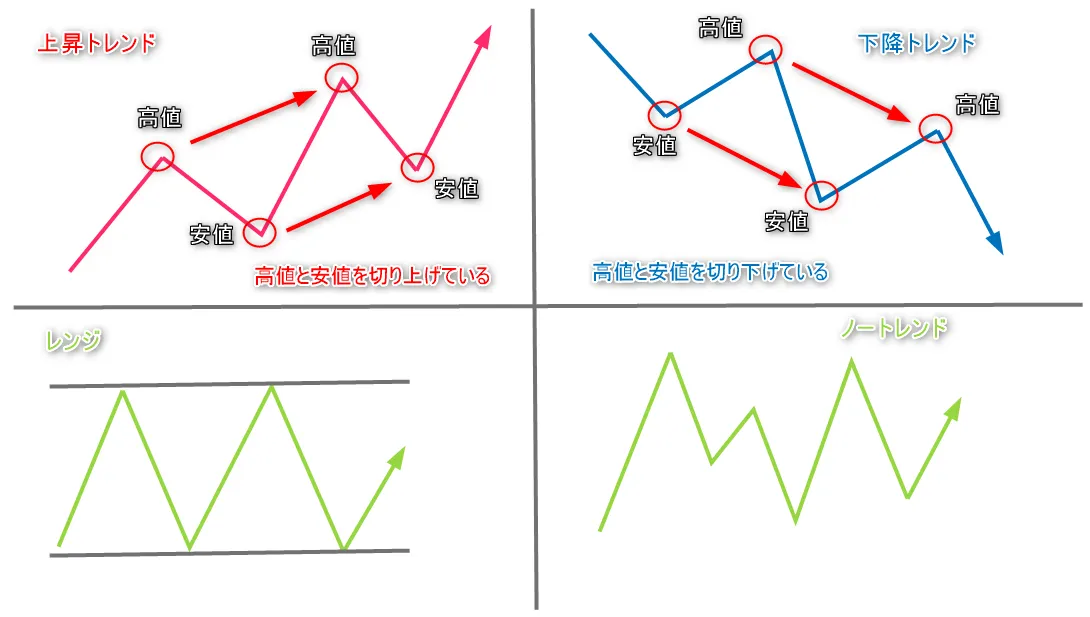
・Uptrend and downtrend・・・According to Dow Theory,confirmation of higher highs and higher lowsindicatesan uptrendand,confirmation of lower highs and lower lowsindicatesa downtrend.
In other words, if you cannot confirm higher highs and higher lows, there is no trend—range market, no-trend.
・Range market・・・price movements oscillate within a certain range.
Also called a consolidation or box market. (The range in the diagram below is precisely a rectangle formation)
・No-trend market・・・no clear trend, price movements are irregular. It is often treated as the same as a range market.
Generally, it is said that trends account for about 30%, while range and no-trend markets account for about 70% of total.
※More strictly, in Dow Theory there is no such thing as “range market” or “no-trend”; it is assumed that some form of trend is always occurring. In other words, typical range or no-trend conditions are periods of choppiness within a trend. However, for convenience here, we use terms like range market or no-trend to distinguish ongoing upward or downward movement.
Trend Continuation, End, and Reversal
・Push low, pullback high concept
Higher highs and higher lows are formed, but you might wonder what to use as the 기준 (basis).
Therefore, as one basis for price movement, the ideas ofpush low,pullback high exist.
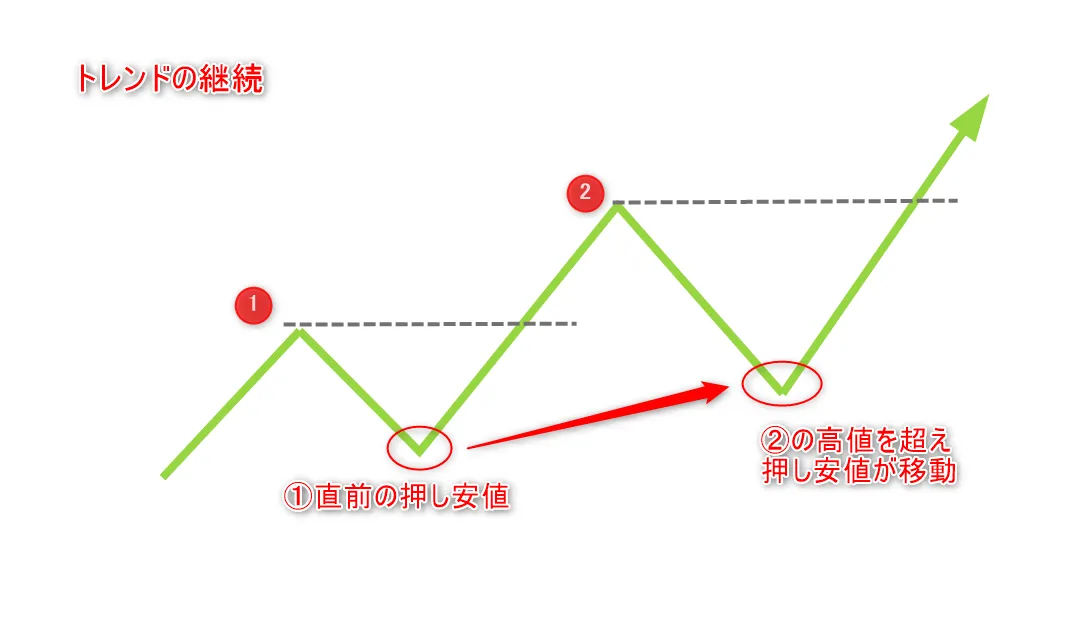
If expressed in words, the low formed at the waveform origin after the most recent new high is calledpush low, and the high formed at the waveform origin after the most recent new low is calledpullback high.
・Trend Continuation
As long as thepush low is being updated, it is an uptrend,,the pullback high continues to be updated, indicating a downtrend as well.
The push low moves as the most recent high is updated, so you can treat the movement of the push low as the continuation of the trend (the pullback high does the opposite).
・Trend End
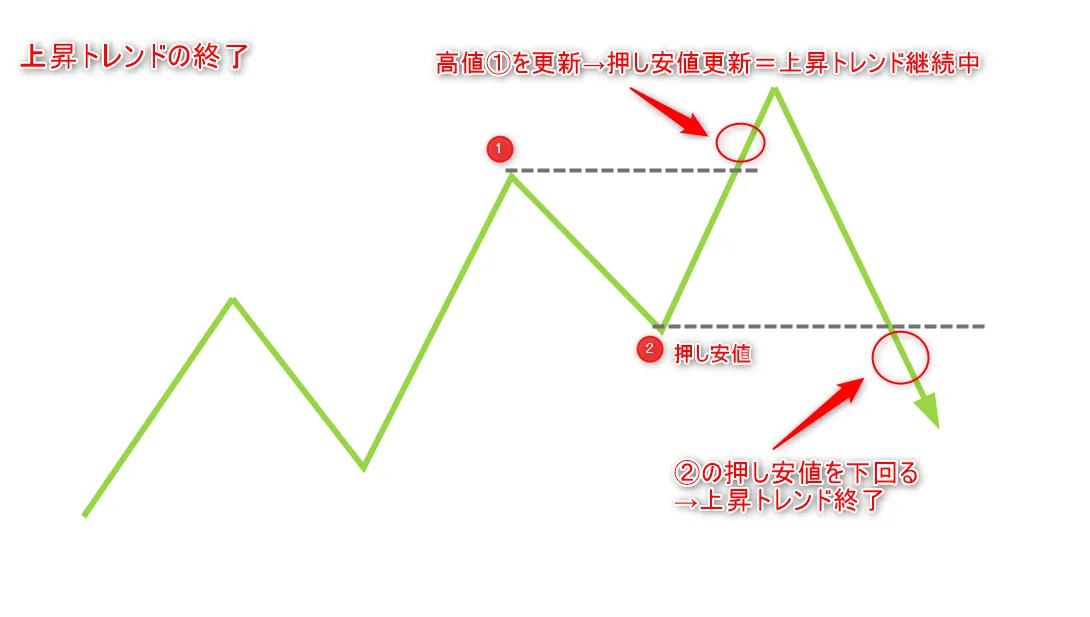
(For an uptrend)When the push low is broken below, it is deemed that the prioruptrend has ended.
“End of trend”
・Confusing patterns
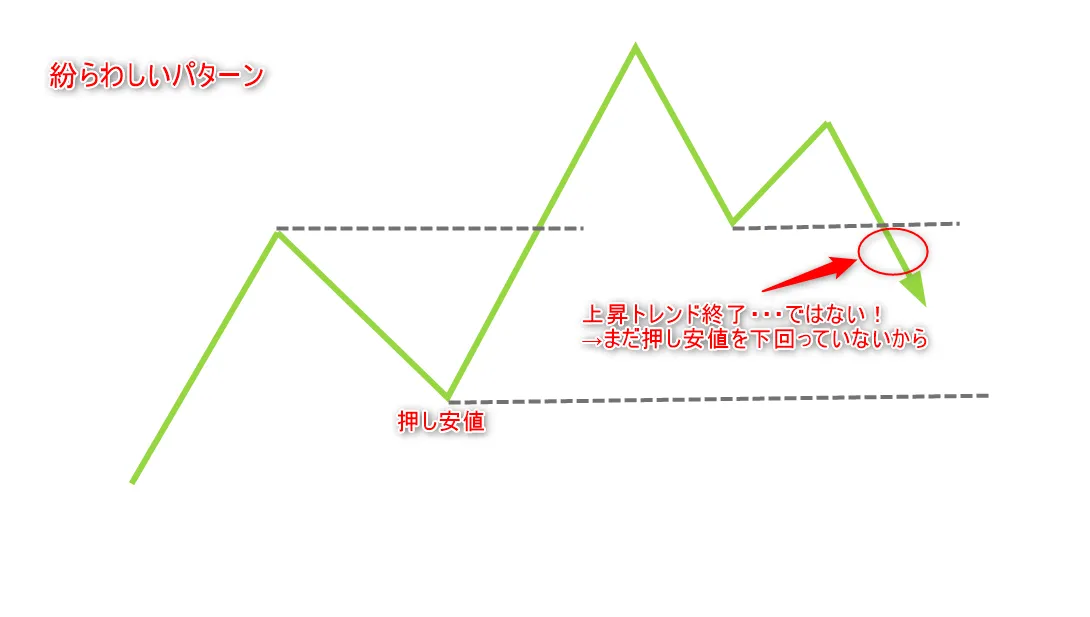
The red-circled parts in the figure are not a downtrend, but a corrective decline. Overall, the trend is upward.
・Trend Reversal
When the uptrend is occurring, I explained that if the push low is broken below, the uptrend up to that point is considered finished, but in this case, it does not mean the trend has reversed.
In other words, the uptrend has ended, but it is not yet a downtrend.
So how does a trend reverse?
What you should recall here is thatyou determine an uptrend by confirming higher highs and higher lows, and a downtrend by confirming lower highs and lower lows.
For the uptrend to end and a downtrend to begin,
①break below push low → ②the lows and highs begin to lower.
Please look at the diagram below.
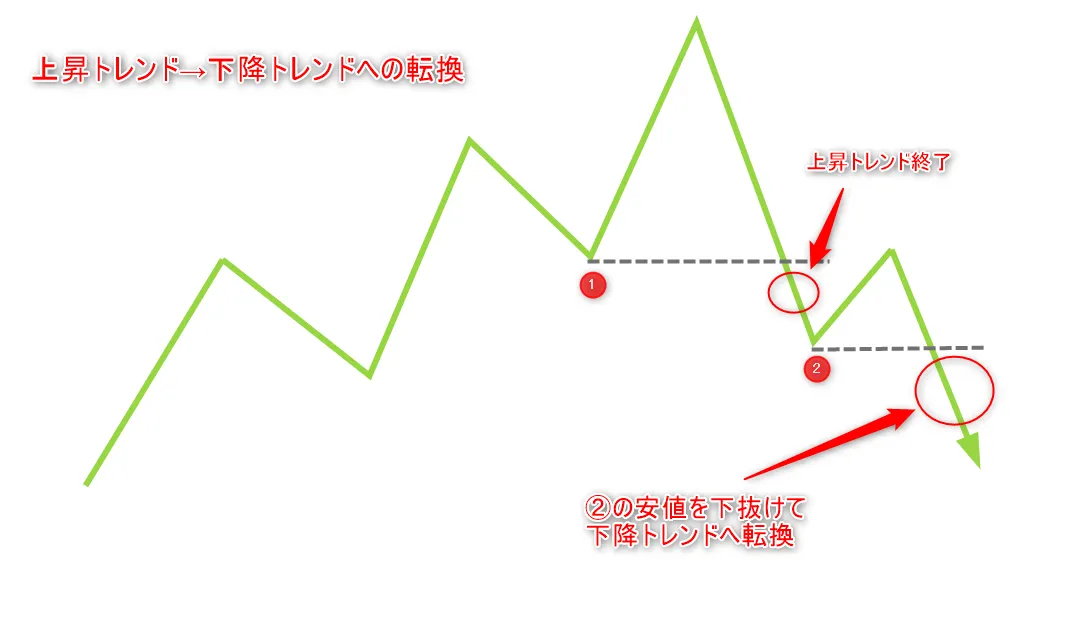
Therefore,just because you broke below the push low does not immediately mean a downtrend has begun!
If you short thinking the downtrend will start, it might still not be in a downtrend yet, and the price may rebound or oscillate for a temporary rise.
Of course, if you are aware of this and are shorting with the expectation of a downtrend, you should set stop losses and adjust position size so you can exit quickly if it goes against you.
So far in Dow Theory we have looked attrend continuation, end, and reversal—how was it?
For beginners, it might be hard to grasp in one sitting, so reread multiple times and practice on your own charts.
This part is extremely important in any analysis method, so make sure you thoroughly understand it and you will be able to judge quickly when you see the chart.
Summary
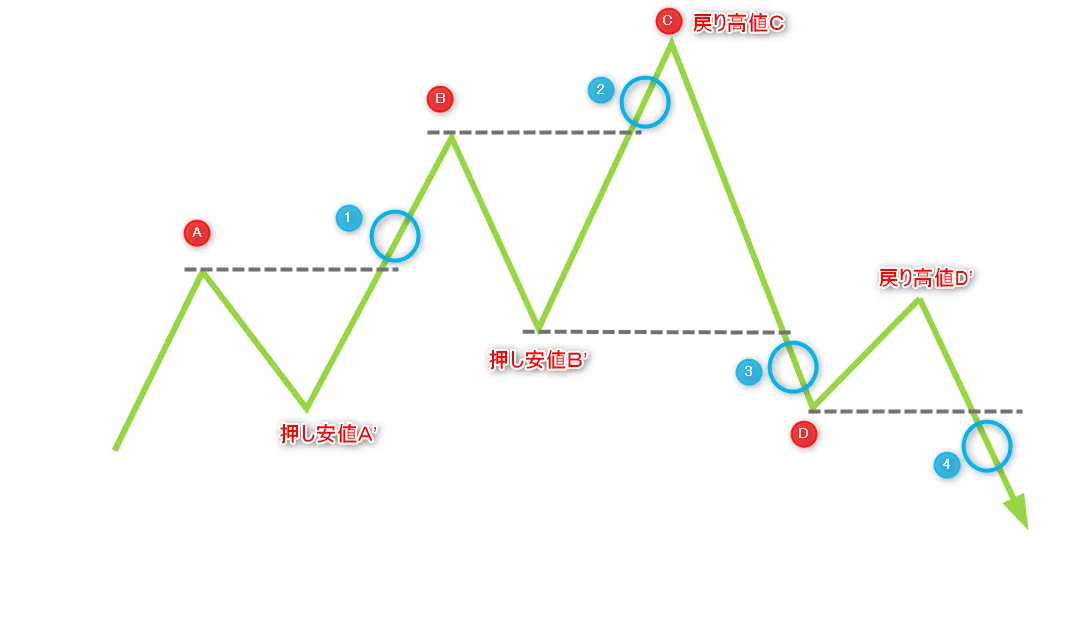
Finally, I have summarized the flow in a diagram for your reference.
・Description in chronological order
①Break above high A → confirm push low A’
②Break above high B → push low moves to B’ (trend continuation)
③Break below push low B → confirm pullback high C (uptrend end)
④Break below low D → pullback high moves to D’ (downtrend start = trend reversal)
Details of the author's trading method can be found here ↓
MTF Multi-Time Frame Analysis Essentials(Discount campaign through August 31, 2026, 23:59!)
Next article here ↓