

[Very Important!] What is the definition of "trend" and how is it judged? Technical Analysis Basic Course #6
Hello! This is SAKU!
This time, I will delve into and discuss something indispensable in trading: thetrend.
previous article on Dow TheoryThe words did come up here and there, butthe definition of the trend and how to determine itare extremely important in technical analysis, so please make sure to master this content!
What is a trend
Trend (Trend) … literally meaning tendency, direction, or prevailing current.
In price movements, this thing called a trend also occurs.
In rough terms, during an uptrend more people are buying, and during a downtrend more people are selling.
Trend in Dow Theory
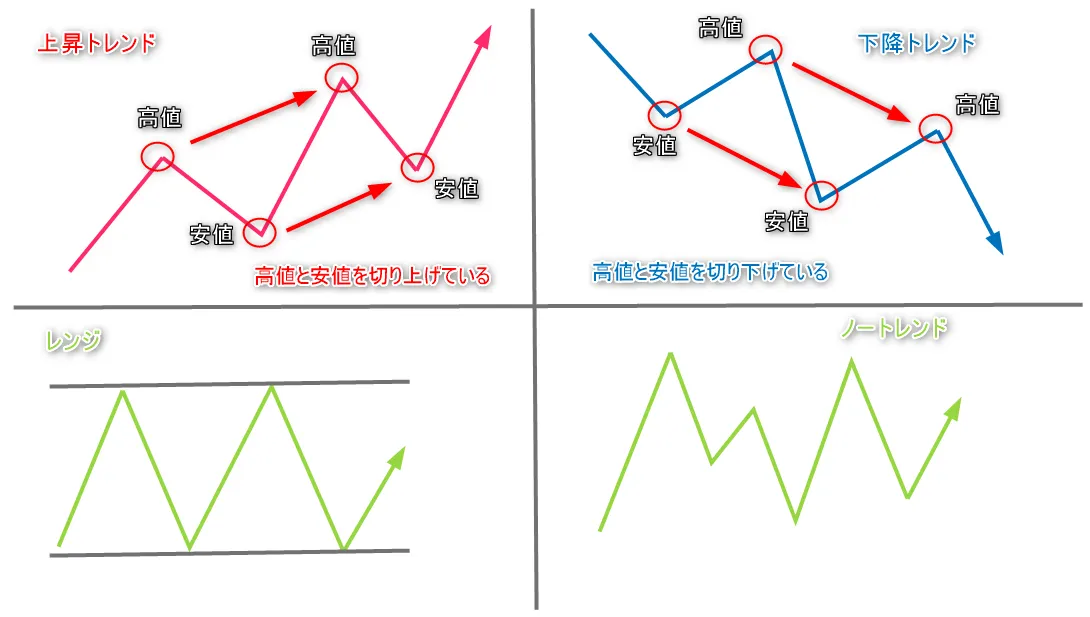
・Uptrend and Downtrend …According to Dow Theory,higher highs and higher lowsconfirm thatan uptrendis occurring, andlower highs and lower lowsconfirm thata downtrendis occurring.
In other words, if you cannot confirm higher highs or lower lows, the trend has not formed → range market or no trend.
・range market…a market condition where price moves up and down within a fixed range.
It is also called a consolidating market or a box market (the range market in the diagram is not exactly a rectangle-shaped formation).
・no-trend market…a market where no trend is present and price movement is irregular. It is often treated as the same as a range market.
Generally, it is said that 30% are trend markets, and 70% are range or no-trend markets.
※ Strictly speaking in Dow Theory, “range market” and “no-trend” do not exist; it is believed that some form of trend is always present. In other words, typical range markets or no-trend states are essentially chop within a trend. For convenience here, we use the terms range market or no-trend state to describe continuing up or down conditions.
Trend continuation, termination, and reversal
・pullback lows and pullback highs
With higher highs and higher lows, and with lower highs and lower lows, you may wonder what you should use as a reference.
Therefore, as one reference for price movement, there is the concept of pullback low and pullback high.
Put plainly, the latest high that has been updated and the starting point of the wave’s low is called the pullback low, and the latest low that has been updated and the starting point of the wave’s high is called the pullback high.
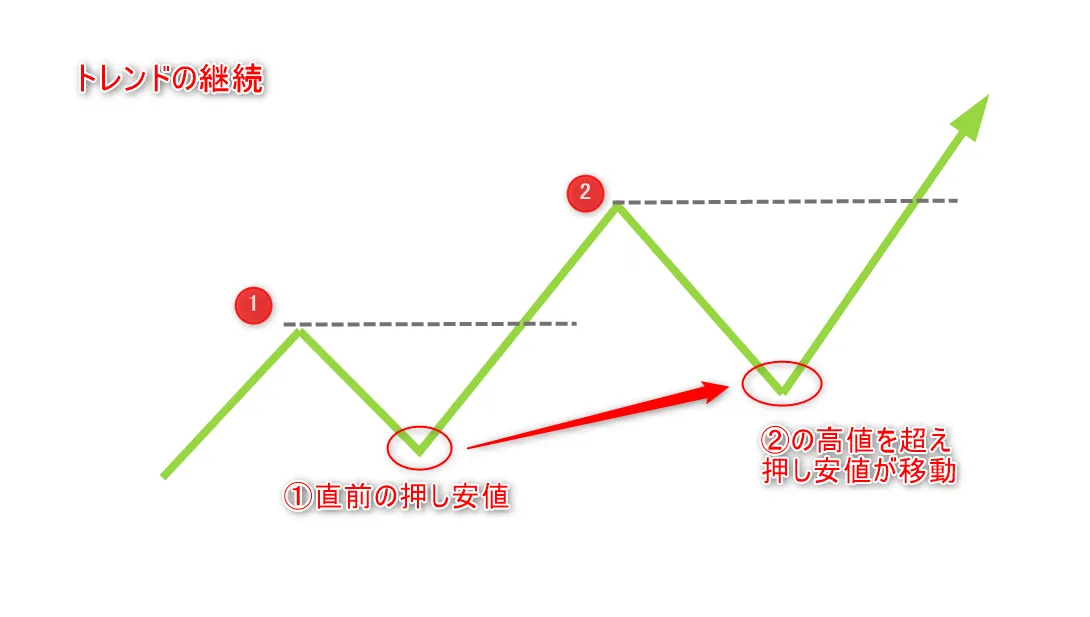
・continuation of the trend
As long as the pullback low continues to be updated, it can be said that we are in an uptrend, and as long as the pullback high continues to be updated, we are in a downtrend.
Since the pullback low moves as it updates the latest high, you can think of its movement as the continuation of the trend (the pullback high moves in the opposite direction).
・trend termination
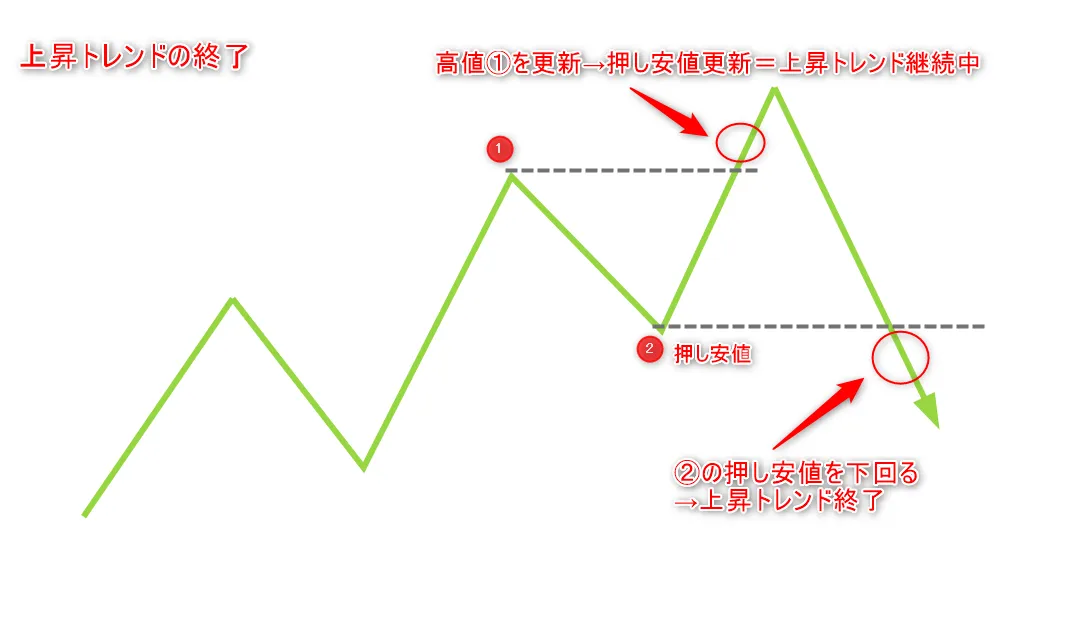
(In an uptrend)If the pullback low is broken below, we first determine that the prior uptrend has ended.
“End of trend”
・misleading patterns
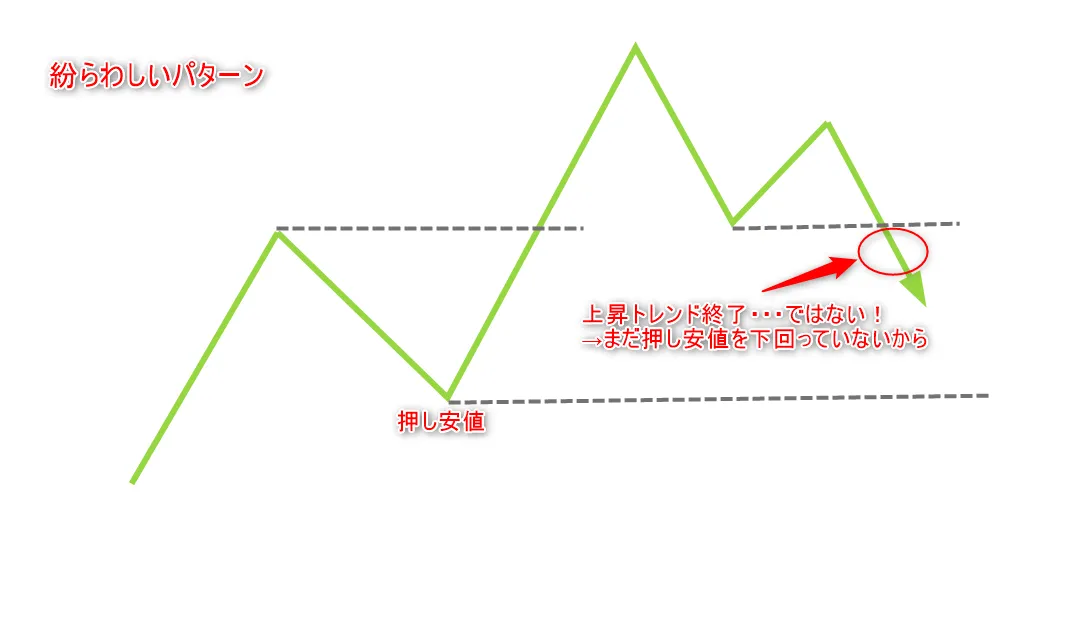
The red circled parts in the diagram are not a downtrend, but a phase of corrective declines. Overall it is in an uptrend.
・trend reversal
When the uptrend is rising, we explained that if the pullback low is broken below, that the uptrend up to that point has ended; however, in this case, ending does not mean the trend has reversed.
In other words, the uptrend has ended, but it is not yet a downtrend.
So, what needs to happen for a trend to reverse?
What we should recall here is that a rise in highs and highs continues to indicate uptrend, while a fall in highs and lows indicates a downtrend.
For the uptrend to end and a downtrend to begin,
① break below the pullback low → ② the low and high must both be lower.
Please look at the diagram below.
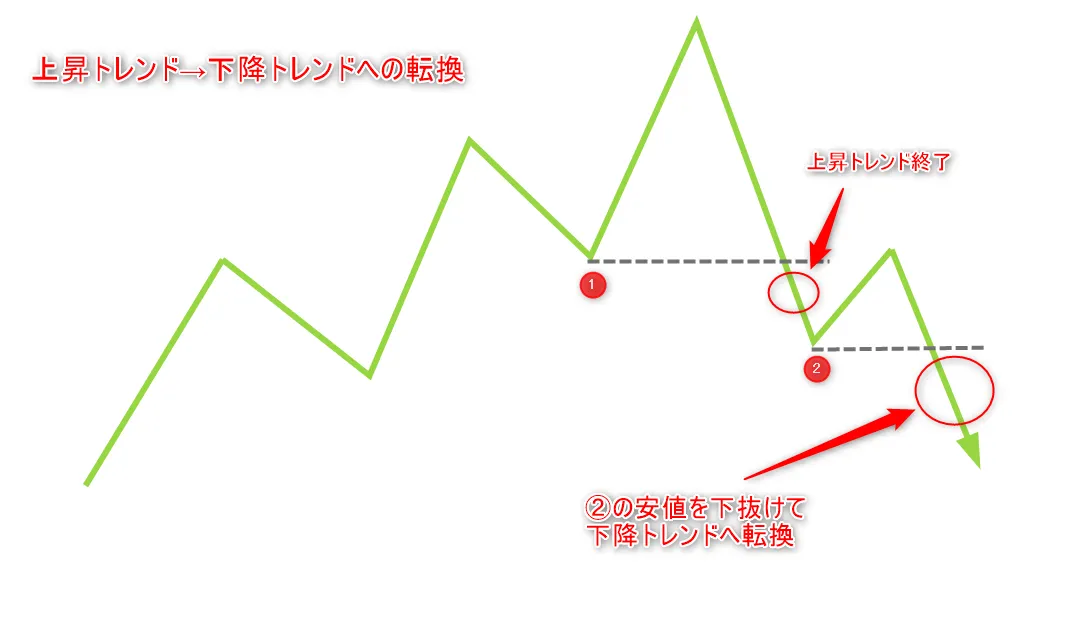
So, just because the pullback low is broken below does not instantly mean a downtrend has begun!
If you short thinking the downtrend will start, you may still see the market rising again or staying in a range for a while, catching you off guard.
Of course, if you understand this and short with the expectation of a downtrend, that is fine, but you should have proper stop losses and position sizing to exit quickly if the premise fails.
So far we have looked at the Dow Theory concepts of trend continuation, termination, and reversal; how did you find it?
For beginners, it may be hard to grasp in one read, so reread several times and practice on your own charts.
This part is extremely important in any analysis method, so make sure you truly internalize it and be able to judge quickly when you look at a chart.
Summary
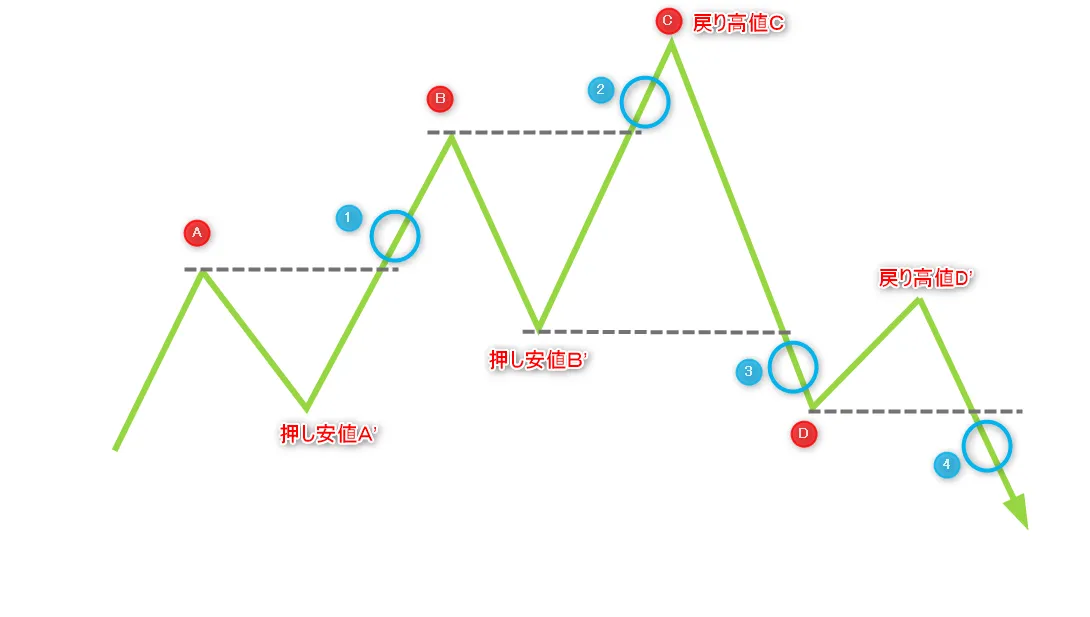
Finally, I’ve summarized the entire flow in a diagram for your reference.
・Description in chronological order
① Break above high A → confirm pullback low A’
② Break above high B → pullback low moves to B’ (trend continues)
③ Break below pullback low B → confirm pullback high C (uptrend ends)
④ Break below low D → pullback high moves to D’ (downtrend forms = trend reversal)
If you found this article helpful, please give a like or a heart! It motivates me!
For more details on the author's trading method, see here ↓

【Limited-time launch campaign!】 MMS Trading Encyclopedia— The truth about the “structural traps” that individual investors fall into and market microstructure analysis to foresee the footprints of big players — (A free preview is also available)

→The Secret of MTF Multi-Time Frame Analysis (A free preview is also available)
Next article is here ↓