

[Free Calculation Tool] For those who don’t know the appropriate FX lot size — Capital management decided by VaR (Value at Risk) bankruptcy probability
balsara_calc.zipFREE TOOL / MONEY MANAGEMENT
A method to reverse-calculate trading volume from bankruptcy probability
Even a winning method can lead to exit if the lot size is too big。This article introduces a way to quantify risk from win rate, risk-reward, and the amount at risk per trade, and to compare lot candidates using the attached free HTML calculator.
What matters first:This calculation result does not guarantee future profits or “safety.” It is a simplified model assuming past trading statistics are static. Please make your final judgment based on your own available funds, loss tolerance, and the conditions of the instruments you trade.
The real reason people hesitate over lots
A question like, “What is the correct lot if I have 1,000,000 yen?” cannot be answered by funds alone. Even with the same 0.1 lot, a trade with a 10-pip stop and a trade with a 100-pip stop will result in completely different losses.
What matters is not the lot itself, buthow much you would lose on average when you lose with that lot, and what percentage of your funds that represents.
Order of determining lots
Aggregate performance of the method → Create average profit and average loss for candidate lots → Compare bankruptcy probability → Lower the lot until an acceptable candidate is reached
What is Balsara’s bankruptcy probability
Here, “Balsara’s bankruptcy probability” is a capital management model that considers the probability of losing capital from win rate, the ratio of average profit to average loss, and the amount exposed per trade. In Nauzer J. Balsara’s book on money management, bankruptcy risk is treated by varying win rate, payoff ratio, and exposure to capital.
| Symbol | Meaning | Calculation |
|---|---|---|
| p | Win rate | Number of wins ÷ Total trades |
| q | Loss rate | 1 − p |
| B | Risk-reward ratio | Average profit ÷ Average loss |
| k | Number of money units | Total assets ÷ Average loss |
The attached calculator uses the expected valuep × B − qIf this is 0 or less, it displays bankruptcy probability as 100%. If the expected value is positive, it solves the characteristic equationp × x^(B+1) − x + q = 0for the root in the range 0–1 and displaysx^kas the bankruptcy probability.
The key is that the effect comes from “exponents,” not simple addition
As you increase the lot and the average loss grows, the money units k decrease. Therefore, bankruptcy probability is not linear and can jump abruptly.
How to use the calculator
Attached to the article isbalsara_calc.zipSave it and open the HTML file in a browser. It’s a single-file setup that uses no external libraries or network calls, so inputted funds and results are not sent anywhere.
- Total assets:Enter the trading capital used for this method
- Win rate:Enter from the same method on the same time frame
- Average profit:Total profit from winning trades ÷ number of wins
- Average loss:Absolute value of total losses ÷ number of losses
- Check result:Check whether expected profit is positive or bankruptcy probability is below your upper limit
Spreads, commissions, swaps, and slippage should be included in performance as much as possible. Do not mix multiple methods or market conditions; first collect trading data with the same rules in a substantial sample size.
Example: comparing 0.20 lot vs 0.10 lot
For demonstration, assume the following trading record.
| Item | 0.10 lot | 0.20 lot |
|---|---|---|
| Total assets | 1,000,000 yen | 1,000,000 yen |
| Win rate | 35% | 35% |
| Average profit | 20,000 yen | 40,000 yen |
| Average loss | 10,000 yen | 20,000 yen |
| Risk-reward ratio | 2.00 | 2.00 |
Doubling the lot doubles both average profit and average loss under the same assumptions. Win rate and risk-reward ratio do not change.
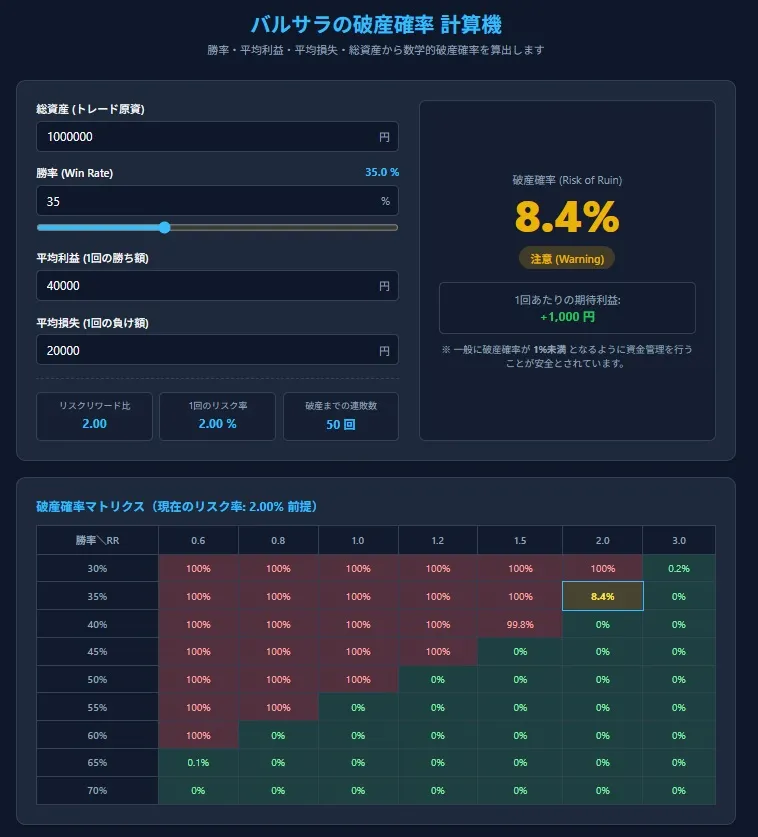
Candidate A: 0.20 lot
Enter average profit 40,000 yen and average loss 20,000 yen. The per-trade risk is 2%. Expected profit is +1,000 yen, but bankruptcy probability is8.4%, displayed as a caution.
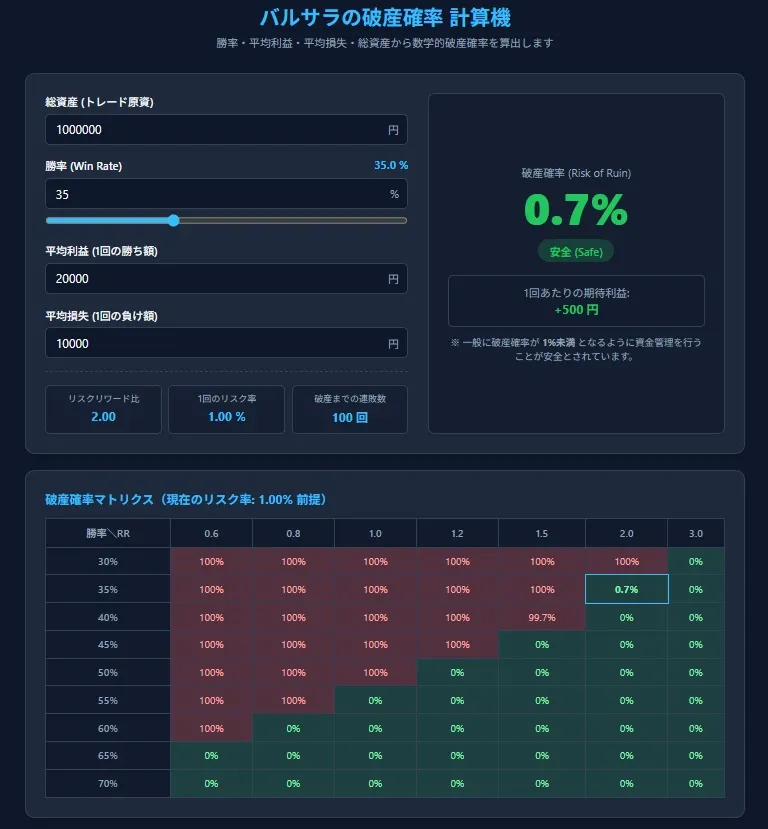
Candidate B: 0.10 lot
Reduce average profit to 20,000 yen and average loss to 10,000 yen. Per-trade risk is 1%, and bankruptcy probability falls to0.7%.
Conclusion for this example
Generally, it is preferable that bankruptcy probability be under 1%, so instead of 0.20 lot we consider0.10 lot or lessas the candidate. However, 1% is not an absolute safety standard. Depending on your own tolerance, further reducing it can also be correct.
Putting your own lot into the calculation
If you know the performance of a baseline lot, candidate lot amounts can be scaled proportionally.
Candidate lot
Baseline lot × (candidate’s average loss ÷ baseline lot’s average loss)
For example, if 0.10 lot has an average loss of 10,000 yen, then a trial with an average loss of 15,000 yen would be0.10 × 15,000 ÷ 10,000 = 0.15 lot. The average profit would also change by the same factor from 20,000 yen to 30,000 yen, and you can check the result with the calculator.
If stop distance is fixed each time, you can also determine it with the following approach.
Lot = Acceptable loss ÷ (Loss per 1 lot to stop − Cost)
The currency amount per 1 lot in FX and the value of 1 pip vary by broker, currency pair, and account currency. For CFDs use contract size, for futures use contracts, for stocks use number of shares.
Five cautions to avoid over-relying on numbers
- Past win rate is not fixed for the future:Performance changes with market conditions and rule changes.
- Averages conceal big drawdowns:Gaps, rapid moves, order rejects, and slippage can cause losses larger than the average.
- Sequential losses are not necessarily independent:Positions tied to the same market theme may all lose together.
- Margin trading may stop before zero:In practice, required margin and stop-out conditions can prevent trading earlier than the theoretical “zero capital” scenario.
- A low displayed figure is not a guarantee:A 0.0% display includes rounding, and does not mean you will never go bankrupt.
Summary
An appropriate lot is not chosen arbitrarily. First measure your method’s win rate, average profit, and average loss, then compare for each candidate lot the “per-trade risk” and the bankruptcy probability. This alone makes lot determination much more concrete.
The attached calculation tool can be used to compare numbers as often as you like by swapping values. Start with your current lot, then try half the lot to see how bankruptcy probability changes.
※ This article and the attached tool are intended for learning and information purposes and do not constitute an endorsement to buy or sell any financial product. Trading involves the risk of losing your principal.